
REMAX MARCH 2026 NATIONAL HOUSING REPORT SHOWS SPRING SALES PICKING UP
REMAX (NYSE:RMAX) March 2026 National Housing Report shows a strong spring ramp: home sales rose 31.6% month-over-month and 3.4% year-over-year across 50 metros.
Rhea-AI Summary
REMAX (NYSE:RMAX) March 2026 National Housing Report shows a strong spring ramp: home sales rose 31.6% month-over-month and 3.4% year-over-year across 50 metros. New listings jumped 29.0% from February but were 4.0% below March 2025. Median sales price was $440,000 (+2.3% MoM, +1.1% YoY). Active inventory rose 4.4% YoY; months' supply was 2.3.
Other notable metrics: close-to-list ratio 99%, average days on market 49, and varied local market performance across metros.
Positive
- Home sales +31.6% month-over-month
- Median sales price $440,000 (+1.1% YoY, +2.3% MoM)
- New listings +29.0% month-over-month
- Active inventory +4.4% year-over-year
- Close-to-list ratio 99% (unchanged YoY)
Negative
- New listings -4.0% year-over-year
- Average days on market 49 (+5 days YoY)
- Months' supply 2.3, still tight for buyers
- Baltimore new listings -28.0% year-over-year
Details
News Market Reaction – RMAX
On Apr 20, the day this news came out, RMAX closed 5.93% above the previous close.
Data tracked by StockTitan Argus for the Apr 20 session.
Key Figures
- MoM home sales change
- 31.6% increase
- March 2026 vs February 2026 across 50 metros
- YoY home sales change
- 3.4% increase
- March 2026 vs March 2025 across 50 metros
- New listings MoM
- 29.0% increase
- March 2026 vs February 2026 across 50 metros
- New listings YoY
- 4.0% decrease
- March 2026 vs March 2025 across 50 metros
- Median sales price
- $440,000
- March 2026, median of 50 metro areas
- Median price MoM change
- $10,000 (2.3%) increase
- March 2026 vs February 2026
- Close-to-list price ratio
- 99%
- Average across 50 metro areas in March 2026
- Months' supply of inventory
- 2.3 months
- Average across 50 metro areas in March 2026
Historical Context
-
Reported 18th straight year of leading U.S. peers in per‑agent productivity.
-
Announced strategic alignment with Zillow Preview to boost listing visibility and transparency.
-
Released February 2026 housing data showing modest price gains and mixed volume metrics.
-
Added a six‑office, 300‑agent Rhode Island brokerage to the REMAX network.
-
Showcased new products and partnerships at the REMAX R4 convention with 4,200+ attendees.
24h Move is the share-price change in the day after each event; other market factors may also have contributed.
Key Terms
close-to-list price ratio financial
days on market technical
months' supply of inventory technical
AI-generated analysis. How Rhea-AI works. Not financial advice.




March Home Sales Surge
DENVER , April 20, 2026 /PRNewswire/ -- Signaling the seasonal ramp-up of home sales ahead of the typical peak summer selling months, March home sales posted the largest month-over-month increase in three years. Inventory and median sales price also rose modestly compared to March 2025.
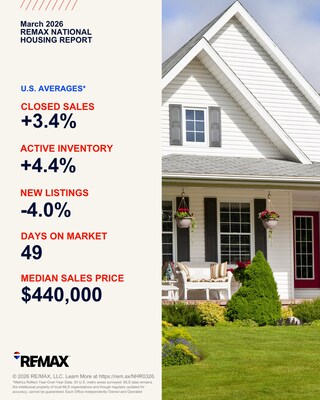
Across the 50 metro areas surveyed, March home sales jumped
"March's increase in sales is a signal that buyers and sellers are re-engaging as the spring market gets underway," said REMAX® President and Chief Growth Officer Chris Lim. "At the same time, moderate price growth and inventory changes could signal the pace is becoming more deliberate, pointing to a housing market that's shifting toward balance rather than momentum. This suggests the next phase of the housing market being defined less by speed and more by precision."
"In the
One potential factor contributing to the increase in national sales was an increase in new listings, which climbed
The median sales price increased to
Other metrics of note:
- Close-to-list price ratio: Buyers paid
99% of the asking price in March, up from98% in February and unchanged from March 2025. - Days on market: Homes spent an average of 49 days on the market, a seven-day improvement from 56 days in February – though five days longer than a year ago.
- Months' supply of inventory: Inventory totaled 2.3 months, down from 2.8 in February but up from 2.2 in March 2025.
- Close-to-list price ratio: Buyers paid
Highlights and local market results for March include:
New Listings
In the 50 metro areas surveyed in March 2026, the number of newly listed homes was down
New Listings: | |||
Market | Mar 2026 | Mar 2025 | Year-over-Year |
3,985 | 5,533 | -28.0 % | |
269 | 364 | -26.1 % | |
7,676 | 10,088 | -23.9 % | |
9,408 | 11,973 | -21.4 % | |
464 | 577 | -19.6 % | |
Closed Transactions
Of the 50 metro areas surveyed in March 2026, the overall number of home sales was up
Closed Transactions: | |||
Market | Mar 2026 | Mar 2025 | Year-over-Year |
165 | 119 | +38.7 % | |
938 | 770 | +21.8 % | |
1,042 | 871 | +19.6 % | |
300 | 252 | +19.0 % | |
783 | 671 | +16.7 % | |
Median Sales Price – Median of 50 metro area prices
In March 2026, the median of all 50 metro area sales prices was
Median Sales Price: | |||
Market | Mar 2026 | Mar 2025 | Year-over-Year |
+8.2 % | |||
+7.8 % | |||
+7.7 % | |||
+7.5 % | |||
+6.7 % | |||
Close-to-List Price Ratio – Average of 50 metro area prices
In March 2026, the average close-to-list price ratio of all 50 metro areas in the report was
Close-to-List Price Ratio: | |||
Market | Mar 2026 | Mar 2025 | Year-over-Year |
107.2 % | 104.8 % | +2.4 pp | |
102.7 % | 103.3 % | -0.6 pp | |
100.8 % | 100.8 % | 0.0 pp | |
100.8 % | 100.7 % | +0.1 pp | |
100.5 % | 101.3 % | -0.8 pp | |
*Difference displayed as change in percentage points | |||
Days on Market – Average of 50 metro areas
The average days on market for homes sold in March 2026 was 49, up five days compared to the average in March 2025 (44 days) and down seven days compared to February 2026 (56 days). Days on market is the number of days between when a home is first listed in an MLS and a sales contract is signed. The metro areas with the biggest year-over-year increase for days on market averages were
Days on Market: | |||
Market | Mar 2026 | Mar 2025 | Year-over-Year |
20 | 16 | +28.3 % | |
39 | 31 | +27.2 % | |
73 | 59 | +24.8 % | |
43 | 35 | +23.5 % | |
24 | 20 | +21.8 % | |
Months' Supply of Inventory – Average of 50 metro areas
The number of homes for sale in March 2026 was up
Months' Supply of Inventory: | |||
Market | Mar 2026 | Mar 2025 | Year-over-Year |
5.3 | 6.3 | -15.2 % | |
4.9 | 5.0 | -1.2 % | |
4.6 | 4.3 | +6.2 % | |
3.9 | 3.8 | +1.4 % | |
3.7 | 3.9 | -3.9 % | |
About the REMAX Network
As one of the leading global real estate franchisors, RE/MAX, LLC is a subsidiary of RE/MAX Holdings (NYSE: RMAX) with more than 145,000 agents in nearly 8,500 offices and a presence in more than 120 countries and territories. Nobody in the world sells more real estate than REMAX, as measured by residential transaction sides. REMAX was founded in 1973 by Dave and Gail Liniger, with an innovative, entrepreneurial culture affording its agents and franchisees the flexibility to operate their businesses with great independence. REMAX agents have lived, worked and served in their local communities for decades, raising millions of dollars every year for Children's Miracle Network Hospitals® and other charities. To learn more about REMAX, to search home listings or find an agent in your community, please visit www.remax.com. For the latest news about REMAX, please visit news.remax.com.
Report Details
The REMAX National Housing Report is distributed monthly on or about the 15th. The Report is based on MLS data for the stated month in 50 metropolitan areas, includes single-family residential property types, and is not annualized. For maximum representation, most of the largest metro areas in the country are represented, and an attempt is made to include at least one metro area in almost every state. Metro areas are defined by the Core Based Statistical Areas (CBSAs) established by the
Definitions
Closed Transactions are the total number of closed residential transactions during the given month. Months' Supply of Inventory is the total number of residential properties listed for sale at the end of the month (current inventory) divided by the number of sales contracts signed (pending listings) during the month. Where "pending" data is unavailable, an inferred pending status is calculated using closed transactions. Days on Market is the average number of days that pass from the time a property is listed until the property goes under contract. Median Sales Price for a metro area is the median sales price for closed transactions in that metro area. The nationwide Median Sales Price is calculated at the nationwide aggregate level using all sale prices from the included metro areas. The Close-to-List Price Ratio is the average value of the sales price divided by the list price for each closed transaction.
MLS data is provided by Constellation. While MLS data is believed to be reliable, it cannot be guaranteed. MLS data is constantly being updated, making any analysis a snapshot at a particular time. Every month, the previous period's data is updated to ensure accuracy over time. Raw data remains the intellectual property of each local MLS organization.

 View original content to download multimedia:https://www.prnewswire.com/news-releases/remax-march-2026-national-housing-report-shows-spring-sales-picking-up-302746344.html
SOURCE RE/MAX, LLC
FAQ
AI-generated questions and answers. How Rhea-AI works. Not financial advice.