SAGA Metals Reports First Drill Hole at Trapper North Zone of Radar Property Intercepts Extensive Oxide
Rhea-AI Summary
ZJK Industrial (reported symbol: SAGMF) released unaudited results for the six months ended June 30, 2025. Key highlights: revenue +52.21% to $24.70M, gross profit +63.01% to $12.32M, and gross margin up 7.09 percentage points. Net income rose to $5.84M and basic/diluted EPS was $0.10. Cash and equivalents were $14.45M at June 30, 2025. Expenses rose due to follow-on offering fees and market expansion, with G&A +119.66% and selling & marketing +201.87%. The company reported capacity upgrades (CNC, cold-forging) and a patent for an image-recognition SMT inspection-control system.
Positive
- Revenue +52.21% to $24.70M
- Gross profit +63.01% to $12.32M
- Gross margin increased by 7.09 percentage points
- Cash and cash equivalents increased to $14.45M
- Secured patent for image-recognition SMT inspection-control
Negative
- General and administrative expenses +119.66%
- Selling and marketing expenses +201.87%
- Net cash from operating activities fell to $2.48M from $7.73M
VANCOUVER, British Columbia, Nov. 18, 2025 (GLOBE NEWSWIRE) -- SAGA Metals Corp. ("SAGA" or the "Company") (TSXV: SAGA) (OTCQB: SAGMF) (FSE: 20H), a North American exploration company advancing critical mineral discoveries, is pleased to announce the completion of the first hole (R-0008) of the 2025-2026 drill program at the high-priority Trapper Zone on its
Highlights
- Extensive semi-massive to massive oxide layering: Drill hole R-0008 successfully intercepted wide intercepts of semi-massive to massive oxide layering. Oxides are comprised of titanomagnetite and ilmenite. Semi-massive to massive layering lithology has been logged as containing 35
-90% oxide content. R-0008 contained 156 m total, semi-massive to massive oxide layer out of the 270 meters. - Initial understanding of structural geometry: Drill hole R-0008 has yielded very informative information on the structure and orientation of the igneous layering of Trapper North. The layering contains localized mylonitic shearing enclosing the main oxide layers. Faulting and strain features have been valuable observations in understanding the geometry of layering.
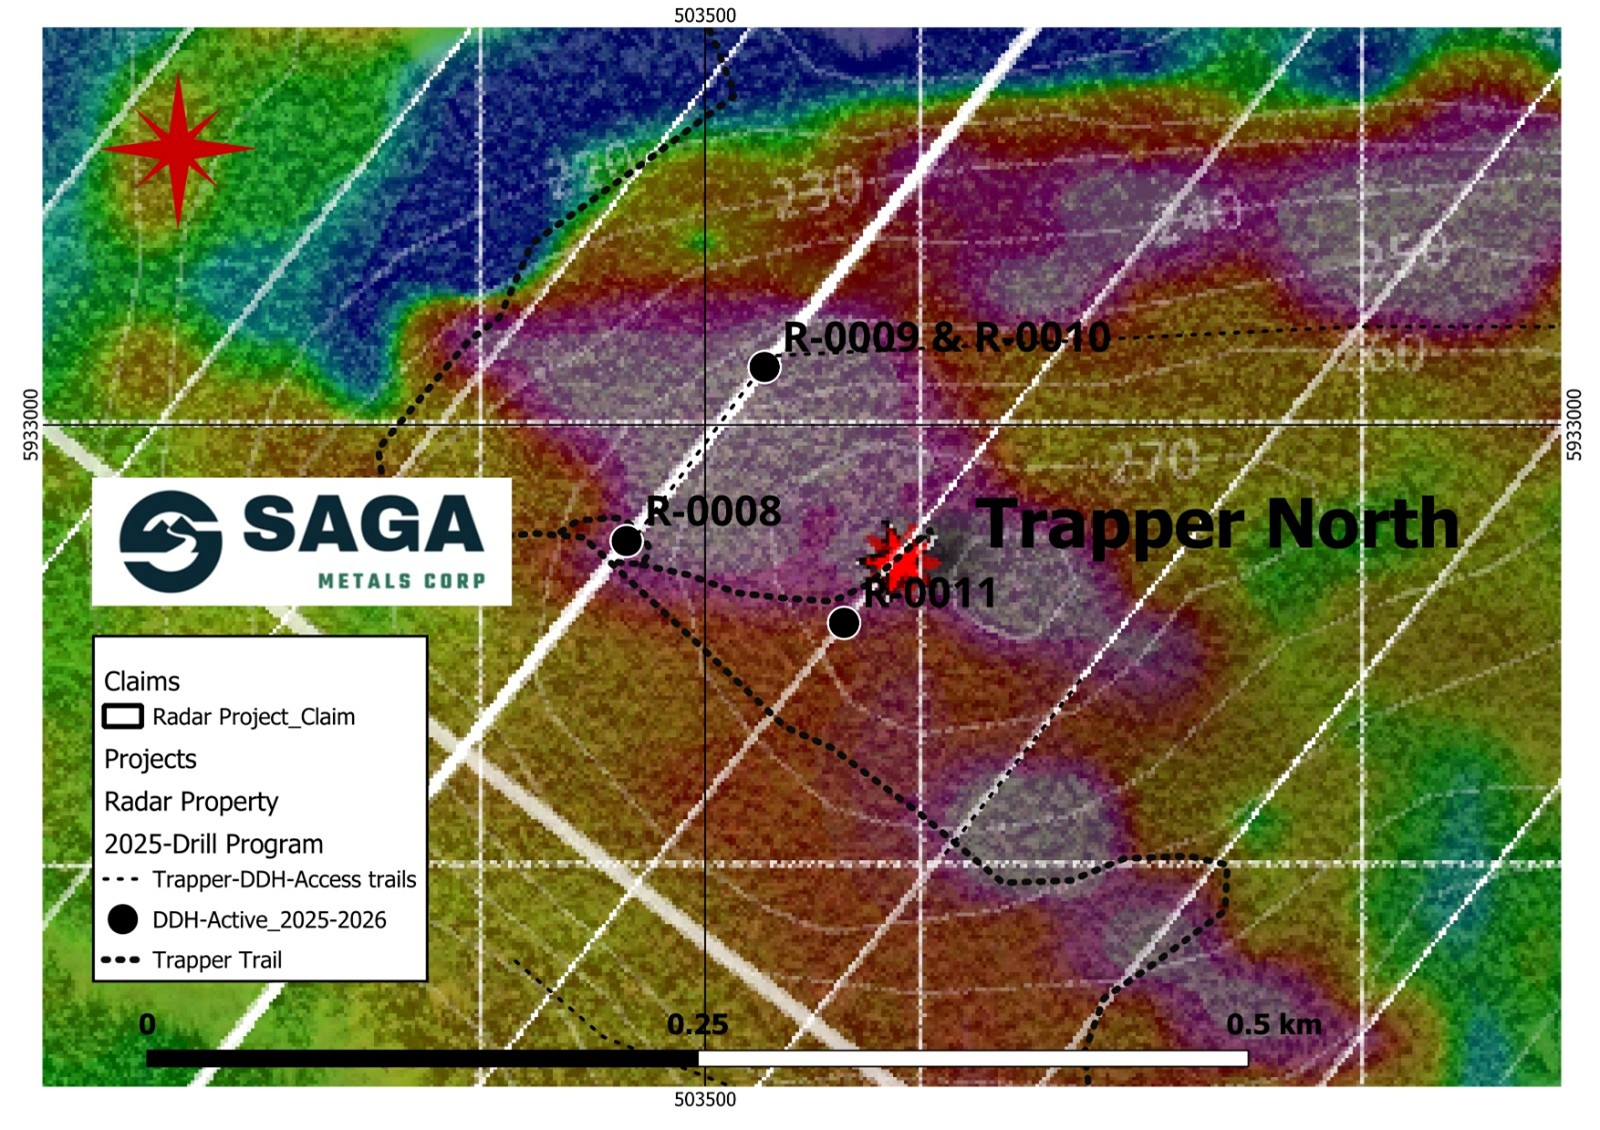
Figure 1: Radar Project’s Trapper Zone (North) depicting drill hole R-0008 (completed), R-0009 (active), R-0010 and R-0011 (proposed). The map highlights the Total Magnetic Intensity (TMI) anomaly from the 2025 ground survey and the oxide layering trend.
Drill Program Details
Drilling at Trapper employs oriented NQ core (47.6 mm diameter) to capture detailed structural data, including specialized survey tools from IMDEX to help teams track and model the faults, folding, layering orientation and ore body geometry. The program prioritizes 100-meter-spaced section drilling across the TMI magnetic-high anomalies, as defined by the 2025 summer field program.
- R-0008 (Azimuth 38°, Dip -45°): The first drill hole (R-0008) of Saga Metals' 2025-2026 drill program concentrated on drilling through what is believed to be a large fold of the oxide layering in Trapper North. Drill holes are collared (Azimuth 38°, Dip -45°) to intercept the northwest-trending 77-to-85-degree dipping oxide layering at the best perpendicular angle. Placed along a section to capture the true width of oxide layering of the south limb, the hole will additionally yield data on the fold and structures associated with the northern Limb.
- Extensive Oxide Layering: Unlike Hawkeye, where the team logged and sampled rhythmic banding of massive layering spread over a 200 m + intercept, SAGA’s team was pleased to have observed and logged at Trapper North a total of 156 meters of continuous semi-massive to massive oxide (35
-90% oxide) and additional sections of intercumulous oxide layering (20-35% oxide) over the entire 272 meter hole. - Next Steps: Drill is active on R-0009 and is currently at a depth of 200 m. Hole R-0009 lies 100 m north along section of R-0008 and is already adding extensive width to the semi-massive to massive layering as observed in the first hole. These two holes will yield a fully tested cross-section, which will form the foundation for all future work in Trapper North. Before moving to Trapper South, the team will step out an additional 100m to the east from R-0008 to add some continuity along strike to the impressive interceptions seen in the first hole.
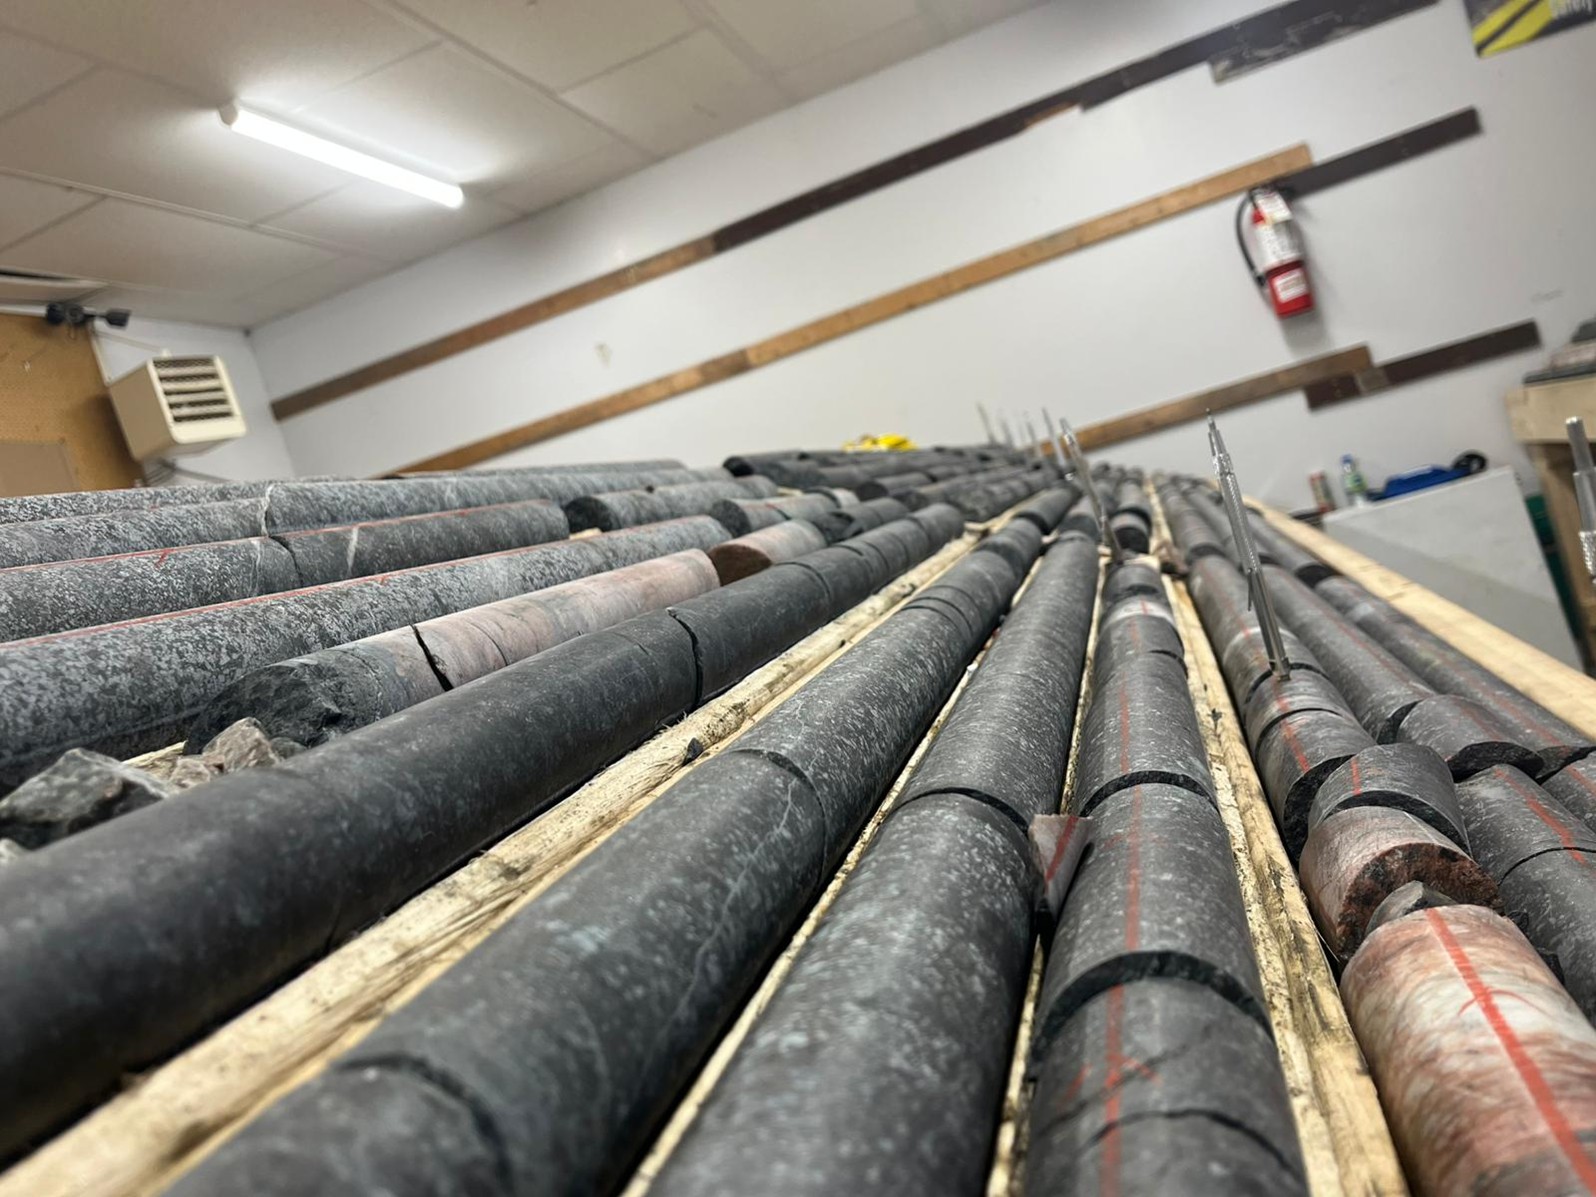
Figure 2: R-0008 core on the table in Cartwright, Labrador. Extensive magnetite rich oxide layers support several magnet pens along the core.
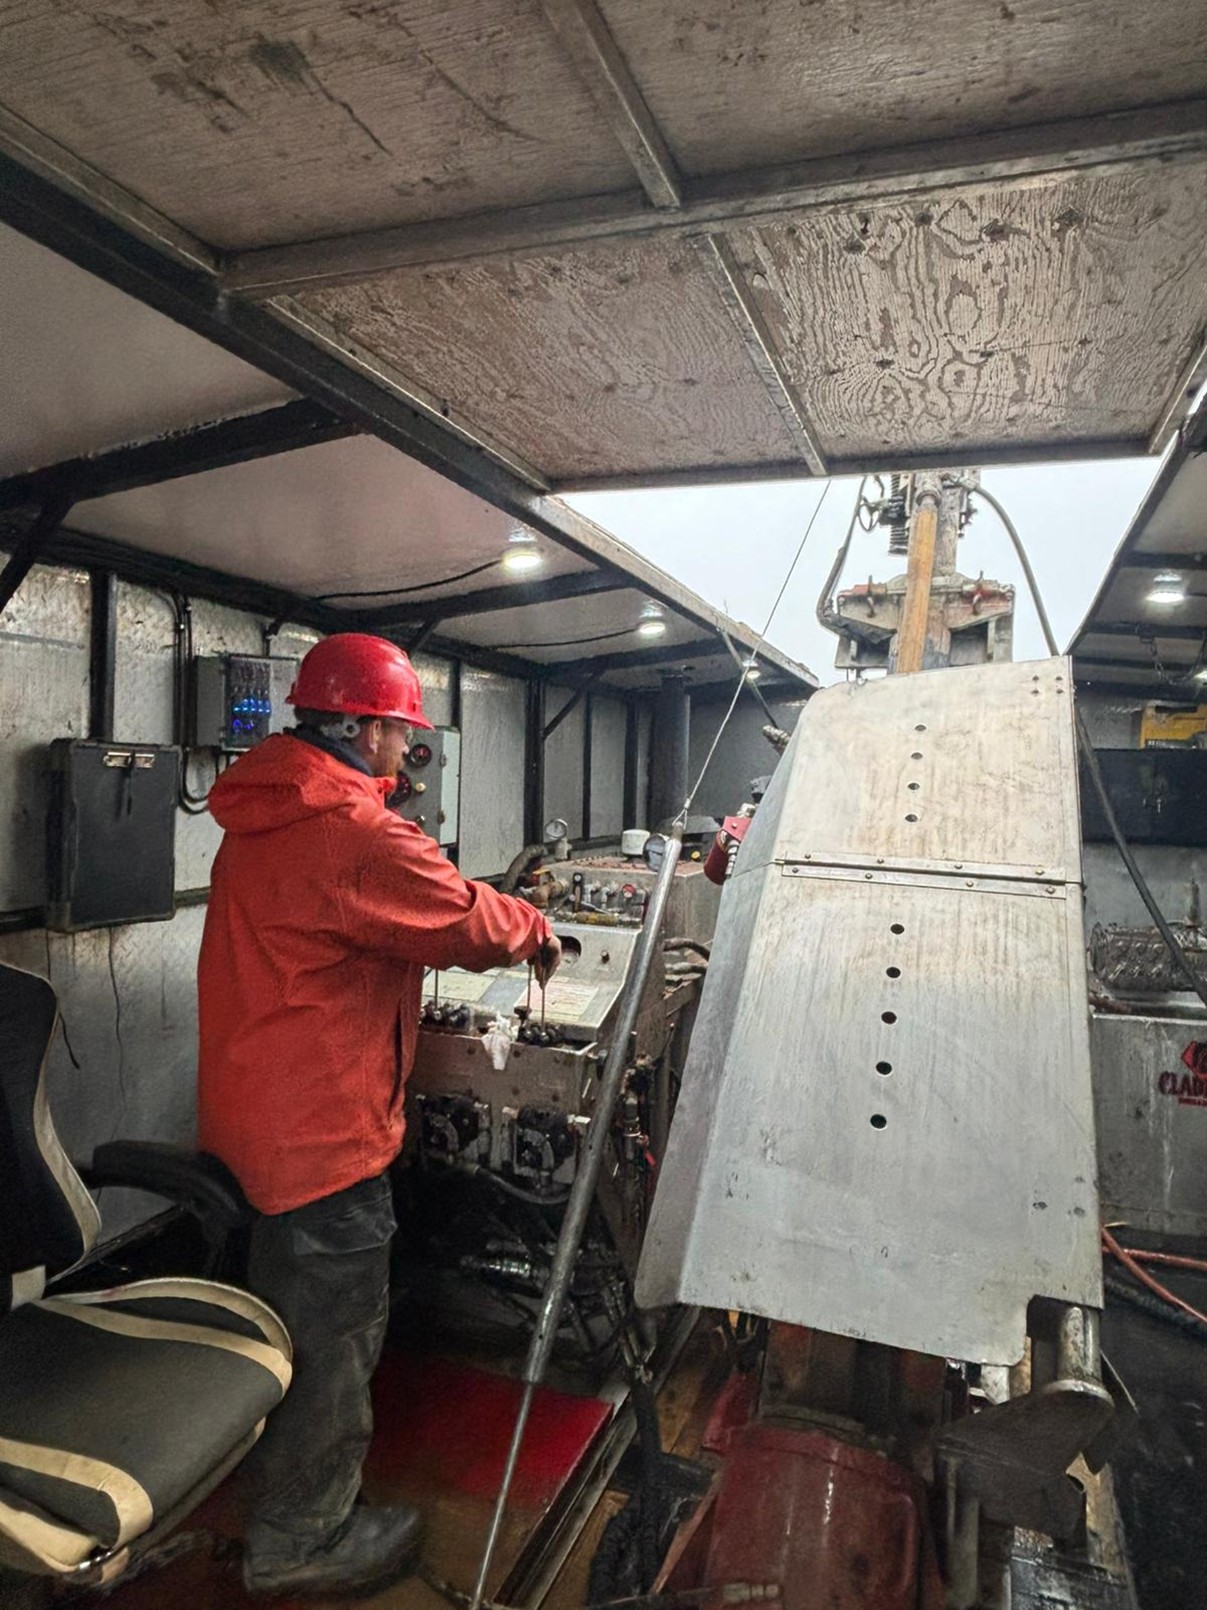
Figure 3: Gladiator Drilling hard at work with the drill rig active on R-0009 location.
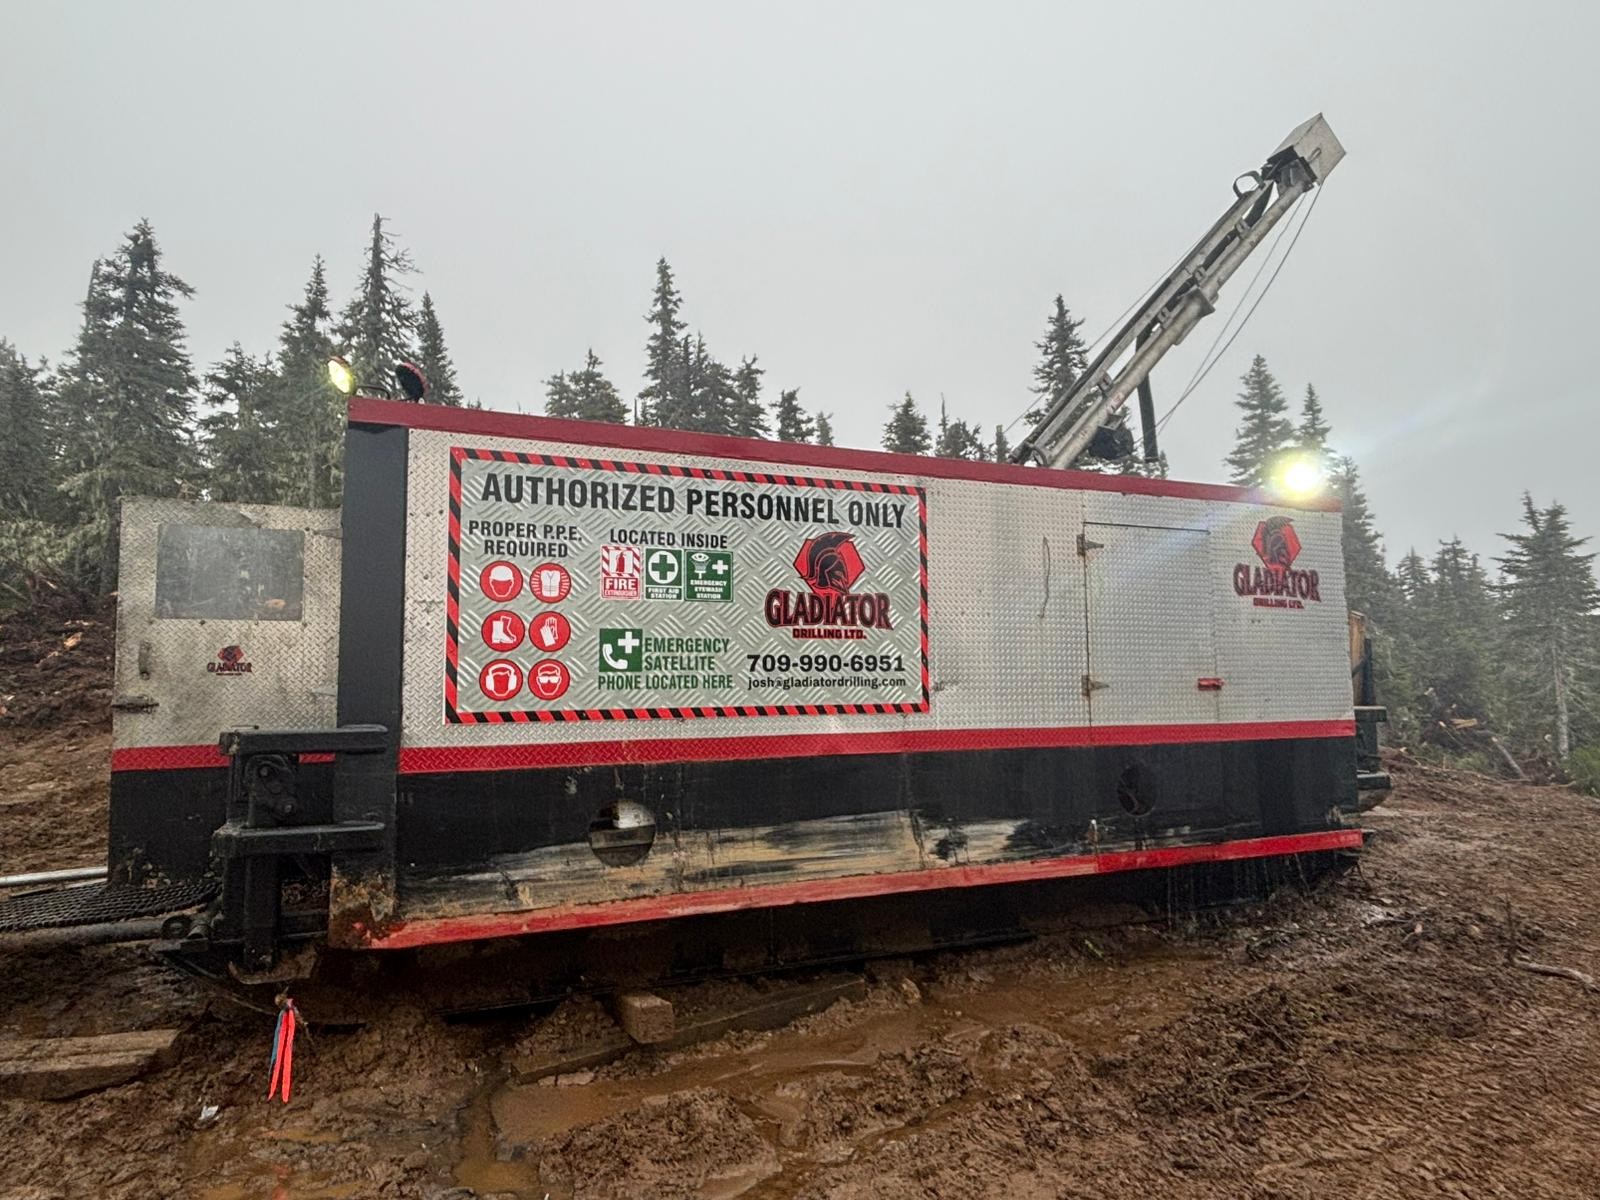
Figure 4: Gladiator Drill located in the Trapper zone (north) actively drilling hole R-009
Drill Program Objectives:
The Phase 1 Trapper Zone drill campaign will target:
- Grade continuity across a 3 km strike length.
- Oxide layering widths and continuity to true depths of about 200 meters.
- Integration of structural insights from trenching and drilling into collar orientation and drill design.
- Initial drilling of 1,500-2,500 m in 6-10 holes, each about 250 m in depth, will be completed before the December break.
- Test both the North and South sections of the Trapper zone before the December break to determine grade, width and structure before initiating the detailed grid and drill sections in 2026 for a mineral resource estimate.
- Drilling will be complemented by metallurgical sampling through the winter, with core from both the Hawkeye and Trapper zones undergoing detailed metallurgical testing.
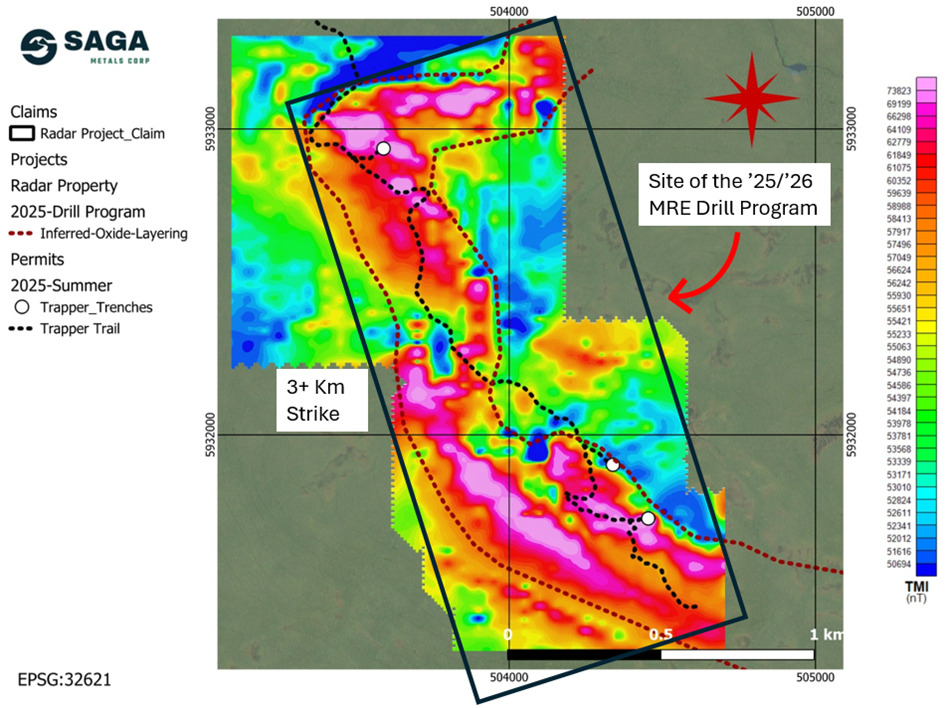
Figure 5: Radar Project’s Trapper Zone depicting a 3+ km Total Magnetic Intensity (TMI) anomaly from the 2025 ground survey and the oxide layering trend. The Trapper Trail (in black) will be the target of the planned 15,000 m diamond drilling program aimed at establishing Saga’s maiden mineral resource estimation.
The Radar Property spans 24,175 hectares and hosts the entire Dykes River intrusive complex (~160 km²), a unique position among Western explorers. Geological mapping, geophysics, and trenching have already confirmed oxide layering across more than 20 km of strike length, with mineralization open for expansion.
Vanadiferous titanomagnetite (“VTM”) mineralization at Radar is comparable to global Fe–Ti–V systems such as Panzhihua (China), Bushveld (South Africa), and Tellnes (Norway), positioning the Project as a potential strategic future supplier of titanium, vanadium, and iron to North American markets.
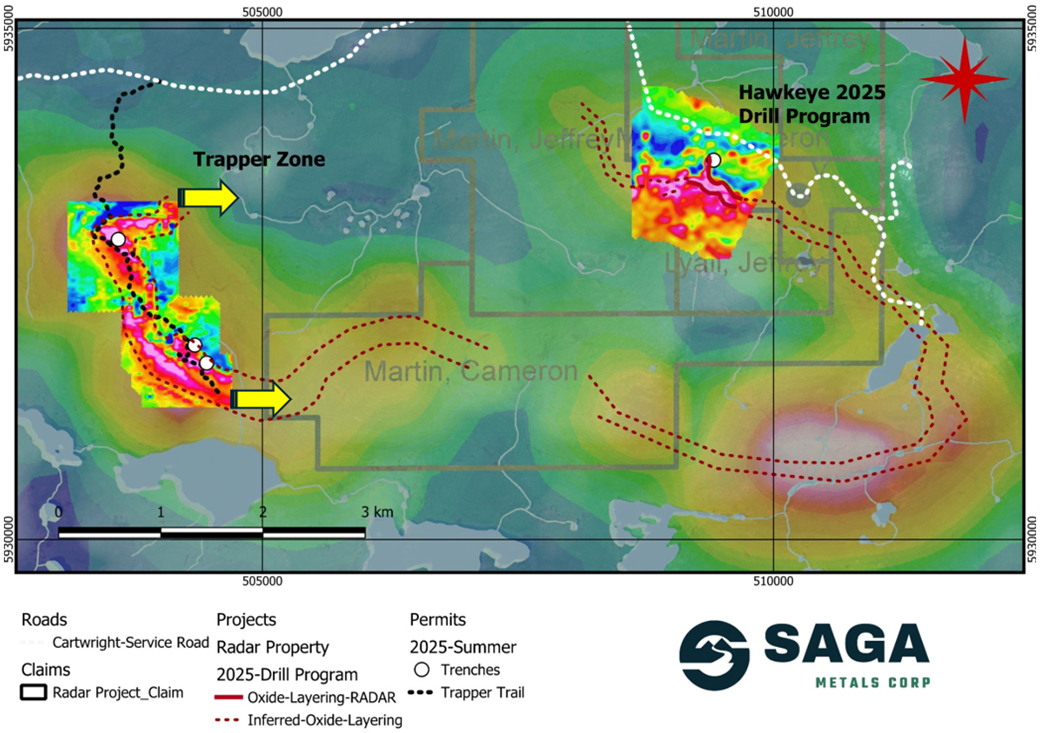
Figure 6: Radar Project’s prospective oxide layering zone extends for an inferred 20 km strike length, as shown on a compilation of historical airborne geophysics as well as ground-based geophysics in the Hawkeye and Trapper zones completed by SAGA in the 2024/2025 field programs. SAGA has demonstrated the reliability of the regional airborne magnetic surveys after ground-truthing and drilling in the 2024 and 2025 field programs.
“R-0008 was an exciting surprise that caught everyone off guard. We all expected a wide intercept through the fold, but no one imagined it would contain as much semi-massive to massive magnetite as it does. We all expected to see the same rhythmic banding as witnessed in Hawkeye,” commented Michael Garagan, CGO & Director of SAGA Metals. “We couldn’t have asked for a better start, and we’re already seeing the same mineralization in the second hole in the Trapper zone (R-0009).”
Qualified Person
Paul J. McGuigan, P. Geo., is an Independent Qualified Person as defined under National Instrument 43-101 and has reviewed and approved the technical information disclosed in this news release.
About SAGA Metals Corp.
SAGA Metals Corp. is a North American mining company focused on the exploration and discovery of a diversified suite of critical minerals that support the North American transition to supply security. The Radar Titanium Project comprises 24,175 hectares and entirely encloses the Dykes River intrusive complex, mapped at 160 km² on the surface near Cartwright, Labrador. Exploration to date, including a 2,200m drill program, has confirmed a large and mineralized layered mafic intrusion hosting vanadiferous titanomagnetite (VTM) with strong grades of titanium and vanadium. The Double Mer Uranium Project, also in Labrador, covers 25,600 hectares featuring uranium radiometrics that highlight an 18km east-west trend, with a confirmed 14km section producing samples as high as
Additionally, SAGA owns the Legacy Lithium Property in Quebec's Eeyou Istchee James Bay region. This project, developed in partnership with Rio Tinto, has been expanded through the acquisition of the Amirault Lithium Project. Together, these properties cover 65,849 hectares and share significant geological continuity with other major players in the area, including Rio Tinto, Winsome Resources, Azimut Exploration, and Loyal Metals.
With a portfolio that spans key commodities crucial for the clean energy future, SAGA is strategically positioned to play an essential role in critical mineral security.
On Behalf of the Board of Directors
Mike Stier, Chief Executive Officer
For more information, contact:
Rob Guzman, Investor Relations
SAGA Metals Corp.
Tel: +1 (844) 724-2638
Email: rob@sagametals.com
www.sagametals.com
Neither the TSX Venture Exchange nor its Regulation Service Provider (as that term is defined in the policies of the TSX Venture Exchange) accepts responsibility for the adequacy or accuracy of this release
Cautionary Disclaimer
This news release contains forward-looking statements within the meaning of applicable securities laws that are not historical facts. Forward-looking statements are often identified by terms such as “will”, “may”, “should”, “anticipates”, “expects”, “believes”, and similar expressions or the negative of these words or other comparable terminology. All statements other than statements of historical fact, included in this release are forward-looking statements that involve risks and uncertainties. In particular, this news release contains forward-looking information pertaining to the Company’s Radar Project. There can be no assurance that such statements will prove to be accurate and actual results and future events could differ materially from those anticipated in such statements. Important factors that could cause actual results to differ materially from the Company’s expectations include, but are not limited to, changes in the state of equity and debt markets, fluctuations in commodity prices, delays in obtaining required regulatory or governmental approvals, environmental risks, limitations on insurance coverage, inherent risks and uncertainties involved in the mineral exploration and development industry, particularly given the early-stage nature of the Company’s assets, and the risks detailed in the Company’s continuous disclosure filings with securities regulations from time to time, available under its SEDAR+ profile at www.sedarplus.ca. The reader is cautioned that assumptions used in the preparation of any forward-looking information may prove to be incorrect. Events or circumstances may cause actual results to differ materially from those predicted, as a result of numerous known and unknown risks, uncertainties, and other factors, many of which are beyond the control of the Company. The reader is cautioned not to place undue reliance on any forward-looking information. Such information, although considered reasonable by management at the time of preparation, may prove to be incorrect and actual results may differ materially from those anticipated. Forward-looking statements contained in this news release are expressly qualified by this cautionary statement. The forward-looking statements contained in this news release are made as of the date of this news release and the Company will update or revise publicly any of the included forward-looking statements only as expressly required by applicable law.
