
FACTORY DEMAND WEAKENS ACROSS MAJOR ECONOMIES IN OCTOBER: GEP GLOBAL SUPPLY CHAIN VOLATILITY INDEX
Global manufacturing demand showed continued weakness in October 2024, according to the GEP Global Supply Chain Volatility Index, which posted -0.39.
Sentiment and the balance of points
Rhea-AI Sentiment reads the wording of the document, how positive or negative its language is on a 1 to 5 scale. The balance of points shown with the takes weighs what the document actually discloses, so the two can disagree, for example when a trial that missed its main goal is described in upbeat language.
Rhea-AI Summary
Global manufacturing demand showed continued weakness in October 2024, according to the GEP Global Supply Chain Volatility Index, which posted -0.39. U.S. factories made their strongest cutbacks to buying volumes in nearly 18 months, while Europe's industrial recession persisted, particularly affecting Germany's automotive sector.
In contrast, China's factory production rebounded after three months of contraction, and India maintained strong expansion. The index indicated one of the highest levels of spare capacity at global suppliers in over a year, with October marking the 14th consecutive month of excess supply relative to manufacturing demand globally.
By region, North America recorded the weakest purchasing activity (-0.72), followed by Europe (-0.52), while Asia showed more resilience (-0.20).
Details
News Market Reaction – SPGI
The recorded move for SPGI in the trading session of this news was -0.75%.
Data tracked by StockTitan Argus. Session date unavailable.
AI-generated analysis. How Rhea-AI works. Not financial advice.




U.S. factories cut back purchases sharply, signaling heightened risks of manufacturing weakness spilling over into the broader economy in 2025- In contrast, Chinese factories report growth following three months of shrinking input purchasing
Europe's industrial recession shows no sign of abating, with German, French and Austrian producers at the heart of the downturn
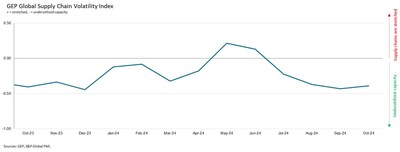
Suppliers feeding the world's largest markets reported contractions in October. Most notable was another steep rise in slack across North American supply chains due to declining factory activity in the
Suppliers feeding
Additionally, October is the 14th consecutive month that the items in short supply indicator has been negative. This shows an excess supply of commodities and intermediate goods relative to current manufacturing demand globally.
"We're in a buyers' market. October is the fourth straight month that suppliers worldwide reported spare capacity, with notable contractions in factory demand across
OCTOBER 2024 KEY FINDINGS
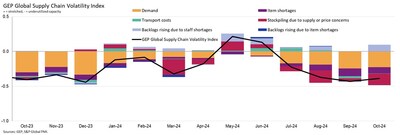
- DEMAND: Procurement activity remains weak across the globe. Demand for commodities, components and raw materials continues to contract, and at one of the steepest rates seen in 2024 so far. By region,
North America saw the weakest purchasing activity in October, followed byEurope . Input demand was more resilient inAsia , but still subdued overall. - INVENTORIES: Inventory drawdowns intensified across factories worldwide in October. Reports of safety stockpiling remained low by historical standards as companies look to make their warehouses leaner to preserve cash flow and tightly manage stocks in line with the weak order situation.
- MATERIAL SHORTAGES: The items in short supply indicator, an aggregate measure which tracks the availability of critical components and raw materials, remains low, pointing to robust supply levels.
- LABOR SHORTAGES: Reports of manufacturers' backlogs rising due to labor shortages ticked higher in October and were above the long-term average. However, factory employment levels have fallen in recent months, suggesting throughput has decreased as a result of lower workforce capacity and companies aren't clearing backlogs as quickly.
- TRANSPORTATION: Global transportation costs were in line with their long-run average during October.
REGIONAL SUPPLY CHAIN VOLATILITY
NORTH AMERICA : Index at -0.72, versus -0.78 previously. The latest figure is consistent with a substantial level of spare capacity atNorth America's suppliers.EUROPE : Index at -0.52, from -0.74. Albeit an improvement from September, the latest data indicate a continuation ofEurope's industrial recession.U.K. : Index fell notably to -0.40, from -0.12, its lowest level in six months, signaling a deterioration in theU.K. manufacturing sector.ASIA : Index at -0.20, from -0.36. While indicative of spare capacity, the level of slack is much lower than seen in Western markets.India continues to have a strongly positive influence on the region.
For more information, visit www.gep.com/volatility.
Note: Full historical data dating back to January 2005 is available for subscription. Please contact economics@spglobal.com.
The next release of the GEP Global Supply Chain Volatility Index will be 8 a.m. ET, Dec. 11, 2024.
About the GEP Global Supply Chain Volatility Index
The GEP Global Supply Chain Volatility Index is produced by S&P Global and GEP. It is derived from S&P Global's PMI® surveys, sent to companies in over 40 countries, totaling around 27,000 companies. The headline figure is a weighted sum of six sub-indices derived from PMI data, PMI Comments Trackers and PMI Commodity Price & Supply Indicators compiled by S&P Global.
- A value above 0 indicates that supply chain capacity is being stretched and supply chain volatility is increasing. The further above 0, the greater the extent to which capacity is being stretched.
- A value below 0 indicates that supply chain capacity is being underutilized, reducing supply chain volatility. The further below 0, the greater the extent to which capacity is being underutilized.
A Supply Chain Volatility Index is also published at a regional level for
About GEP
GEP® delivers AI-powered procurement and supply chain solutions that help global enterprises become more agile and resilient, operate more efficiently and effectively, gain competitive advantage, boost profitability and increase shareholder value. Fresh thinking, innovative products, unrivaled domain expertise, smart, passionate people — this is how GEP SOFTWARE™, GEP STRATEGY™ and GEP MANAGED SERVICES™ together deliver procurement and supply chain solutions of unprecedented scale, power and effectiveness. Our customers are the world's best companies, including more than 1,000 Fortune 500 and Global 2000 industry leaders who rely on GEP to meet ambitious strategic, financial and operational goals. A leader in multiple Gartner Magic Quadrants, GEP's cloud-native software and digital business platforms consistently win awards and recognition from industry analysts, research firms and media outlets, including Gartner, Forrester, IDC, ISG, and Spend Matters. GEP is also regularly ranked a top procurement and supply chain consulting and strategy firm, and a leading managed services provider by ALM, Everest Group, NelsonHall, IDC, ISG and HFS, among others. Headquartered in
About S&P Global
S&P Global (NYSE: SPGI) S&P Global provides essential intelligence. We enable governments, businesses and individuals with the right data, expertise and connected technology so that they can make decisions with conviction. From helping our customers assess new investments to guiding them through ESG and energy transition across supply chains, we unlock new opportunities, solve challenges and accelerate progress for the world. We are widely sought after by many of the world's leading organizations to provide credit ratings, benchmarks, analytics and workflow solutions in the global capital, commodity and automotive markets. With every one of our offerings, we help the world's leading organizations plan for tomorrow, today.
Media Contacts
Derek Creevey | Joe Hayes | S&P Global Market Intelligence |
GEP | Principal Economist | Email: Press.mi@spglobal.com |
Phone: +1 646-276-4579 | S&P Global Market Intelligence | |
Email: | Phone: +44-1344-328-099 | |
Email: joe.hayes@spglobal.com |

 View original content to download multimedia:https://www.prnewswire.com/news-releases/factory-demand-weakens-across-major-economies-in-october-gep-global-supply-chain-volatility-index-302301525.html
SOURCE GEP
FAQ
AI-generated questions and answers. How Rhea-AI works. Not financial advice.