
Presidio Property Trust, Inc. Announces Earnings for the Quarter Ended September 30, 2026
Sentiment and the balance of points
Rhea-AI Sentiment reads the wording of the document, how positive or negative its language is on a 1 to 5 scale. The balance of points shown with the takes weighs what the document actually discloses, so the two can disagree, for example when a trial that missed its main goal is described in upbeat language.
Rhea-AI Summary
Presidio Property Trust (Nasdaq:SQFT) reported a narrower common-stockholder net loss of approximately $1.1 million for the quarter ended September 30, 2026. Loss per share was $0.84 versus $1.53 a year earlier, while revenue fell to approximately $3.0 million from $4.2 million. Funds from operations, a supplemental non-GAAP operating measure, deteriorated to approximately negative $1.0 million from negative $0.8 million.
The July 1 Shea Center II foreclosure relieved approximately $16.4 million of debt but involved forfeiting the property and approximately $2.8 million. Mortgage debt fell to approximately $62.5 million from $94.6 million a year earlier. Rental operating costs, administrative expenses and interest expense declined. After quarter-end, the preferred-stock exchange settled October 6, issuing 823,757 common shares for 149,773 Series D preferred shares at 5.5 common shares per preferred share.
How this balance works
Rhea-AI gives every point it takes from this document a weight. Minor counts 1, Moderate 3 and Major 9, so one Major point outweighs several Minor ones. The bar adds up the weights on each side, and when neither side holds more than 65% of the total the balance reads Mixed.
It reads the document as published, with the same rules for every company, and it does not look at what the market expected or at how the stock traded, so a point can be objectively good on a day the stock falls.
Rhea-AI Sentiment measures something else, the tone of the wording.
Hollow bars mark forward-looking points. How the balance works
Positive
- Major pointQ3 common-stockholder net loss narrowed to approximately $1.1 million, or $0.84 per share, from $1.9 million, or $1.53.
- Major pointMortgage notes payable declined to approximately $62.5 million at September 30, 2026, from $94.6 million a year earlier.
- Major pointShea Center II foreclosure relieved approximately $16.4 million of nonrecourse debt; the debt-extinguishment gain was $1,007,432. 14× market cap
- Major pointDakota Center sale generated approximately $4.7 million net proceeds and a $3.4 million gain on January 14, 2026. 4× market cap
- Moderate point14 model-home sales generated approximately $6.3 million net proceeds and a $49,175 gain during nine months ended September 30, 2026. 5.4× market cap
- Moderate pointQ3 rental operating costs fell to approximately $1.1 million from $1.5 million; revenue share declined to 36.0% from 36.6%.
- Moderate pointQ3 administrative expenses fell to approximately $1.3 million from $1.5 million, although revenue share rose to 42.3% from 34.6%.
- Moderate point. Forward-looking: it has not happened yet and may not happen.Q3 interest expense declined to approximately $1.1 million from $1.5 million; management expects further decreases during 2026.
4 minor points
- Minor pointCost reductions included staff cuts, a voluntary 5% CEO salary reduction from April, and one fewer director from June.
- Minor point. Forward-looking: it has not happened yet and may not happen.Further staff reduction is planned for Q4 2026 as Presidio seeks additional administrative savings.
- Minor pointQ3 retail net income attributable to Presidio stockholders was $26,939.
- Minor pointQ3 office/industrial net income attributable to Presidio stockholders was $657,150.
Negative
- Major pointQ3 revenue fell to approximately $3.0 million from $4.2 million following commercial-property disposals and fewer model homes.
- Major pointShea Center II foreclosure transferred the property to lender Argentic Services Company; Presidio also forfeited approximately $2.8 million. 2.4× market cap
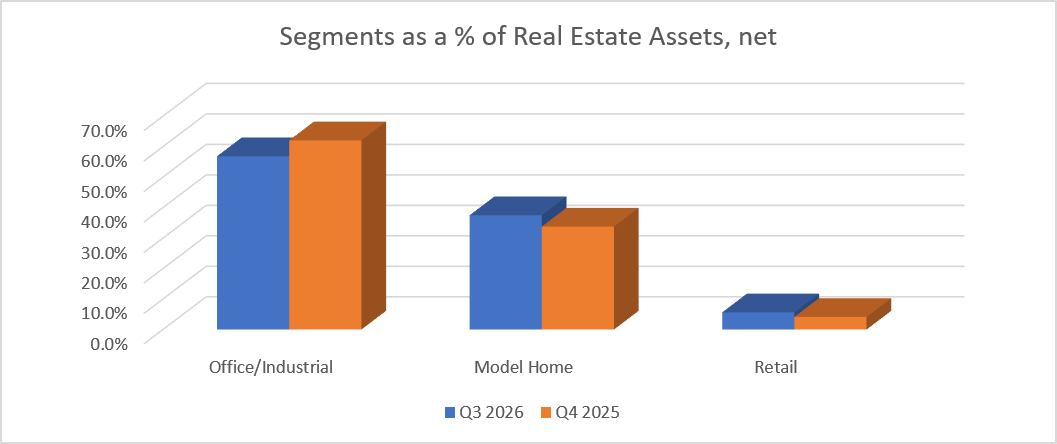
- Major pointNet real estate assets declined to approximately $78.8 million at September 30, 2026, from $113.3 million a year earlier.
- Moderate pointQ3 funds from operations deteriorated to approximately negative $1.0 million from negative $0.8 million.
- Moderate pointWeighted average debt interest rate rose to 6.63% at September 30, 2026, from 6.17% a year earlier.
- Moderate point823,757 common shares issued in the preferred exchange dilute common holders at 5.5 common shares per preferred share.
6 minor points
- Minor pointQ3 Core FFO decreased by about $276,921 to approximately negative $829,320 from negative $552,399.
- Minor pointQ3 model-home net loss attributable to Presidio stockholders was $218,337.
- Minor pointQ3 corporate and other net loss was $996,401.
- Minor pointQ3 model-home sales loss totaled $100,924.
- Minor pointQ3 model-home impairment charge was $112,437, a noncash reduction in asset carrying value.
- Minor pointQ3 loss on Conduit Pharmaceuticals marketable securities totaled $3,261.
News Explained
At
Key Figures
- Net loss attributable to common stockholders
- Approximately $(1.1) million vs. approximately $(1.9) million
- Three months ended September 30, 2026 vs. 2025
- Loss per share
- $(0.84) vs. $(1.53)
- Basic and diluted; three months ended September 30, 2026 vs. 2025
- Total revenue
- Approximately $3.0 million vs. approximately $4.2 million
- Three months ended September 30, 2026 vs. 2025
- FFO
- Approximately $(1.0) million vs. approximately $(0.8) million
- Three months ended September 30, 2026 vs. 2025; non-GAAP
- Core FFO
- Approximately $(829,320) vs. approximately $(552,399)
- Three months ended September 30, 2026 vs. 2025; non-GAAP
- Mortgage notes payable
- Approximately $62.5 million vs. approximately $94.6 million
- As of September 30, 2026 vs. September 30, 2025
- Nonrecourse loan obligation relieved
- Approximately $16.4 million
- Shea Center II foreclosure
- Common shares issued in exchange offer
- 823,757 shares
- In exchange for tendered Series D Preferred Stock; settlement occurred October 6, 2026
Key Terms
reit financial
ffo financial
core ffo financial
noi financial
nonrecourse loan financial
AI-generated analysis. How Rhea-AI works. Not financial advice.


SAN DIEGO, CA / ACCESS Newswire / November 16, 2026 / Presidio Property Trust, Inc. (Nasdaq:SQFT)(Nasdaq:SQFTP)(Nasdaq:SQFTW) (the "Company"), an internally managed, diversified real estate investment trust ("REIT"), today reported earnings for its quarter ended September 30, 2026.
"Our third quarter results reflect the continued progress in navigating the evolving office market. We are pleased with the NOI of our current portfolio, including the model homes and solid occupancy rates. We remain confident in our portfolio's ability to generate positive cash flow, while the Company continues to reduce G&A expenses," said Jack Heilbron, the Company's Chief Executive Officer.
The Quarter Ended September 30, 2026, Financial Results
Net loss attributable to the Company's common stockholders for the three months ended September 30, 2026 was approximately
• | Total revenues were approximately | |
• | Rental operating costs totaled approximately | |
• | G&A expenses for the three months ended September 30, 2026 and 2025 totaled approximately | |
• | On July 1, 2026, the foreclosure sale for Shea Center II took place, with the property awarded to Argentic Services Company LP, who acquired the property by placing a minimum credit bid valued at | |
• | We review the carrying value of each of our real estate properties regularly to determine if circumstances indicate an impairment in the carrying value of these investments exists. During the three months ended September 30, 2026 and 2025, we recognized non-cash impairment charges of approximately | |
• | Interest expense, including amortization of deferred finance charges, was approximately |
FFO (non-GAAP) totaled approximately (
We believe Core FFO (non-GAAP) provides a useful metric in comparing operations between reporting periods and in assessing the sustainability of our ongoing operating performance. Core FFO decreased by about
Acquisitions during the nine months ended September 30, 2026:
| • | The Company did not acquire any model homes or commercial properties. |
Dispositions during the nine months ended September 30, 2026:
| • | On January 14, 2026, the Company sold a commercial property, Dakota Center, to a single buyer for approximately | |
| • | On July 1, 2026, the foreclosure sale of Shea Center II took place, with the property going to Argentic Services Company LP "Argentic", the property's lender. The Company forfeited approximately | |
| • | The Company sold 14 model homes for approximately |
Segment Income during the three months ended September 30, 2026:
The following tables compare the Company's segment activity and NOI and adjusted NOI for Model Home income to its results of operations and financial position as of and for the three months ended September 30, 2026. The line items listed in the below NOI tables include the significant expenses considered by the CODM for cash allocations on future investments. The Other Non-Segment & Consolidating Items represent corporate activity, the investment in Conduit Pharmaceuticals, and other eliminating items for consolidation. The information for Corporate and Other are presented to reconcile back to the consolidated statement of operations, but is not considered a reportable segment. This includes the loss on Conduit marketable securities.
The following tables compare the Company's segment activity to its results of operations and financial position as of and for the three months ended September 30, 2026:
| For the Three Months Ended September 30, 2026 | ||||||||||||||||||||
| Retail | Office/Industrial | Model Homes | Corporate and Other | Total | ||||||||||||||||
Rental revenue | $ | 93,574 | $ | 1,802,349 | $ | 762,038 | $ | - | $ | 2,657,961 | ||||||||||
Recovery revenue | - | 281,526 | - | - | 281,526 | |||||||||||||||
Other operating revenue | - | 40,223 | 290 | 73 | 40,586 | |||||||||||||||
Total revenues | 93,574 | 2,124,098 | 762,328 | 73 | 2,980,073 | |||||||||||||||
Rental operating costs | 4,777 | 1,096,614 | 54,859 | (82,166 | ) | 1,074,084 | ||||||||||||||
Net Operating Income (NOI) | 88,797 | 1,027,484 | 707,469 | 82,239 | 1,905,989 | |||||||||||||||
Loss on Sale - Model Homes | - | - | (100,924 | ) | - | (100,924 | ) | |||||||||||||
Impairment of Model Homes | - | - | (112,436 | ) | - | (112,436 | ) | |||||||||||||
Adjusted NOI | $ | 88,797 | $ | 1,027,484 | $ | 494,109 | $ | 82,239 | $ | 1,692,629 | ||||||||||
The CODM reviews on a regular basis the GAAP performance of each segment, including the significant segment expenses reported for GAAP shown in the table below. Our significant segment expenses include consolidated expense categories presented in our consolidated statements of operations, as well as rental operating costs. This information is provided to the CODM and factors into the CODM's decision making for company-wide strategy. The following tables compare the Company's segment activity to its results of GAAP operations and financial position as of and for the three months ended September 30, 2026. The information for Corporate and Other are presented to reconcile back to the consolidated statement of operations, but is not considered a reportable segment as noted above.
| For the Three Months Ended September 30, 2026 | ||||||||||||||||||||
| Retail | Office/Industrial | Model Homes | Corporate and Other | Total | ||||||||||||||||
Revenues: | ||||||||||||||||||||
Rental income | $ | 93,574 | $ | 2,083,875 | $ | 762,038 | $ | - | $ | 2,939,487 | ||||||||||
Fees and other income | - | 40,223 | 290 | 73 | 40,586 | |||||||||||||||
Total revenue | 93,574 | 2,124,098 | 762,328 | 73 | 2,980,073 | |||||||||||||||
Costs and expenses: | ||||||||||||||||||||
Rental operating costs | 4,777 | 1,096,614 | 54,859 | (82,166 | ) | 1,074,084 | ||||||||||||||
General and administrative | - | 191 | 180,374 | 1,078,820 | 1,259,385 | |||||||||||||||
Depreciation and amortization | 22,928 | 695,400 | 165,870 | 473 | 884,671 | |||||||||||||||
Impairment of goodwill and real estate assets | - | - | 112,437 | - | 112,437 | |||||||||||||||
Total costs and expenses | 27,705 | 1,792,205 | 513,540 | 997,127 | 3,330,577 | |||||||||||||||
Other income (expense): | ||||||||||||||||||||
Interest expense - mortgage notes | (38,930 | ) | (679,256 | ) | (417,927 | ) | (1,342 | ) | (1,137,455 | ) | ||||||||||
Interest and other income, net | - | - | 2 | 5,256 | 5,258 | |||||||||||||||
Net loss in Conduit Pharmaceuticals marketable securities (see footnote 9) | - | - | - | (3,261 | ) | (3,261 | ) | |||||||||||||
Loss on sales of real estate, net | - | - | (100,924 | ) | - | (100,924 | ) | |||||||||||||
Gain on extinguishment of debt | - | 1,007,432 | - | - | 1,007,432 | |||||||||||||||
Income tax (expense) benefit | - | - | 54,217 | - | 54,217 | |||||||||||||||
Total other income (expense), net | (38,930 | ) | 328,176 | (464,632 | ) | 653 | (174,733 | ) | ||||||||||||
Net income (loss) | 26,939 | 660,069 | (215,844 | ) | (996,401 | ) | (525,237 | ) | ||||||||||||
Less: Income attributable to noncontrolling interests | - | (2,919 | ) | (2,493 | ) | - | (5,412 | ) | ||||||||||||
Net income (loss) attributable to Presidio Property Trust, Inc. stockholders | $ | 26,939 | $ | 657,150 | $ | (218,337 | ) | $ | (996,401 | ) | $ | (530,649 | ) | |||||||
Subsequent Events:
As previously disclosed, the Company's offer to exchange shares of its Series D Preferred Stock for shares of its Common Stock (the "Exchange Offer") commenced on September 2, 2026 and expired on October 2, 2026. As of October 2, 2026, 149,773 shares of Series D Preferred Stock, representing approximately
About Presidio Property Trust
Presidio is an internally managed, diversified REIT with holdings in model home properties which are triple-net leased to homebuilders, office, industrial, and retail properties. Presidio's model homes are leased to homebuilders located primarily in the sun belt states. Presidio's office, industrial, and retail properties are located primarily in Colorado, with properties also located in Maryland, North Dakota, Texas, and Southern California. For more information on Presidio, please visit Presidio's website at https://www.PresidioPT.com.
Definitions
Non-GAAP Financial Measures
Funds from Operations ("FFO") - The Company evaluates performance based on Funds From Operations, which we refer to as FFO, as management believes that FFO is a useful supplemental measure of operating performance. The[AP5.1] Company defines FFO as net income or loss (computed in accordance with GAAP), excluding gains (or losses) from sales of property, hedge ineffectiveness, acquisition costs of newly acquired properties that are not capitalized and lease acquisition costs that are not capitalized plus depreciation and amortization, including amortization of acquired above and below market lease intangibles and impairment charges on properties or investments in non-consolidated REITs, and after adjustments to exclude equity in income or losses from, and, to include the proportionate share of FFO from, non-consolidated REITs.
However, because FFO excludes depreciation and amortization as well as the changes in the value of the Company's properties that result from use or market conditions, each of which have real economic effects and could materially impact the Company's results from operations, the utility of FFO as a measure of the Company's performance is limited. In addition, other REITs may not calculate FFO in accordance with the NAREIT definition as the Company does, and, accordingly, the Company's FFO may not be comparable to other REITs' FFO. Accordingly, FFO should be considered only as a supplement to net income as a measure of the Company's performance.
Core Funds from Operations ("Core FFO") - We calculate Core FFO by using FFO as defined by NAREIT and adjusting for certain other non-core items. We exclude from our Core FFO calculation acquisition costs, loss on early extinguishment of debt, changes in the fair value of the earn-out, changes in fair value of contingent consideration, non-cash warrant dividends, other non-recurring expenses, and the amortization of stock-based compensation.
We believe Core FFO provides a useful metric in comparing operations between reporting periods and in assessing the sustainability of our ongoing operating performance. Other equity REITs may calculate Core FFO differently or not at all, and, accordingly, the Company's Core FFO may not be comparable to such other REITs' Core FFO.
Net Operating Income ("NOI") and Adjusted NOI for Model Homes - We calculate NOI as rental and other property revenues less property operating expenses as shown on our statement of operations. Operating expenses do not include depreciation and amortization, interest expense, corporate general and administrative expenses, acquisition costs, gains or losses on asset sales, impairment charges, or other non-property-specific items. Adjusted NOI for Model Home income takes NOI, plus or minus gain or loss on sale of model homes during the period, less any model home impairments taken during the period.
Cautionary Note Regarding Forward-Looking Statements
This press release contains statements that are "forward-looking statements" within the meaning of the Private Securities Litigation Reform Act of 1995, Section 27A of the Securities Act of 1933, as amended, and Section 21E of the Securities Exchange Act of 1934, as amended, and other federal securities laws. Forward-looking statements are statements that are not historical, including statements regarding management's intentions, beliefs, expectations, representations, plans or predictions of the future, and are typically identified by such words as "believe," "expect," "anticipate," "intend," "estimate," "may," "will," "should" and "could." Because such statements include risks, uncertainties and contingencies, actual results may differ materially from those expressed or implied by such forward-looking statements. These forward-looking statements are based upon the Company's present expectations, but these statements are not guaranteed to occur. Except as required by law, the Company disclaims any obligation to publicly update or revise any forward-looking statement to reflect changes in underlying assumptions or factors, for new information, data or methods, future events or other changes. Investors should not place undue reliance upon forward-looking statements. For further discussion of the factors that could affect outcomes, please refer to the "Risk Factors" section of the Company's documents filed with the SEC, copies of which are available on the SEC's website, www.sec.gov.
Investor Relations Contact:
Presidio Property Trust, Inc.
Investor Relations
IR@presidiopt.com
Telephone: (760) 471-8536
Presidio Property Trust, Inc. and Subsidiaries
Consolidated Balance Sheets
| September 30, | December 31, | |||||||
| 2026 | 2025 | |||||||
| (unaudited) | ||||||||
| ASSETS | ||||||||
| Real estate assets and lease intangibles: | ||||||||
Land | $ | 12,507,157 | $ | 16,390,250 | ||||
Buildings and improvements | 70,182,308 | 101,878,107 | ||||||
Tenant improvements | 11,441,185 | 17,645,103 | ||||||
Lease intangibles | 1,400,602 | 3,467,798 | ||||||
| Real estate assets and lease intangibles held for investment, cost | 95,531,252 | 139,381,258 | ||||||
| Accumulated depreciation and amortization | (26,500,435 | ) | (37,536,809 | ) | ||||
| Real estate assets and lease intangibles held for investment, net | 69,030,817 | 101,844,449 | ||||||
| Real estate assets held for sale, net | 9,734,179 | 6,805,255 | ||||||
| Real estate assets, net | 78,764,996 | 108,649,704 | ||||||
Other assets: | ||||||||
Cash, cash equivalents and restricted cash | 2,501,703 | 7,422,359 | ||||||
Deferred leasing costs, net | 1,029,840 | 1,340,853 | ||||||
Goodwill | 1,317,000 | 1,317,000 | ||||||
Investment in Conduit Pharmaceuticals marketable securities | 8,366 | 3,900 | ||||||
Deferred tax asset | 223,388 | 223,388 | ||||||
Other assets, net | 2,453,281 | 3,095,670 | ||||||
| Total other assets | 7,533,578 | 13,403,170 | ||||||
TOTAL ASSETS (1) | $ | 86,298,574 | $ | 122,052,874 | ||||
| LIABILITIES AND EQUITY | ||||||||
| Liabilities: | ||||||||
| Mortgage notes payable, net | $ | 54,808,942 | $ | 81,936,586 | ||||
| Mortgage notes payable related to real estate assets held for sale, net | 7,029,816 | 10,137,781 | ||||||
Mortgage notes payable, total net | 61,838,758 | 92,074,367 | ||||||
| Accounts payable and accrued liabilities | 2,525,892 | 3,302,187 | ||||||
| Accrued real estate taxes | 1,289,512 | 1,785,029 | ||||||
| Dividends payable | - | 190,220 | ||||||
| Lease liability, net | 20,627 | 40,108 | ||||||
| Below-market leases, net | - | 3,316 | ||||||
Total liabilities | 65,674,789 | 97,395,227 | ||||||
| Commitments and contingencies | ||||||||
| Equity: | ||||||||
| Series D Preferred Stock, | 9,737 | 9,737 | ||||||
| Series A Common Stock, | 13,169 | 13,142 | ||||||
| Additional paid-in capital | 187,319,317 | 186,762,388 | ||||||
| Dividends and accumulated losses | (173,846,168 | ) | (169,945,302 | ) | ||||
Total stockholders' equity before noncontrolling interest | 13,496,055 | 16,839,965 | ||||||
| Noncontrolling interest | 7,127,730 | 7,817,682 | ||||||
Total equity | 20,623,785 | 24,657,647 | ||||||
TOTAL LIABILITIES AND EQUITY | $ | 86,298,574 | $ | 122,052,874 | ||||
(1) As of September 30, 2026 and December 31, 2025, includes approximately
Presidio Property Trust, Inc. and Subsidiaries
Consolidated Statements of Operations
| For the Three Months Ended September 30, | For the Nine Months Ended September 30, | |||||||||||||||
| 2026 | 2025 | 2026 | 2025 | |||||||||||||
Revenues: | ||||||||||||||||
Rental income | $ | 2,939,487 | $ | 4,108,866 | $ | 10,379,899 | $ | 12,423,048 | ||||||||
Fees and other income | 40,586 | 87,276 | 188,049 | 277,018 | ||||||||||||
Total revenue | 2,980,073 | 4,196,142 | 10,567,948 | 12,700,066 | ||||||||||||
Costs and expenses: | ||||||||||||||||
Rental operating costs | 1,074,084 | 1,534,563 | 3,877,189 | 4,609,810 | ||||||||||||
General and administrative | 1,259,385 | 1,450,061 | 4,274,505 | 4,335,697 | ||||||||||||
Depreciation and amortization | 884,671 | 1,235,640 | 2,782,350 | 3,691,435 | ||||||||||||
Impairment of goodwill and real estate assets | 112,437 | 82,913 | 3,614,960 | 4,427,245 | ||||||||||||
Total costs and expenses | 3,330,577 | 4,303,177 | 14,549,004 | 17,064,187 | ||||||||||||
Other income (expense): | ||||||||||||||||
Interest expense - mortgage notes | (1,137,455 | ) | (1,499,075 | ) | (4,339,461 | ) | (4,487,415 | ) | ||||||||
Net gain (loss) in Conduit Pharmaceuticals marketable securities (see Note 9) | (3,261 | ) | (212 | ) | 4,467 | (184,672 | ) | |||||||||
Interest and other income, net | 5,258 | 5,263 | 15,613 | 15,618 | ||||||||||||
Gain (loss) on sales of real estate, net | (100,924 | ) | 300,975 | 49,175 | 5,078,302 | |||||||||||
Gain on disposition of assets and liabilities, net | - | - | 3,416,501 | - | ||||||||||||
Gain on extinguishment of debt | 1,007,432 | - | 1,007,432 | - | ||||||||||||
Income tax (expense) benefit | 54,217 | 14,871 | 9,530 | (13,630 | ) | |||||||||||
Total other income (expense), net | (174,733 | ) | (1,178,178 | ) | 163,257 | 408,203 | ||||||||||
Net loss | (525,237 | ) | (1,285,213 | ) | (3,817,799 | ) | (3,955,918 | ) | ||||||||
Less: (Income) loss attributable to noncontrolling interests | (5,412 | ) | (5,635 | ) | (83,067 | ) | (346,103 | ) | ||||||||
Net loss attributable to Presidio Property Trust, Inc. stockholders | $ | (530,649 | ) | $ | (1,290,848 | ) | $ | (3,900,866 | ) | $ | (4,302,021 | ) | ||||
Less: Series D Preferred Stock declared dividends | - | (571,179 | ) | - | (1,724,850 | ) | ||||||||||
Less: Series D Preferred Stock undeclared dividends in arrears | (570,541 | ) | - | (1,711,623 | ) | - | ||||||||||
Net loss attributable to Presidio Property Trust, Inc. common stockholders | $ | (1,101,190 | ) | $ | (1,862,027 | ) | $ | (5,612,489 | ) | $ | (6,026,871 | ) | ||||
Net loss per share attributable to Presidio Property Trust, Inc. common stockholders: | ||||||||||||||||
Basic & Diluted | $ | (0.84 | ) | $ | (1.53 | ) | $ | (4.27 | ) | $ | (4.95 | ) | ||||
Weighted average number of common shares outstanding - basic & dilutive | 1,316,939 | 1,215,943 | 1,315,595 | 1,216,873 | ||||||||||||
FFO AND CORE FFO RECONCILIATION
For the Three Months Ended September 30, | For the Nine Months Ended September 30, | |||||||||||||||
| 2026 | 2025 | 2026 | 2025 | |||||||||||||
Net (loss) income attributable to Presidio Property Trust, Inc. common stockholders | $ | (1,101,190 | ) | $ | (1,862,027 | ) | $ | (5,612,489 | ) | $ | (6,026,871 | ) | ||||
Adjustments: | ||||||||||||||||
Income attributable to noncontrolling interests | 5,412 | 5,635 | 83,067 | 346,103 | ||||||||||||
Depreciation and amortization | 884,671 | 1,235,640 | 2,782,350 | 3,691,435 | ||||||||||||
Amortization of above and below market leases, net | (829 | ) | (1,244 | ) | (3,316 | ) | (3,509 | ) | ||||||||
Impairment of real estate assets | 112,437 | 82,913 | 3,614,960 | 4,427,245 | ||||||||||||
Loss on Conduit marketable securities | 3,261 | 212 | (4,467 | ) | 184,672 | |||||||||||
Gain (loss) on sale of real estate | 100,924 | (300,975 | ) | (49,175 | ) | (5,078,302 | ) | |||||||||
Gain on extinguishment of debt | $ | (1,007,432 | ) | - | (1,007,432 | ) | - | |||||||||
Loss on assets and liabilities transferred to lender in satisfaction of debt | - | - | (3,416,501 | ) | - | |||||||||||
FFO | (1,002,746 | ) | $ | (839,846 | ) | $ | (3,613,003 | ) | $ | (2,459,227 | ) | |||||
Stock Based Compensation | $ | 173,426 | 287,447 | 556,956 | 831,823 | |||||||||||
Core FFO | (829,320 | ) | $ | (552,399 | ) | $ | (3,056,047 | ) | $ | (1,627,404 | ) | |||||
Weighted average number of common shares outstanding - basic | 1,316,939 | 1,215,943 | 1,315,595 | 1,216,873 | ||||||||||||
Core FFO / Wgt Avg Share | $ | (0.63 | ) | $ | (0.45 | ) | $ | (2.32 | ) | $ | (1.34 | ) | ||||
Quarterly Dividends / Share | $ | - | $ | - | $ | - | $ | - | ||||||||
SOURCE: Presidio Property Trust
View the original press release on ACCESS Newswire
FAQ
AI-generated questions and answers. How Rhea-AI works. Not financial advice.
What were Presidio Property Trust's Q3 2026 earnings?
Presidio reported a common-stockholder net loss of approximately $1.1 million, or $0.84 per basic and diluted share, for the three months ended September 30, 2026. That compares with a loss of approximately $1.9 million, or $1.53 per share, a year earlier. Revenue was approximately $3.0 million versus $4.2 million.
What were the results of Presidio Property Trust's preferred-stock exchange?
The exchange settled October 6, 2026, with 149,773 Series D preferred shares exchanged for 823,757 common shares. Participating holders received 5.5 common shares per preferred share. Validly tendered shares represented approximately 15.4% of the 973,736 outstanding Series D preferred shares, and all valid tenders were accepted.