
Gone in 7 days: One-third of homes sell within a week in the fastest markets, while others sit
Rhea-AI Summary
Z (Zillow) analysis shows the U.S. housing market running on two tracks: highly desirable homes sell very quickly while other listings linger. Nationally, 18.5% of homes went pending within seven days (Feb 2026) and 44.3% of those sold above list, versus 17.1% for all homes. In March 2026, the typical sold home went pending in 19 days while the median active listing age was 56 days.
Positive
- 18.5% of U.S. homes went pending within seven days (Feb 2026)
- 44.3% of fast-selling homes sold above list (Feb 2026)
- Typical sold home went pending in 19 days (March 2026)
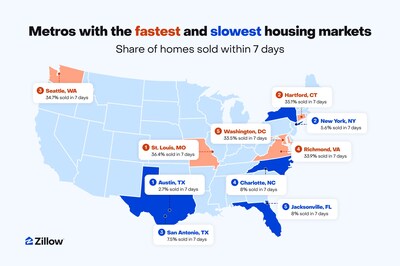
- St. Louis: 36.4% of homes sold within seven days (Feb 2026)
- Seattle: 34.7% of homes sold within seven days (Feb 2026)
Negative
- Median active listing age 56 days (March 2026)
- Gap between sold and active listings: 37 days (March 2026)
- Austin: only 2.7% of homes sold within seven days (Feb 2026)
- Miami median active listing age 104 days (March 2026)
News Market Reaction – ZG
In the Apr 23 session, ZG declined 3.39%, reflecting a moderate negative market reaction.
Data tracked by StockTitan Argus on the day of publication.
Key Figures
Historical Context
| Date | Event | Sentiment | 24h Move | Catalyst |
|---|---|---|---|---|
| Apr 21 | Rental market data | Neutral | -2.7% | Update on slowing rent growth and increased renter financial relief. |
| Apr 16 | Product engagement data | Positive | +1.1% | Launch of Zillow Buzz Index highlighting features boosting buyer engagement. |
| Apr 14 | Buyer behavior study | Neutral | +0.9% | Analysis of “dual shoppers” comparing for-sale and rental options. |
| Apr 10 | Platform adoption news | Positive | -1.8% | More brokerages joining Zillow Preview to expand pre-market exposure. |
| Apr 7 | Earnings date set | Neutral | +1.6% | Scheduling and webcast details for Q1 2026 earnings release. |
24h Move is the share-price change in the day after each event; other market factors may also have contributed.
Recent Zillow data- and product-focused releases have mostly seen modest price moves, with one notable divergence on a seemingly positive product update.
Over the past month, Zillow has released several data-driven and product news items. On Apr 21, it highlighted slowing rent growth and renter savings, with shares down 2.66%. Earlier, the Zillow Buzz Index launch on Apr 16 and the “dual shopper” analysis on Apr 14 saw modest gains of 1.10% and 0.91%. News on brokerages adopting Zillow Preview on Apr 10 coincided with a 1.75% decline. The May 6 earnings-date announcement on Apr 7 aligned with a 1.56% rise. Today’s housing-market split narrative continues this pattern of analytics-focused releases.
Key Terms
pending financial
median technical
bidding war financial
pre-approved financial
AI-generated analysis. How Rhea-AI works. Not financial advice.




Homes that sell within seven days are 2.6 times more likely to sell above asking price
- Nationally,
18.5% of homes went pending within seven days in February 2026, according to a Zillow analysis. In the fastest markets —St. Louis ,Hartford andSeattle — more than 1 in 3 homes sold that quickly. - Homes that went pending within seven days were 2.6 times more likely to sell above asking price than the typical listing in February 2026 —
44.3% of these fast-selling homes sold above list price, compared to17.1% of all homes. - Last month, the gap between how fast sold homes move and how long all active listings sit reached its widest point for any March since 2020. The typical sold home went pending after 19 days, while the median active listing had been on the market for 56 days.
The gap between how quickly sold homes move and how long all inventory sits reached its widest point for any March since 2020. This March, the typical home that sold went pending in 19 days, while the median age of all active listings was 56 days — a 37-day difference. That gap was as narrow as nine days in April 2022. The divide reflects a market where buyers have more choices and more leverage than they have had in years, and where homes that stand out are rewarded, while others wait.
Nationally,
"The cream of the crop is still selling fast, even in markets that have slowed considerably," said Orphe Divounguy, senior economist at Zillow. "However, higher costs are putting buyers under pressure, so they are more choosy than during the pandemic frenzy. Desirability is ultimately a function of price, and getting the pricing strategy right from day one can be the difference between a week on the market and months. Sellers who meet buyers' current expectations of price, versus higher price expectations during the pandemic, can still sell their home quickly."
The divergence between homes that sell fast and homes that linger reflects a return to a more balanced housing market. Challenging financial conditions have limited the pool of buyers, yet those still in the market are benefiting from more options and bargaining power. Sellers whose listings check every box sell quickly, while others linger.
The divide plays out differently depending on where you look. Several Midwest markets where relative affordability has kept demand steady — including
For buyers and sellers navigating this market, preparation and timing matter, and Zillow Preview℠ gives both sides an edge. Sellers can gain insights into their pricing and marketing strategy by gauging buyer interest before their home officially hits the market. Buyers get early visibility into homes heading to market directly in their regular Zillow search, giving them time to connect with an agent, get pre-approved and be ready to move the moment a home goes live. In a market where the best homes are gone in days, that head start can make all the difference.
Metro Area* | Median Days to | Median Age of All | Share of Homes | Share of Homes | Share of All Homes |
19 | 56 | 18.5 % | 44.3 % | 17.1 % | |
25 | 49 | 5.6 % | 53.4 % | 33.9 % | |
18 | 40 | 14.4 % | 56.1 % | 32.3 % | |
8 | 26 | 25.0 % | 58.5 % | 24.7 % | |
25 | 52 | 13.6 % | 36.5 % | 9.6 % | |
34 | 73 | 11.9 % | 28.1 % | 7.5 % | |
7 | 24 | 33.5 % | 62.1 % | 28.1 % | |
9 | 27 | 28.2 % | 60.7 % | 29.2 % | |
53 | 104 | 8.9 % | 19.4 % | 4.9 % | |
33 | 59 | 8.6 % | 36.1 % | 12.7 % | |
8 | 18 | 28.7 % | 69.6 % | 32.6 % | |
28 | 52 | 21.1 % | 24.4 % | 8.9 % | |
13 | 20 | 17.6 % | 79.6 % | 55.0 % | |
26 | 55 | 12.4 % | 48.9 % | 23.8 % | |
12 | 40 | 22.8 % | 61.7 % | 23.9 % | |
9 | 26 | 34.7 % | 58.1 % | 25.4 % | |
18 | 27 | 11.5 % | 68.0 % | 22.9 % | |
15 | 33 | 19.2 % | 59.0 % | 31.5 % | |
36 | 69 | 16.3 % | 29.9 % | 8.2 % | |
13 | 35 | 25.2 % | 51.0 % | 17.8 % | |
8 | 27 | 30.4 % | 62.8 % | 29.7 % | |
6 | 25 | 36.4 % | 57.2 % | 27.5 % | |
34 | 73 | 14.8 % | 31.2 % | 8.4 % | |
18 | 48 | 8.0 % | 43.5 % | 12.6 % | |
42 | 82 | 7.5 % | 23.2 % | 7.0 % | |
12 | 40 | 27.4 % | 59.3 % | 23.2 % | |
11 | 26 | 24.6 % | 62.5 % | 29.5 % | |
11 | 48 | 22.3 % | 47.1 % | 16.3 % | |
6 | 27 | 33.1 % | 37.9 % | 17.4 % | |
40 | 54 | 2.7 % | 40.0 % | 8.9 % | |
30 | 64 | 13.6 % | 29.4 % | 10.0 % | |
5 | 24 | 33.3 % | 55.1 % | 23.1 % | |
6 | 26 | 30.3 % | 47.7 % | 19.8 % | |
13 | 35 | 22.3 % | 32.7 % | 11.4 % | |
7 | 25 | 31.2 % | 52.9 % | 24.0 % | |
11 | 17 | 22.4 % | 83.9 % | 60.9 % | |
23 | 51 | 17.2 % | 20.7 % | 6.6 % | |
23 | 33 | 9.4 % | 48.9 % | 25.4 % | |
11 | 26 | 24.6 % | 75.8 % | 35.6 % | |
46 | 65 | 8.0 % | 22.7 % | 7.3 % | |
13 | 32 | 11.0 % | 79.7 % | 39.0 % | |
25 | 58 | 21.2 % | 31.5 % | 12.3 % | |
15 | 36 | 19.5 % | 45.9 % | 12.3 % | |
24 | 60 | 17.4 % | 25.4 % | 10.7 % | |
6 | 16 | 33.9 % | 58.5 % | 28.2 % | |
12 | 39 | 25.1 % | 35.6 % | 13.6 % | |
38 | 91 | 12.8 % | 26.0 % | 5.4 % | |
15 | 35 | 20.2 % | 50.3 % | 17.8 % | |
6 | 11 | 35.1 % | 86.1 % | 48.9 % | |
10 | 16 | 14.6 % | 78.6 % | 41.8 % | |
15 | 54 | 22.3 % | 50.6 % | 17.5 % |
*Table ordered by market size
About Zillow Group
Zillow Group, Inc. (Nasdaq: Z and ZG) is reimagining real estate to make home a reality for more and more people.
As the most visited real estate app and website in
Zillow's ecosystem spans the entire home journey — from dreaming and shopping to renting, buying, selling and financing.
Zillow Group's affiliates, subsidiaries and brands include Zillow®, Zillow Premier Agent®, Zillow Home Loans®, Zillow Rentals®, Zillow® New Construction, Trulia®, StreetEasy®, Out East®, HotPads®, Follow Up Boss®, ShowingTime®, dotloop® and Zillow® Closing.
All marks herein are owned by MFTB Holdco, Inc., a Zillow affiliate. Zillow Home Loans, LLC is an Equal Housing Lender, NMLS #10287 (www.nmlsconsumeraccess.org). © 2026 MFTB Holdco, Inc., a Zillow affiliate.
(ZFIN)

 View original content to download multimedia:https://www.prnewswire.com/news-releases/gone-in-7-days-one-third-of-homes-sell-within-a-week-in-the-fastest-markets-while-others-sit-302751216.html
SOURCE Zillow