Table of Contents
| | | | | |
1.0 EXECUTIVE SUMMARY | 1 |
1.1 Introduction | 1 |
1.2 Property Description and Location | 1 |
1.3 Project geology | 1 |
1.4 Exploration Drilling and Sampling | 1 |
1.5 Mineral Resource Estimate | 1 |
1.6 Mineral Processing and Metallurgical Testing | 1 |
1.7 Mining Operations | 1 |
1.8 Processing and Recovery Options | 2 |
1.9 Infrastructure | 3 |
1.10 Capital and Operating Costs | 3 |
1.11 Economic Analysis | 4 |
1.12 Environmental Studies, Permits and Social or Community Impact | 6 |
1.13 Conclusions | 7 |
1.14 Recommendations | 7 |
2.0 INTRODUCTION AND TERMS OF REFERENCE | 11 |
2.1 Terms of References | 11 |
2.2 Sources of Information | 11 |
2.3 Units and Currency | 13 |
3.0 RELIANCE ON OTHER EXPERTS | 18 |
3.1 Expert Reports | 18 |
3.2 Reliance on External Reports and Exports | 18 |
4.0 ACCESSIBILITY, CLIMATE, LOCAL RESOURCES, INFRASTRUCTURE AND PHYSIOGRAPHY | 19 |
4.1 Location | 19 |
4.2 Property Description and Mineral Tenure | 19 |
4.3 Moroccan Mining Legislation | 22 |
4.4 Acquisition History | 23 |
5.0 ACCESSIBILITY, CLIMATE, LOCAL RESOURCES, INFRASTRUCTURE AND PHYSIOLOGY | 24 |
5.1 Accessibility | 24 |
5.2 Infrastructure | 24 |
5.3 Climate | 25 |
5.4 Physiography | 25 |
5.5 Local Resources | 26 |
6.0 HISTORY | 28 |
6.1 Exploration and Mining History | 28 |
6.2 Antiquity to the sixteenth Century | 28 |
6.3 BRPM Exploration (1956-1985) | 28 |
6.4 Underground Development and Mining (1986–1992) | 28 |
6.5 BRPM Exploration (1993–1998) | 29 |
6.6 Maya Gold & Silver / Aya Gold & Silver (2013–Present) | 29 |
6.7 Historical Production | 30 |
6.8 Previous Mineral Resource Estimates | 30 |
7.0 GEOLOGICAL SETTING AND MINERALIZATION | 33 |
7.1 Regional Geology | 33 |
7.2 Property Geology | 35 |
7.3 Structural Geology | 38 |
AYA GOLD & SILVER INC., BOUMADINE POLYMETALLIC PROJECT i
| | | | | |
7.4 Mineralization | 41 |
8.0 DEPOSIT TYPES | 44 |
9.0 EXPLORATION | 45 |
9.1 Geochemical Sampling/Grab Samples | 46 |
9.2 Historical Underground Sampling | 46 |
9.3 Bulk Sample | 46 |
9.4 Hyperspectral Surveys | 47 |
9.5 Geophysical Surveys | 49 |
9.6 Geological and Structural Mapping | 50 |
9.7 Trenching | 51 |
10.0 DRILLING | 52 |
10.1 Diamond Drilling | 53 |
10.2 Reverse Circulation Drilling | 54 |
10.3 Collar Surveys | 54 |
10.4 Downhole Surveys | 54 |
10.5 Hole Orientation | 55 |
10.6 Core Orientation | 58 |
10.7 SRK Comments | 59 |
11.0 SAMPLE PREPARATION, ANALYSIS AND SECURITY | 60 |
11.1 Introduction | 60 |
11.2 Core Recovery | 60 |
11.3 Geotechnical Logging | 62 |
11.4 Geological Logging | 62 |
11.5 Photography | 64 |
11.6 Density and Moisture Measurements | 65 |
11.7 Sampling | 67 |
11.8 Core Cutting and Drying | 68 |
11.9 Sample Preparation | 69 |
11.10 Sample Analysis | 71 |
11.11 Sample Security | 72 |
11.12 SRK Comments | 72 |
12.0 DATA VERIFICATION | 73 |
12.1 Introduction | 73 |
12.2 SRK Verification | 73 |
12.3 Verification by the Company and External Consultants | 78 |
12.4 Aya Drillcore re-Sampling | 79 |
12.5 Quality Assurance and Quality Control (QA/QC) Analysis | 83 |
12.6 SRK Comments | 99 |
13.0 MINERAL PROCESSING AND METALLURGICAL TESTING | 100 |
13.1 Introduction | 100 |
13.2 Results Interpretation and Conclusions | 127 |
13.3 Future Testwork Recommendations | 132 |
14.0 MINERAL RESOURCE ESTIMATES | 134 |
14.1 Introduction | 134 |
14.2 Mineral Resource Estimation Procedure | 134 |
14.3 Database Construction, Validation and Comments | 135 |
14.4 Exploratory Data Analysis | 137 |
14.5 Topography and Collars Adjustments | 140 |
14.6 Geological Modelling and Domaining | 141 |
14.7 Lithological Model | 142 |
AYA GOLD & SILVER INC., BOUMADINE POLYMETALLIC PROJECT ii
| | | | | |
14.8 Weathering Model | 142 |
14.9 Mineralization Model | 143 |
14.10 Data Conditioning and Post-domaining Statistical Analysis | 149 |
14.11 Block Model Validation | 170 |
14.12 Mineral Resource Classification | 186 |
14.13 Mining Depletion | 188 |
14.14 Reconciliation | 190 |
14.15 Economic and Technical Input Parameters | 191 |
14.16 Mineral Resource Statement | 195 |
14.17 Sensitivity Analysis | 198 |
14.18 Aya Peer Review | 199 |
14.19 Comparison to Previous Estimates | 199 |
15.0 MINERAL RESERVE ESTIMATES | 202 |
16.0 MINING METHODS | 203 |
16.1 General Description of the Mining Project | 203 |
16.2 Geotechnical | 203 |
16.3 Hydrogeology | 206 |
16.4 Boumadine Mining Method | 206 |
16.5 Open Pit Mining | 207 |
16.6 Underground Mining | 215 |
16.7 Stockpile Management | 227 |
16.8 Production Plan | 229 |
16.9 Electrical Underground Distribution | 245 |
16.10 Ventilation | 247 |
17.0 RECOVERY METHODS | 257 |
17.1 Process Design | 257 |
17.2 Process Plant Description | 261 |
17.3 Plant Consumption | 267 |
18.0 PROJECT INFRASTRUCTURE | 269 |
18.1 Overall Site Development | 269 |
18.2 Site Access Road | 269 |
18.3 Process Plant Facilities | 269 |
18.4 Mining Facilities | 272 |
18.5 Tailings Storage Facility | 274 |
18.6 Water Supply | 275 |
18.7 Water Management | 276 |
18.8 Power Supply | 276 |
18.9 Sewage and Solid Waste Management | 276 |
18.10 Security | 277 |
18.11 Accommodations | 277 |
18.12 Administration and Plant Buildings | 277 |
18.13 Concentrate Transportation and Loadout | 277 |
19.0 MARKET STUDIES AND CONTRACTS | 278 |
19.1 Market Studies | 278 |
19.2 Commodity price projections | 278 |
19.3 Contracts | 278 |
20.0 ENVIRONMENTAL STUDIES, PERMITS, AND SOCIAL
OR COMMUNITY IMPACTS | 280 |
20.1 Project Setting | 280 |
20.2 Environmental and Social Studies | 280 |
AYA GOLD & SILVER INC., BOUMADINE POLYMETALLIC PROJECT iii
| | | | | |
20.3 Permitting and Applicable Standards | 281 |
20.4 Key Environmental and Social Issues | 281 |
21.0 CAPITAL AND OPERATING COSTS | 284 |
21.1 Capital Cost Estimate | 284 |
21.2 Operating Cost Estimate | 294 |
22.0 ECONOMIC ANALYSIS | 305 |
22.1 Introduction | 305 |
22.2 Fiscal and Economic Parameters | 305 |
22.3 Project Timing | 306 |
22.4 Financial Modelling | 306 |
22.5 Results | 312 |
22.6 Conclusion | 318 |
23.0 ADJACENT PROPERTIES | 319 |
24.0 OTHER RELEVANT DATA AND INFORMATION | 321 |
24.1 Project Execution Schedule | 321 |
24.2 Pyrite Treatment | 321 |
25.0 INTERPRETATION AND CONCLUSIONS | 323 |
25.1 Geology | 323 |
25.2 Mining | 324 |
25.3 Processing | 325 |
25.4 Infrastructure | 326 |
25.5 Environmental and Social | 327 |
25.6 Capital Cost Estimate | 327 |
25.7 Operating Cost Estimate | 328 |
25.8 Economic Analysis | 328 |
25.9 Conclusion | 329 |
26.0 RECOMMENDATIONS | 330 |
26.1 Summary | 330 |
26.2 Geology | 330 |
26.3 Mining | 332 |
26.4 Processing | 334 |
26.5 Tailings Storage Facility | 335 |
26.6 Environmental and Social | 336 |
26.7 Project Next Phases | 336 |
27.0 REFERENCES | 337 |
28.0 CERTIFICATES | 341 |
Appendix A QAQC CRM PLOTS | 356 |
Appendix B STATISTICAL VALIDATION - UNCAPPED VS CAPPED COMPOSITES | 427 |
Appendix C STATISTICAL VALIDATION _ CAPPED COMPOSITES VS BLOCK MODEL | 465 |
AYA GOLD & SILVER INC., BOUMADINE POLYMETALLIC PROJECT iv
List of Tables
| | | | | |
Table 1-1 SRK Mineral Resource Statement for the Boumadine Project, Morocco, as at an effective date of 28 February 2026 | 1 |
Table 1-2 Capital Expenditures including Sustaining and Closing Costs | 4 |
Table 1-3 Operating Costs for First 5 Years of Operation and for LOM | 4 |
Table 1-4 Key Economic Results | 5 |
Table 1-5 Additional Economic Model Outputs | 5 |
Table 2-1 Qualified Persons Responsible for this Report | 12 |
Table 2-2 Terminology and Abbreviations | 13 |
Table 2-3 Unit Measurement Abbreviations | 17 |
Table 4-1 | 21 |
Table 6‑1 BRPM 1998 Boumadine MRE (not compliant with modern CRIRSCO reporting codes) | 30 |
Table 6‑2 GoldMinds Geoservices Inc 2019 Boumadine MRE (effective date 15 February 2019) | 31 |
Table 6‑3 P&E Mining Consultants Inc. 2024 Boumadine MRE (effective date 23 February 2024) | 32 |
Table 6‑4 Aya Gold & Silver Inc. 2025 Boumadine MRE (effective date 24 February 2025) | 32 |
Table 9‑1 Summary of Aya Database provided by Aya to SRK | 45 |
Table 10‑1 Table showing drilling contractor and downhole survey used between 2022 and 2026 (as provided by source Aya) | 55 |
Table 13-1 Summary of Testwork Programs | 100 |
Table 13-2 Head Analysis of Fresh Rock and Tailings Samples | 102 |
Table 13-3 Roast-CIL Results | 105 |
Table 13-4 POX-CIL Results | 105 |
Table 13-5 CIL Results Summary | 107 |
Table 13-6 Composite Sample Head Analysis | 107 |
Table 13-7 Composite Sample Mineralogy | 108 |
Table 13-8 Locked Cycle Test Conditions | 111 |
Table 13-9 Locked Cycle Test Results Summary | 112 |
Table 13-10 Pyrite Concentrate Analysis | 113 |
Table 13-11 Direct CIL Extraction Results | 113 |
Table 13-12 Pyrite Concentrate Albion Testing Results | 113 |
Table 13-13 CIL Leaching Results for Albion Residues | 114 |
Table 13-14 Bio-Oxidation Testing Results | 114 |
Table 13-15 Bio-Oxidation Residue CIL Results | 114 |
Table 13-16 Roast Testing Results | 115 |
Table 13-17 Roast Residue CIL Results | 115 |
Table 13-18 Locked Cycle Test Results Summary | 119 |
Table 13-19 Roast Residue CIL Results | 120 |
Table 13-20 SGS Bulk Flotation Results | 122 |
AYA GOLD & SILVER INC., BOUMADINE POLYMETALLIC PROJECT v
| | | | | |
Table 13-21 Elemental Analysis Results of Pyrite Concentrate (%) | 122 |
Table 13-22 Cyanidation Pre-Treatment Evaluation | 125 |
Table 13-23 Comparison of Pyrite Treatment Methods | 129 |
Table 14‑1 Summary of the Aya drillhole database within the Boumadine Mining Licence | 136 |
Table 14‑2 Final estimation domains | 148 |
Table 14‑3 Selected top cuts on raw assay data | 150 |
Table 14‑4 Selected top cuts on metal accumulation data (grade x thickness) from SRK’s visual validation | 152 |
Table 14‑5 SRK modelled variogram parameters | 159 |
Table 14‑6 Selected domains with soft boundaries applied | 162 |
Table 14‑7 Boumadine block model framework | 164 |
Table 14‑8 Fixed plunge applied to the estimation group | 166 |
Table 14‑9 Comparison of Mines Production Record and Depleted Block Model | 191 |
Table 14‑10 NSR Zinc Concentrate Calculation | 193 |
Table 14‑11 NSR Lead Concentrate Calculation | 194 |
Table 14‑12 NSR Pyrite Concentrate Calculation | 194 |
Table 14‑13 Total NSR by Element | 194 |
Table 14‑14 Cut-off value calculation | 194 |
Table 14‑15 SRK Mineral Resource Statement for the Boumadine Project, Morrocco, as at an effective date of 28 February 2026 | 196 |
Table 16-1 Summary of OSA recommendations. | 203 |
Table 16-2 Recommended stope sizing constraints by stope face and rock type. | 204 |
Table 16-3 Pillar Dilution Based by Mining Sequence. | 205 |
Table 16‑3 NSR Cut-off Calculations General Assumptions | 207 |
Table 16‑4 Whittle Parameters | 207 |
Table 16-6 Open Pit Design Parameters | 213 |
Table 16-7 Stope Design Parameters | 217 |
Table 16-8 Deswik Stope Optimizer (DSO) Output by Zones D | 217 |
Table 16-9 Development Headings Profiles | 218 |
Table 16‑10 Mine Dewatering | 220 |
Table 16‑11 Operating mobile equipment units – Annual requirements | 224 |
Table 16‑12 Maximum Labour Requirements | 226 |
Table 16-13 Metal Prices and Smelter Terms by Concentrate | 227 |
Table 16-14 NSR-Mine Factor Derivation | 228 |
Table 16-15 NSR-Pyrite Calculation Parameters | 228 |
Table 16-16 Stockpile Classification Criteria | 229 |
Table 16‑17 Open Pit Life-Of-Mine Production by Stockpile | 232 |
Table 16‑18 Open Pit Life-Of-Mine Production by Zone | 232 |
Table 16-19 Development Performance Rate | 236 |
Table 16‑20 Life-of-Mine Underground Development Plan | 237 |
Table 16‑21 Stope Production Cycle Parameters | 240 |
Table 16‑22 Underground Production Plan Sorted by Stockpile Category | 241 |
Table 16‑23 Underground Production Plan Sorted by Mining Zone | 241 |
AYA GOLD & SILVER INC., BOUMADINE POLYMETALLIC PROJECT vi
| | | | | |
Table 16‑24 Boumadine Life-of-Mine Production Plan | 243 |
Table 16-25 Surface Substations by Portal | 245 |
Table 16-26 Electrical and Communication Infrastructure Unit Costs | 246 |
Table 16-27 Diesel equipment air demand | 248 |
Table 16-28 Task resource definitions | 248 |
Table 16-29 Peak airflow by zone, including 15% leakage | 249 |
Table 16-30 Main fan operating points and installation configuration | 253 |
Table 16-31 Summary of raises by dimensions and length | 253 |
Table 16-32 Energy Consumption of Main Fans | 254 |
Table 16-33 Energy Consumption of Auxiliary and Ramp Development Fans | 256 |
Table 17-1 Key Process Design Criteria | 260 |
Table 17-2 Daily Water Consumption (Nominal) | 267 |
Table 17-3 Annual Energy Consumption | 267 |
Table 17-4 Annual Consumption of Reagents and Consumables | 268 |
Table 18-1 Design Criteria | 274 |
Table 21-1 Capital Estimate Summary | 284 |
Table 21-2 Currency Exchange Rate | 284 |
Table 21-3 Capital Cost Estimate - Mining | 285 |
Table 21-4 General Facilities Cost | 286 |
Table 21-5 Open Pit Facilities Cost | 286 |
Table 21-6 Underground Development Cost | 287 |
Table 21-7 Mobile Equipment | 287 |
Table 21-8 Underground Facilities Cost | 287 |
Table 21-9 Main fans cost | 288 |
Table 21-10 Process Plant and Infrastructure Capital Cost Breakdown | 288 |
Table 21-11 Derivation of Quantities | 290 |
Table 21-12 Supply Cost Source | 290 |
Table 21-13 Owners Project Cost Total | 291 |
Table 21-14 LoM Capital Costs (Million MAD) | 292 |
Table 21-15 Capital Expenditures including Sustaining and Closing Costs | 292 |
Table 21-15 Operating Cost Estimate - Mining | 295 |
Table 21-16 Open-Pit Unit Costs | 295 |
Table 21-17 Open-Pit Owner’s Team | 296 |
Table 21-18 Underground Variable Costs | 296 |
Table 21-19 Underground Fixed Costs | 296 |
Table 21-20 Mobile Maintenance Costs | 297 |
Table 21-21 Process Plant Operating Cost Summary (US$, Q3 2025, +50 / -30%) | 301 |
Table 21-22 LOM Blend - Power Cost Summary (US$, Q3 2025, +50 / -30%) | 301 |
Table 21-23 Consumables Cost Summary (US$, Q3 2025, +50 / -30%) | 302 |
Table 22-1 Base Case Prices and Sensitivity Ranges | 306 |
Table 22-2 Key PEA Assumptions and Economic Parameters | 307 |
Table 22-3 Cash Flow Model | 309 |
AYA GOLD & SILVER INC., BOUMADINE POLYMETALLIC PROJECT vii
| | | | | |
Table 22-4 Key Economic Results | 312 |
Table 22-5 Additional Economic Model Outputs | 313 |
Table 22-6 Project Economics Sensitivity - Gold and Silver Price | 315 |
Table 22-7 Base Case Prices and Sensitivity Ranges | 316 |
Table 22-8 Gold and Silver Price Based IRR - Pre-Tax | 316 |
Table 22-9 Gold and Silver Price Based IRR - Post-Tax | 316 |
Table 22-10 Gold and Silver Price Based NPV5% Pre-Tax in $M | 316 |
Table 22-11 Gold and Silver Price Based NPV5% Post-Tax in $M | 317 |
Table 22-12 CAPEX and OPEX Based IRR - Pre-Tax | 317 |
Table 22-13 CAPEX and OPEX Based IRR - Post-Tax | 317 |
Table 22-14 CAPEX and OPEX Based NPV5% Pre-Tax in $M | 318 |
Table 22-15 CAPEX and OPEX Based NPV5% Post-Tax in $M | 318 |
Table 25-1 Key Economic Results | 328 |
Table 26-1 Budget for Advancing Project to Next Stages | 330 |
AYA GOLD & SILVER INC., BOUMADINE POLYMETALLIC PROJECT viii
List of Figures
| | | | | |
Figure 1-1 Boumadine Project - Annual Free Cash Flow Profile | 6 |
Figure 4-1 Location of Boumadine (WGS84 UTM Zone 30N) | 19 |
Figure 4‑2 Boumadine Mining Licence in relation to Aya surrounding Licences | 22 |
Figure 5‑1 View looking across the Boumadine project area | 25 |
Figure 5‑2 View looking over historical Boumadine mine | 26 |
Figure 7‑1 Regional geology of the Anti-Atlas and the Ougnat Massif. | 34 |
Figure 7‑2 Simplified geological map of the Boumadine Project | 37 |
Figure 7‑3 Conceptual structural model proposed by Gaboury (2022) | 39 |
Figure 7‑4 WorldView-3 alteration map and structural interpretation presented by Gaboury, 2022. | 40 |
Figure 7‑5 Examples of sulphide mineralization textures from the Boumadine Project. | 42 |
Figure 7‑6 Conceptual model illustrating five configurations of sulphide mineralization at Boumadine | 43 |
Figure 9‑1 Inclined image showing the exploration database provided by Aya plotted in relation to the Boumadine Mining Licence (black), collars coloured by Year with traces coloured grey | 46 |
Figure 9‑2 Map of the 2022 Hyperspectral Survey Completed on Boumadine, (source Aya 2025) | 48 |
Figure 9‑3 2022 VTEM Magnetic Survey Completed at Boumadine (source Aya 2025) | 50 |
Figure 10‑1 DD drill rig set up at the Project during the SRK QP site visit | 53 |
Figure 10‑2 Plan view showing the modelled wireframes (green) vs the drillhole traces at Boumadine | 56 |
Figure 10‑3 Cross-sections A and B showing interpreted mineralized zones and drillhole traces. | 57 |
Figure 10‑4 Core orientation procedure using the ACTx tool. | 58 |
Figure 11‑1 Histogram showing the core recovery data provided to SRK for review | 61 |
Figure 11‑2 Image of BOU-DD26-817, taken during the SRK site visit | 61 |
Figure 11‑3 Aya core logging facility | 63 |
Figure 11‑4 Aya core photography stand, with inlay image of drillcore image in Imago Capture software | 65 |
Figure 11‑5 Aya density measurement station | 66 |
Figure 11‑6 Active sampling of drillcore at Aya core processing facility | 67 |
Figure 11‑7 Sampled drillcore with the sample identification and individual QR code denoted on the bag | 68 |
Figure 11‑8 Aya core saw facility | 69 |
Figure 11‑9 Rocklabs sample crusher | 70 |
Figure 11‑10 Pulverized samples being prepared for shipment to Afrilab analytical laboratory in Marrakech | 71 |
Figure 12‑1 Drillhole BOU-DD95-404 verified by SRK in the field | 75 |
Figure 12‑2 Gossanous outcrop observed at surface during the high level geological mapping undertaken by SRK | 76 |
AYA GOLD & SILVER INC., BOUMADINE POLYMETALLIC PROJECT ix
| | | | | |
Figure 12‑3 Fire assay furnaces (A) and the inductively coupled plasma (ICP) analytical instrument (B) at the Afrilab laboratory, Marrakech, Morocco. | 77 |
Figure 12‑4 Scatter plot showing Aya resampled drillcore (Au g/t) | 80 |
Figure 12‑5 Scatter plot showing Aya resampled drillcore (Ag g/t) | 80 |
Figure 12‑6 Scatter plot showing Aya resampled drillcore (Fe %) | 81 |
Figure 12‑7 Scatter plot showing Aya resampled drillcore (Pb%) | 81 |
Figure 12‑8 Blank performance between 2018 and 2026 (A= Au, B = Ag, C= Cu, D= Pb and E = Zn) | 85 |
Figure 12‑9 Ag multi CRM plots (A = full range, B = rescaled Y axis) | 88 |
Figure 12‑10 Au multi CRM plots (A = full range, B = rescaled Y axis) | 89 |
Figure 12‑11 Cu multi CRM plots (A = full range, B = rescaled Y axis) | 90 |
Figure 12‑12 Pb multi CRM plots (A = full range, B = rescaled Y axis) | 91 |
Figure 12‑13 Zn multi CRM plots (A = full range with sample reporting 1299% Zn omitted, B = rescaled Y axis) | 92 |
Figure 12‑14 Field duplicate performance between 2018 and 2026 (A = Au and B = Ag) | 94 |
Figure 12‑15 Coarse rejects (DUP and DUP_REJECT) inserted by Aya into the sample stream for Au and Ag. | 96 |
Figure 12‑16 Umpire duplicate samples sent to ALS by Aya for Au and Ag | 98 |
Figure 13-1 Metallurgical Sampling Locations | 101 |
Figure 13-2 Locked Cycle Test Flowsheet | 110 |
Figure 13-3 Cleaner Flotation Flowsheet for Separating Arsenopyrite / Pyrite | 117 |
Figure 13-4 Correlation Between Analyzed and Calculated Sulphur Content | 121 |
Figure 13-5 Au and Ag Leach Rates at Different Roasting Temperatures | 123 |
Figure 14‑1 Plan view of drillhole traces (coloured grey) and collars used in the 2026 MRE( | 137 |
Figure 14‑2 Box plot showing raw Ag, Au and Zn grades with Aya lithological logging codes | 139 |
Figure 14‑3 Boumadine topographic wireframe in plan view coloured by elevation and drillhole collars | 141 |
Figure 14‑4 Cross section (30m slice) through weathering model, | 143 |
Figure 14‑5 Plan view showing location of the North, Central and Suther Wireframes | 145 |
Figure 14‑6 Boumadine modelled wireframes in (light brown) in relation to the drillhole traces (grey) | 146 |
Figure 14‑7 Comparison of MS and SMS structural measurements | 147 |
Figure 14‑8 Histogram of raw Ag g.t sample data for group XX in south | 151 |
Figure 14‑9 Histogram of raw Zn % sample data for group XX in central area | 152 |
Figure 14‑10 Histogram of raw Ag metal accumulation data for domain 1091 in South | 153 |
Figure 14‑11 Histogram of raw Au metal accumulation data for domain 2091 in Central | 154 |
Figure 14‑12 Example capped metal accumulation histogram for Au in domain 2091 | 155 |
Figure 14‑13 Example capped metal accumulation histogram for Ag in domain 2091 | 156 |
Figure 14‑14 Directional variograms for Pb (grade x thickness) for group C1 (central) | 157 |
Figure 14‑15 Directional variograms for true thickness (TT) for group N2_Tizzi (north) | 158 |
Figure 14‑16 Directional variograms for Zn (grade x thickness) for group S2 (south) | 159 |
Figure 14‑17 Example of QKNA results for block sizes | 163 |
Figure 14‑18 Vertical section (looking north) of a modelled domains (red and green) with local search ellipses shown (blue) to demonstrate application of LVA | 166 |
AYA GOLD & SILVER INC., BOUMADINE POLYMETALLIC PROJECT x
| | | | | |
Figure 14‑19 Coded density database showing the 13 SGDRY samples excluded from the analysis | 168 |
Figure 14‑20 Plot showing regression applied to density database used to determine density when no SGDRY values have been recorded | 169 |
Figure 14‑21 Long section of domain 1031 | 172 |
Figure 14‑22 Long section of domain 1091 | 173 |
Figure 14‑23 Long section of domain 2091 | 174 |
Figure 14‑24 Long section of domain 3103 | 175 |
Figure 14‑25 Long section of domain 3193 | 176 |
Figure 14‑26 Long section of domain 3193 | 177 |
Figure 14‑27 Long section of domain 2091 | 178 |
Figure 14‑28 Cross section in the Southern area through 317165 X and 3475490 Y (azimuth 340° dip 90°) | 179 |
Figure 14‑29 Cross section in the Central area through 316911 X and 3477037 Y | 180 |
Figure 14‑30 North south cross section in the Northern area through 315420. X and 3478310 Y | 181 |
Figure 14‑31 Mean metal accumulation (Au) composite Grades (blue line) compared to Block Estimate Grades | 183 |
Figure 14‑32 Mean metal accumulation (Au) composite Grades (blue line) compared to Block Estimate Grades | 183 |
Figure 14‑33 Mean metal accumulation (Ag) composite Grades (blue line) compared to Block Estimate Grades | 184 |
Figure 14‑34 Mean metal accumulation (Zn) composite grades (blue line) compared to block estimate grades | 185 |
Figure 14‑35 Density composite grades (blue line) compared to block density values | 186 |
Figure 14‑36 View of the block model coloured by Mineral Resource classification | 188 |
Figure 14‑37 Underground mining as-builts (stopes = blue and development = black) provided by Aya (location central area) | 189 |
Figure 14‑38 Cross-section looking north at mined as-builts provided by Aya (grey) | 190 |
Figure 14‑39 Boumadine Grade Tonnage Curves for Open Pit Indicated and Inferred Material | 198 |
Figure 13‑40 Boumadine Grade Tonnage Curves for Underground Indicated and Inferred Material | 198 |
Figure 16-1 Whittle Re-Blocked Model Parameters | 208 |
Figure 16-2 Whittle Initial Slope Set Settings | 209 |
Figure 16-3 North Pit Whittle Shells Iteration | 210 |
Figure 16-4 North Pit Whittle Shell 14 | 210 |
Figure 16-5 Central Pit Whittle Shells Iteration | 211 |
Figure 16-6 Central Pit Whittle Shell 16 | 211 |
Figure 16-7 South Pit Whittle Shells Iteration | 212 |
Figure 16-8 South Pit Whittle Shell 11 | 212 |
Figure 16-9 Haul Road Schematic (a) and (b) | 213 |
Figure 16-10 Boumadine Pit Locations | 214 |
Figure 16-11 Boumadine Pit Center Phases – Longitudinal Section | 215 |
Figure 16‑12 Boumadine Underground Mine Design – Longitudinal View | 215 |
Figure 16‑13 Modified Avoca Mining Method Illustration – Longitudinal Section | 216 |
Figure 16‑14 Modified Avoca Mining Method – Stope Cycle | 216 |
Figure 16‑15 Typical Level Layout | 219 |
AYA GOLD & SILVER INC., BOUMADINE POLYMETALLIC PROJECT xi
| | | | | |
Figure 16‑16 Dewatering Network Schematic Central Zone | 220 |
Figure 16‑17 Cement Slurry Process and Transportation Underground | 221 |
Figure 16‑18 Mixing Sump Schematic | 222 |
Figure 16‑19 Stope Backfill Placement in Poor Ground Conditions | 223 |
Figure 16‑20 Stockpile Classification Parameters | 229 |
Figure 16‑21 Open Pit Sequence: Surface view every 2 year: (a) 2030 (b) 2032 (c) 2034 (d) 2036 (e) 2038 (f) 2039 | 231 |
Figure 16-22 Mineralized Material Mined per Year and per Pits | 233 |
Figure 16-23 Waste Mined per Year per Pits | 233 |
Figure 16-24 Open Pit Life-of-Mine Production Plan and NSR | 234 |
Figure 16-25 Development Heading (South Zone Portal 1) | 236 |
Figure 16‑26 Primary UG Mining Area in the South Zone | 238 |
Figure 16‑27 Secondary UG Mining Area in the Center Zone | 239 |
Figure 16‑28 Remaining UG Mining Area in the North Zone | 239 |
Figure 16-29 Underground Mineralized Material Mined by Zones | 242 |
Figure 16-30 Underground Mineralized Material Mined and NSR | 242 |
Figure 16‑31 Boumadine Life-Of-Mine Production Plan Breakdown by Mining Methods | 244 |
Figure 16‑32 Boumadine LOM Production Plan Tonnes and NSR | 244 |
Figure 16-33 Life of mine airflow by zone Portal 1 to Portal 5 | 249 |
Figure 16-34 Zones and locations of exhaust fans | 250 |
Figure 16-35 Longitudinal view of South 1 zone showing three exhaust raises and three intakes | 250 |
Figure 16-36 Longitudinal view of South 2 zone showing exhaust raise and intake portal | 251 |
Figure 16-37 Longitudinal view of South 3 zone showing three exhaust raises and three intakes | 251 |
Figure 16-38 Longitudinal view of Center (Portal 4) zone showing two exhaust raises and two intakes | 252 |
Figure 16-39 Longitudinal view of North (Portal 5) zone showing four exhaust raises and four intakes | 252 |
Figure 16-40 Auxiliary Ventilation on Ramp Development Zone Centre | 256 |
Figure 16-41 Auxiliary Ventilation on Production Levels Zone Centre | 256 |
Figure 17-1 Simplified Process Flowsheet | 258 |
Figure 17-2 Simplified Process Flowsheet (Continued) | 259 |
Figure 18-1 Overall Site Plan | 270 |
Figure 18-2 Process Plant Layout | 271 |
Figure 18-3 Raw Water Sourcing | 275 |
Figure 21-1 Capital Cost Summary – Mining | 285 |
Figure 21-2 Operating Cost Summary – Mining | 295 |
Figure 21-3 Underground Labour Profile | 297 |
Figure 21-4 Processing Plant Operating Cost Breakdown | 300 |
Figure 22-1 Boumadine Project - Annual Free Cash Flow Profile | 312 |
Figure 22-2 Annual Free Cash Flow | 314 |
Figure 23-1 Location of the Imiter Mine | 320 |
Figure 24-1 Project Execution Schedule | 321 |
Figure 25-1 Boumadine Project - Annual Free Cash Flow Profile | 329 |
AYA GOLD & SILVER INC., BOUMADINE POLYMETALLIC PROJECT xii
AYA GOLD & SILVER INC., BOUMADINE POLYMETALLIC PROJECT xiii
1.0EXECUTIVE SUMMARY
1.1Introduction
This Technical Report (the “Report”) presents an Updated Preliminary Economic Assessment ("PEA") for the Boumadine Project, Kingdom of Morocco. Boumadine is a polymetallic deposit, the commodities of interest are gold (Au), silver (Ag), Zinc (Zn), Lead (Pb). The Report has an effective date of September 9, 2026.
To support the preparation of the Updated PEA, Aya retained a number of independent engineering and consulting firms to provide specialized technical input. The roles and responsibilities of the consultants contributing to this report are summarized below:
•SRK Consulting (UK) Ltd prepared the updated Mineral Resource Estimate (MRE) for the project.
•CCE Mining developed the mining methods, mining capital cost and operating cost estimates.
•Lycopodium (Americas) Ltd. ("Lycopodium") developed PEA-level designs for the process plant and general on-site infrastructure, developed the consolidated cost estimates and reviewed and signed off on the financial model that was prepared by the Company.
•RockEng Inc. prepared the mining geotechnical evaluations
•The power supply line was estimated by the Office National de l'Électricité et de l'Eau Potable ("ONEE") and reviewed by Lycoodium
•SLR Consulting conducted environmental studies and permitting reviews.
•Epoch Resources (Pty) Ltd prepared and reviewed the Tailings Storage Facility evaluation
The following QP's contributed in the preparation of this report:
•Preetham Nayak, P.Eng., Lycopodium
•Zunedbhai Shaikh, P.Eng., Lycopodium
•Ruan Venter, P.Eng., Lycopodium
•Paul Gauthier, P.Eng., CCE Mining
•Alex Pheiffer, PrSciNat, SLR Consulting France SAS
•George Papageorgiou PrEng, PhD, MSc, BSc, Eng (Civil), Wits, Epoch Resources (Pty) Ltd
•Guy Dishaw, P.Geo., SRK Consulting (UK) Ltd
SRK has been requested by Aya Gold and Silver Inc. (Aya, hereinafter also referred to as the Company or the Client) to prepare an update to the Mineral Resource Estimate (MRE) for the Boumadine polymetallic deposit (Boumadine or the Project). This MRE represents the first Mineral Resource Estimate that SRK has been commissioned to undertake for the Boumadine Project. The MRE presented in this report has been prepared using the terminology, guidelines and definitions provided in the Canadian Institute of Mining, Metallurgy and Petroleum (CIM) Definition Standards for Mineral Resources and Mineral Reserves (May 2014). This technical report is prepared in accordance with National Instrument 43-101 – Standards of Disclosure for Mineral Projects (NI-43-101). The Mineral Resource Statement presented in this report has been prepared and approved by Mr Guy Dishaw, P.Geo., a Qualified Person (QP) in accordance with the CIM Definition Standards. Mr Dishaw is a member of the Association of Professional Engineers and Geoscientists of Saskatchewan. Guy Dishaw (QP) completed a site visit to the Project between 23 and 28 April 2026 to review the local geology, mineralization, drilling, sampling practices, core handling, core orientation procedures, the Company's data
AYA GOLD & SILVER INC., BOUMADINE POLYMETALLIC PROJECT 1
management systems and visited the African Laboratory for Mining and Environment (Afrilab) sample preparation onsite and the assay laboratory located in Marrakech. The MRE presented in this report incorporates the latest phase of exploration and infill drilling. The drilling database was provided to SRK on the 16 April 2026 and was last updated with assays issued from the laboratory on the 28 February 2026. Accordingly, the Mineral Resource Statement (MRS) has an effective date of 28 February 2026 (hereinafter referred to as the “2026 MRE”) which in turn reflect various technical and economic conditions at the time of writing.
Aya engaged Lycopodium to prepare an updated PEA for the Boumadine Project. The PEA has been completed in accordance with the Canadian disclosure requirements of National Instrument 43-101 (NI 43-101) and the associated requirements of Form 43-101F1.
1.2Property Description and Location
Boumadine is located within the Drâa-Tafilalet Region of southeastern Morocco within the Central Anti-Atlas Mountain Belt. It is located approximately 340 km southeast of Rabat, 220 km east northeast of Ouarzazate, 290 km east of Marrakech and approximately 80 km southwest of Errachidia.
The Project is located within the Boumadine Mining Licence (LE-383661), which is held by Boumadine Global Mining SA (BGM). BGM is owned 85% by Aya Gold & Silver Inc. (Aya) and 15% by the Office National des Hydrocarbures et des Mines (ONHYM). The Boumadine Mining Licence covers an area of approximately 31.7 km², which expired in May 2026. Aya have informed SRK that they are currently in the processes of renewing the Licence (no change to the extent or conditions) for an additional 10 years. SRK understand that there is no reason why the renewal will not be successful. The Company also holds an additional 13 Mining Licences and 19 Exploration Permits within the surrounding region.
1.3Project geology
The Boumadine Project is hosted within Neoproterozoic volcanic and volcano-sedimentary rocks of the Tiddiline Formation (TTF) and comprises a structurally controlled polymetallic hydrothermal system developed within a shallow volcanic environment. Mineralization is principally controlled by steeply dipping northwest- to north-northwest-trending fault corridors that are spatially associated with felsic subvolcanic intrusions and hydrothermal breccias. Hydrothermal alteration is extensive and comprises quartz-sericite-pyrite (phyllic) alteration within the felsic volcanic sequence and propylitic alteration within the underlying mafic volcanic rocks, characteristic of a long-lived hydrothermal system that evolved during repeated episodes of fault movement and magmatism.
Mineralization comprises steeply dipping massive to semi-massive sulphide veins, hydrothermal breccias, replacement sulphides and pyrite stockwork developed within broad alteration halos. The highest-grade mineralization is typically associated with massive sulphide veins dominated by pyrite, sphalerite, galena, arsenopyrite and chalcopyrite, with surrounding zones of disseminated sulphides and quartz-carbonate veining. Recent drilling and geological studies have demonstrated that mineralization extends into both the felsic and mafic volcanic successions and has led to the refinement of the structural interpretation of the deposit, providing increased confidence in the geological model and continuity of the principal mineralized corridors. Although the precise genetic classification of the deposit remains under investigation, the MRE is based on the observed geological, structural and mineralization characteristics and does not depend on any specific genetic model.
AYA GOLD & SILVER INC., BOUMADINE POLYMETALLIC PROJECT 1
1.4Exploration Drilling and Sampling
A total of 940 drillholes, comprising 356,323.1 m of drilling, are located within the Boumadine Mining Licence. Of these, 855 drillholes, totalling 319,464.8 m, were completed to support infill of key mineralized areas and extensions to the known mineralization, while the remaining 85 drillholes relate to prospecting within the Mining Licence and did not specifically target the known Boumadine mineralization.
Drillhole spacing is variable across the Project. However, the majority of the modern drilling used in the 2026 MRE was initially completed on nominal 100-200 m-spaced inclined drill fences, with subsequent infill drilling undertaken on approximately 50 m spacing. The infill drilling program is ongoing at the time of writing. In certain locations, drillhole spacing is closer owing to variations in drillhole inclination or where additional drilling was planned to provide increased drill coverage.
In the opinion of SRK, the sampling procedures used by the Company generally conform to industry best practices and the resulting drilling pattern is sufficiently dense to interpret the geometry, geological boundaries and sulphide mineralization with an appropriate level of confidence.
1.5Mineral Resource Estimate
In summary, for the 2026 Mineral Resource update, SRK has completed the following:
•compilation, review and validation of the geological, drilling, sampling and analytical databases;
•review of geological mapping, satellite/hyperspectral imagery, geophysical dataset, structural mapping and oriented core data to characterise the geological controls on the orientation, continuity and geometry of the mineralization;
•construction of weathering and oxidation (redox) model;
•construction of geological and estimation domain wireframes (mineralization wireframes), guided by geological mapping, structural measurements from oriented drill core, historical mine plans and as-built depletion surveys, together with Aya’s previous geological interpretations;
•conditioning of the assay database, compositing, metal accumulation (grade × thickness) calculations and assessment of high-grade outliers;
•geostatistical analysis and variogram modelling using the metal accumulation data;
•construction of a three-dimensional block model using parent block dimensions of 5 m × 15 m × 15 m within the mineralized zones and 90 m × 90 m × 90 m for the surrounding waste;
•interpolation of Ag, Au, Cu, Pb, Zn and true thickness (TT) using Ordinary Kriging (OK), whilst Fe and As were estimated using Inverse Distance Weighting (IDW2). All metals were estimated using the metal accumulation method;
•estimation of density using single drillhole composites representing the across-strike mineralized intersections, with factoring applied within the transitional weathering domain. Density values were based on measured density data supplemented by density values derived from regression analysis undertaken by SRK;
•visual and statistical validation of the block model against the input composite data, including comparison of estimated metal accumulation values, density composites and back-calculated grades against the corresponding input data
•classification of the block model into the Indicated and Inferred Mineral Resource categories based on data quality, geological continuity and drillhole spacing;
AYA GOLD & SILVER INC., BOUMADINE POLYMETALLIC PROJECT 1
•assessment of the reasonable prospects for eventual economic extraction (RPEEE) through the determination of appropriate reporting cut-off values and the generation of conceptualised open pit shells and underground reporting shapes;
•reporting of the Mineral Resources in accordance with the definitions, terminology and guidelines of the CIM Definition Standards for Mineral Resources and Mineral Reserves (May 2014);
•comparison of the current Mineral Resource Statement (MRS) with the previous MRS prepared by Aya.
SRK considers that the Boumadine mineralization has reasonable prospects for economic extraction with respect to both open-pit and underground mining methods.
The Boumadine MRS has an effective date of 28 February 2026, and has been depleted to reflect the current understanding of the historical mining. The Mineral Resources are limited to classified material contained within conceptual open pit shell reported above the NSR reporting cut-off of 60 USD/t and, below the pit shell, to classified material contained within grade shells (following the removal of isolated shapes) based on a 110 USD/t NSR cut-off, that satisfy a 1.5 m minimum mineable thickness. The Mineral Resources are reported within the Boumadine Mining Licence on an in-situ, undiluted basis are shown in Table ES 1 below.
The Company’s Boumadine Mining Licence permit expired in May 2026. Aya have informed SRK that they are currently in the processes of renewing the Licence (no change to the extent or conditions) for an additional 10 years. Whilst the licence renewal approval is currently pending, the Company has informed SRK that they see no reason why this will not be successful.
AYA GOLD & SILVER INC., BOUMADINE POLYMETALLIC PROJECT 1
Table 1-1 SRK Mineral Resource Statement for the Boumadine Project, Morocco, as at an effective date of 28 February 2026
| | | | | | | | | | | | | | | | | | | | | | | | | | | | | | | | | | | | | | | | | | | | | | | | | | |
| Cut-off (NSR USD/t) | Tonnes (Kt) | Average Grade | Contained Metal |
| Ag (g/t) | Au (g/t) | Cu (%) | Pb (%) | Zn (%) | AgEq (g/t) | AuEq (g/t) | Ag (koz) | Au (koz) | Cu (kt) | Pb (kt) | Zn (kt) | AgEq (koz) | AuEq (koz) |
| Pit-Constrained |
| Indicated | 60 | 6,639 | 115.5 | 2.2 | 0.10 | 0.96 | 2.21 | 390.8 | 4.2 | 24,653 | 463 | 6 | 64 | 147 | 83,423 | 896 |
| Inferred | 60 | 19,497 | 57.8 | 2.0 | 0.07 | 0.62 | 1.54 | 298.7 | 3.2 | 36,218 | 1,280 | 14 | 120 | 301 | 187,258 | 2,011 |
| Underground |
| Indicated | 110 | 1,943 | 143.0 | 1.1 | 0.06 | 1.19 | 2.11 | 319.6 | 3.4 | 8,931 | 69 | 1 | 23 | 41 | 19,963 | 214 |
| Inferred | 110 | 25,868 | 56.0 | 1.6 | 0.08 | 0.56 | 1.17 | 251.9 | 2.7 | 46,605 | 1,372 | 21 | 145 | 303 | 209,475 | 2,249 |
| Total |
| Indicated | 60/110 | 8,582 | 121.7 | 1.9 | 0.09 | 1.01 | 2.19 | 374.7 | 4.0 | 33,585 | 532 | 8 | 87 | 188 | 103,386 | 1,110 |
| Inferred | 60/110 | 45,365 | 56.8 | 1.8 | 0.08 | 0.58 | 1.33 | 272.0 | 2.9 | 82,823 | 2,653 | 35 | 265 | 604 | 396,733 | 4,260 |
In reporting the Mineral Resource Statements, SRK notes the following:
•The Mineral Resources have an effective date of 28 February 2026. Mr Guy Dishaw, P.Geo., is the Qualified Person (QP) responsible for the Mineral Resource Estimate in accordance with the Canadian Institute of Mining, Metallurgy and Petroleum (CIM) Definition Standards for Mineral Resources and Mineral Reserves (2014) and CIM Estimation of Mineral Resources and Mineral Reserves Best Practice Guidelines (2019). Mr Dishaw is a member of the Association of Professional Engineers and Geoscientists of Saskatchewan.
•The Mineral Resource Estimate was prepared by a team of consultants from SRK under the supervision of the QP.
•Mineral Resources are reported in situ and undiluted and are constrained within the Boumadine Mining Licence.
•Mineral Resources have been depleted to reflect SRK's current understanding of historical underground mining completed up to mine closure in 1992 as well as surficial artisanal workings.
•Commodity prices of US$2,800/oz Au, US$30/oz Ag, US$4.60/lb Cu, US$1.00/lb Pb and US$1.20/lb Zn were used to establish reasonable prospects for eventual economic extraction.
•The NSR was calculated as: NSR (US$/t) = (Pb (%) × 12.87) + (Zn (%) × 14.12) + (Au (g/t) × 70.27) + (Ag (g/t) × 0.75) + (Cu (%) × 66.95) − 6.75.
AYA GOLD & SILVER INC., BOUMADINE POLYMETALLIC PROJECT 1
•Silver equivalent (AgEq) and gold equivalent (AuEq) grades are based solely on metal prices and metallurgical recoveries and do not incorporate the full range of factors included in the NSR calculation, including treatment charges, payabilities, penalties, royalties and other smelter charges. Consequently, equivalent grades were not used for optimization or application of reporting cut-offs and are provided for reference only.
•AgEq = Ag (g/t) + (Au (g/t) × Au price/gram × Au recovery) / (Ag price/gram × Ag recovery) + Zn (%) × Zn price/lb × Zn recovery / (Ag price/gram × Ag recovery) × 685.7147973 + Pb (%) × Pb price/lb × Pb recovery / (Ag price/gram × Ag recovery) × 685.7147973 + Cu (%) × Cu price/lb × Cu recovery / (Ag price/gram × Ag recovery) × 685.7147973.
•AuEq = Au (g/t) + (Ag (g/t) × Ag price/gram × Ag recovery) / (Au price/gram × Au recovery) + Zn (%) × Zn price/lb × Zn recovery / (Au price/gram × Au recovery) × 685.7147973 + Pb (%) × Pb price/lb × Pb recovery / (Au price/gram × Au recovery) × 685.7147973 + Cu (%) × Cu price/lb × Cu recovery / (Au price/gram × Au recovery) × 685.7147973.
•Open-pit Mineral Resources are reported within an optimized pit shell using an NSR cut-off value of US$60/t. The optimization and reporting assumptions include ore mining costs of US$2.0/t, waste mining costs of US$1.5/t Drilling and blasting costs (grade control) US$1.1/t, US$2.0/t surface haulage and rehandling costs, processing and shipping costs of US$49/t, G&A costs of US$6/t and an overall pit slope angle of 47°.
•Underground Mineral Resources are reported using a rounded NSR cut-off value of US$110/t, based on total underground mining costs of US$55.6/t, processing and shipping costs of US$48.9/t and G&A costs of US$6.7/t. The underground Mineral Resources demonstrate sufficient continuity suitable for long-hole underground mining methods. Reporting shapes apply a minimum true mining width of 1.5 m, with isolated or discontinuous volumes considered unlikely to support potential underground extraction excluded from the reported Mineral Resource.
•Mineral Resources are not Mineral Reserves and do not have demonstrated economic viability.
•The QP is unaware of any known environmental, permitting, legal, title, taxation, socio-economic, marketing, political or other relevant factors that could materially affect the Mineral Resource Estimate.
•Tonnages are reported in metric units and grades are reported in grams per tonne (g/t) for Au and Ag and percent (%) for Cu, Pb and Zn. Tonnages, grades and contained metal quantities have been rounded appropriately. Rounding may result in apparent differences between totals and the sums of individual values; such differences are not considered material.
AYA GOLD & SILVER INC., BOUMADINE POLYMETALLIC PROJECT 2
1.6Mineral Processing and Metallurgical Testing
Based on the 2022 and 2024 metallurgical testwork completed by SGS Canada Inc., the process plant design for the Project considers a conventional flotation flowsheet. Lead, zinc and pyrite concentrates will be recovered and sold to market.
OMC used its testwork database to infer missing data and to recommend further testwork for subsequent studies. While both BWi values from testwork fell outside the database range for other similar resources in the area, the average BWi fell at the 81st percentile of the range, aligning well with OMC’s typical strategy of designing to the 85th percentile hardness. As such, the average of both test results was used in the comminution circuit design (13.1 kWh/t). The remainder of the comminution circuit design criteria were estimated from OMC’s database.
The conditions tested during the 2022 and 2024 SGS locked cycle testing campaigns were used as the basis for the concentrate recovery circuit design, since the testing incorporated recycles at steady state and produced concentrates of acceptable grade and recovery. Using locked cycle data provides a higher design certainty since it more closely represents plant operation by the incorporation of recycles and since it validates the process conditions at steady state.
The design criteria derived from the 2022 and 2024 locked cycle testing includes:
•General circuit design (i.e. orientation, number of stages, implementation of regrinding).
•Reagent addition.
•Concentrate mass pulls, grades and recoveries.
•Residence times.
Next steps include continued refinement of the metallurgical testwork, particularly comminution, variability and dewatering.
1.7Mining Operations
The Boumadine deposit is divided into three main zones: North, Central and South. The mine plan combines open pit (OP) and underground (UG) mining. OP mining starts in 2029, and UG development starts two years later, in 2031, with first UG mineralized material in 2032. This phased approach generates early cash flow from the OP mine while deferring the capital-intensive UG development.
Over the life of mine (LOM), 41.2 Mt of mineralized material will be mined at an average NSR value of US$193/t, of which OP mining contributes 22.4 Mt (54.2%) and UG mining 18.9 Mt (45.8%). The LOM production plan extends over fifteen years, including pre-production, with OP mining from 2029 to 2039 and UG mining through 2043. Production during the final four years comes exclusively from the UG mine. Mineralized material is classified into three stockpiles (Low Grade, LG Pyrite and HG Pyrite) based on NSR values, and the stockpiles are used to regulate the tonnage and grade of plant feed at the nominal throughput of 8,000 t/d.
1.7.1OP Mining
Pre-production activities, including pre-stripping and the construction of roads, pads and waste rock storage areas, will start in 2029 during the project construction phase. Three pits are planned. The Central Pit, which contains the highest-grade OP mineralized material, is the main pit and will be mined in four phases over approximately eleven years. The South Pit will be mined in two phases to supplement Central Pit production, and the North Pit, made up of three sub-pits, will be mined from 2034 to 2036. Total material movement peaks at 55 Mt/y, and the LOM stripping ratio is approximately 23:1.
AYA GOLD & SILVER INC., BOUMADINE POLYMETALLIC PROJECT 1
Pit shells were optimized in GEOVIA Whittle and designed in Deswik using the geotechnical recommendations of RockEng. The first two benches are 10 m high to account for near-surface weathering, followed by 20 m (double 10 m) benches in rock, with geotechnical slope breaks every 100 vertical metres. OP mining will be carried out by a contractor using a conventional truck and shovel fleet, based on 200 t class hydraulic shovels (CAT 6020 or similar) paired with 90 t haul trucks (CAT 777 or similar). Haul ramps are designed at a maximum grade of 10%.
1.7.2UG Mining
The UG mine extends to approximately 640 m below surface over approximately 5.6 km of strike. The mineralized zones are steeply dipping and average 1 to 4 m in width. The UG mine will be accessed by ramps from five surface portals: Portals 1 to 3 in the South Zone, Portal 4 in the Central Zone and Portal 5 in the North Zone. Development starts at Portal 1 in 2031, followed by Portal 4 in 2034, Portals 3 and 2 in 2036 and Portal 5 in 2038. Initial UG production focuses on the higher-grade South Zone, and UG production reaches approximately 2.0 Mt/y from 2038.
Based on the geometry of the deposit and the geotechnical assessment, the selected mining method is modified Avoca, a longitudinal longhole retreat method mined bottom-up within each panel and backfilled with rock fill (RF) and cemented rock fill (CRF). Stopes are designed with a 20 m level spacing, a 20 m strike length and a minimum mining width of 2.0 m, with 0.5 m of hanging wall dilution and 95% mining recovery. Mineralized material and waste will be hauled to surface by 33 t trucks (Epiroc MT436B or similar) via the ramps. Ventilation raises to surface will be excavated by raise boring, and internal raises by drop raising or raise boring.
Capital lateral and vertical development will be performed by a contractor. Sill development and all stoping activities will be performed by owner crews.
1.8Processing and Recovery Options
The process plant design for the Project is based on a conventional flotation flowsheet. Lead, zinc and pyrite concentrates will be recovered and sold to market.
The plant design criteria were selected to minimize operating costs and maximize the use of proven technology. The key criteria for equipment selection are suitability for duty, safety, reliability, and ease of maintenance.
The process plant design comprises the following unit operations:
•Single stage primary crushing with a jaw crusher to produce an 80% Passing (P80) crushed product size of 136 mm.
•Crushed rock stockpile with a live capacity of approximately 8,115 tonnes to provide 24 hours of live storage. During extended periods of primary crusher equipment maintenance, additional crushed material inventory can be generated in the weeks leading up to the planned shutdown by dozing crushed material from this stockpile to the area adjacent to the stockpile. This material can then be reclaimed during the shutdown by front-end loader to feed the grinding circuit.
•SAB type grinding circuit consisting of a SAG mill and a ball mill to produce a ground product with a P80 of 58 microns (µm), with hydrocyclones for particle size classification.
•Lead rougher flotation, classification, regrinding and cleaner flotation to produce a lead concentrate of 29.6% grade. The lead concentrate will be thickened, filtered, and bagged prior to shipment.
AYA GOLD & SILVER INC., BOUMADINE POLYMETALLIC PROJECT 2
•Zinc rougher flotation, classification, regrinding and cleaner flotation to produce a zinc concentrate of 57.4% grade. The zinc concentrate will be thickened and filtered for stockpiling prior to shipment.
•Pyrite rougher flotation to produce a pyrite concentrate with 4.2 Au g/t and 81.0 Ag g/t. The pyrite concentrate will be thickened and filtered for stockpiling prior to shipment.
•Tailings thickening and storage in a tailings management facility.
Run-of-mine (ROM) material will be delivered to a feed bin by mine truck to supply the crushing plant. The crushed product will be stockpiled before entering the grinding circuit, which will include a SAG mill, ball mill, and hydrocyclones for particle size classification. The ground product will feed the lead rougher flotation circuit. The lead rougher concentrate will proceed to a classification and regrind circuit, followed by three cleaner flotation stages and a cleaner-scavenger stage. The final lead concentrate will be thickened, filtered and bagged for shipment.
The lead rougher tails and cleaner-scavenger tails will feed the zinc rougher flotation circuit. The zinc rougher concentrate will follow a similar regrind and cleaning process, including three cleaning stages and a cleaner-scavenger stage. The final zinc concentrate will be thickened, filtered, and stockpiled for shipment.
The zinc rougher tails and cleaner-scavenger tails will feed the pyrite rougher flotation circuit. The pyrite rougher tails will be thickened and pumped to the flotation tailings management facility. The pyrite concentrate will be thickened, filtered and stockpiled for shipment. Filtrate and thickener overflows from all circuits will return to the process water pond.
1.9Infrastructure
Infrastructure on the Project includes an integrated mining and processing operation including open pits, an underground mine, and a central processing plant supported by crushing, flotation, stockpiling, and concentrate handling facilities. Site access is via the National 10 highway with upgraded roads connecting all major areas.
Key infrastructure includes the ROM pad, workshops, laboratories, security and administration buildings, and extensive haul and service roads. Waste rock storage, a lined TSF with staged raises, and on-site water harvesting and treatment support operational needs. Power is provided through a new 225 kV ONEE supply to a 40 MVA substation. Additional services include fuel storage, sewage treatment, waste management, security, limited accommodation, and concentrate transport to Nador-West Port.
1.10Capital and Operating Costs
1.10.1Capital Costs
The capital cost estimates for the Boumadine Project PEA was compiled by Lycopodium. All costs are expressed in United States Dollars (US$) unless otherwise stated. The capital cost estimate was developed in Q3 2025 and escalated to Q3 2026 pricing and deemed to have an overall accuracy of +50%/-30%. The capital cost estimate conforms to AACE International (Association for the Advancement of Cost Engineering) Class 5 estimate standards as prescribed in recommended practice 47R11.
The total initial capital cost for the Boumadine Project is $463 M and the LOM sustaining cost is $507 M. The initial capital and sustaining capital, for the Project is summarized in Table 1-2 by major area.
AYA GOLD & SILVER INC., BOUMADINE POLYMETALLIC PROJECT 3
Table 1-2 Capital Expenditures including Sustaining and Closing Costs
| | | | | | | | | | | |
Capital Expenditures ($M) | Initial | Sustaining | Total |
| Direct Costs | 299 | 507 | 806 |
| Open Pit Mining | 52 | 59 | 112 |
| Underground Mining | 0 | 407 | 407 |
| Processing Plant | 175 | 0 | 175 |
| Shipping Infrastructure | 11 | 0 | 11 |
| Electrical Line | 18 | 0 | 18 |
| Raw Water Supply | 33 | 0 | 33 |
| Tailings Storage Facility | 9 | 30 | 40 |
| TSF Closure Costs | 0 | 11 | 11 |
| Indirects Costs | 65 | 0 | 65 |
| Subtotal | 364 | 507 | 871 |
| Contingency | 99 | 0 | 99 |
| Total | 463 | 507 | 970 |
1.10.2Operating Costs
The operating cost estimate conforms to a preliminary economic assessment level estimate with a +50/-30% accuracy. The operating cost estimate was developed in Q4 2025 using data from projects, studies, and previous operations from Lycopodium, CCE, and Aya.
The LOM average unit operating cost is $67.61/t and the total LOM cost including cash cost and sustaining cost is $122.55/t. Table 1-3 provides a summary of the operating costs for the Project.
Table 1-3 Operating Costs for First 5 Years of Operation and for LOM
| | | | | | | | | | | |
| Item | Units | Year 1-5 | LOM |
| Mining | $/t milled | 51.47 | 43.70 |
| Processing | $/t milled | 18.08 | 17.96 |
| G&A | $/t milled | 5.58 | 5.45 |
| Tailings, Environmental and Water Management | $/t milled | 0.47 | 0.50 |
| Total On-Site Operating Cost | $/t milled | 75.60 | 67.61 |
| Transportation | $/t milled | 38.63 | 34.33 |
| Royalties | $/t milled | 10.65 | 8.00 |
| Mining Tax | $/t milled | 0.34 | 0.32 |
| Total Cash Cost | $/t milled | 125.22 | 110.26 |
| OP Sustaining Capital | $/t milled | 3.08 | 1.44 |
| UG Sustaining Capital | $/t milled | 9.41 | 9.85 |
| TSF Sustaining Capital | $/t milled | 0.95 | 1.00 |
Total Costs Including Sustaining | $/t milled | 138.67 | 122.55 |
1.11Economic Analysis
The economic analysis was performed assuming a 5% discount rate typical for silver-gold projects. Cash flows have been discounted to the start of construction, assuming that the project execution decision will be made, and major project financing will be carried out at this time.
The pre-tax NPV discounted at 5% is $4.1B, with a pre-tax IRR of 97% and payback period of 0.7 years. On an after-tax basis, the NPV discounted at 5% is $3.5B, with an after-tax IRR of 93%, and payback period of 0.7
AYA GOLD & SILVER INC., BOUMADINE POLYMETALLIC PROJECT 4
years. Cumulative after-tax unlevered free cash flow totals $4.7B. Tax calculations are based on Aya’s understanding of current Moroccan tax regulations as of the effective date of this report.
Readers are cautioned that the Updated PEA is preliminary in nature. It includes Inferred Mineral Resources that are considered too speculative geologically to have the economic considerations applied to them that would enable them to be categorized as Mineral Reserves and there is no certainty that the PEA will be realized. Mineral Resources are not Mineral Reserves and do not have demonstrated economic viability.
A summary of the project economics is listed in Table 1-4 and Table 1-5, and after-tax free cash flow is shown graphically in Figure 1-1.
Table 1-4 Key Economic Results
| | | | | | | | | | | |
| Project Economics | Units | Base Case |
| Pre-tax | Post-tax |
NPV5% | $B | 4.1 | 3.5 |
| IRR | % | 97 | % | 93 | % |
| Payback | Years | 0.7 | 0.7 |
NPV: Capex1 | - | 8.6 | 7.6 |
| Revenue LOM | $B | 11.0 | - |
| Avg. Annual Revenue | $M/y | 765 | - |
| EBITDA LOM | $B | 6.1 | - |
| Avg. Annual EBITDA | $M/y | 427 | - |
| Cumulative FCF LOM | $B | 5.5 | 4.7 |
| Avg. Annual FCF | $M/y | 381 | 327 |
1.NPV:Capex ratio is the ratio of Net Present Values, discounted at 5%, to the initial capital expenditure.
Table 1-5 Additional Economic Model Outputs
| | | | | | | | | | | |
| Item | Units | Year 1-5 | LOM |
Processed Grade |
| Au | g/t | 2.05 | 1.77 |
| Ag | g/t | 101.6 | 63.5 |
| Zn | % | 2.04 | 1.37 |
| Pb | % | 0.87 | 0.58 |
| Au-eq | g/t | 4.11 | 3.10 |
| Ag-eq | g/t | 283 | 216 |
| Recoveries |
| Au rec (%) | % | 96.1% | 96.1% |
| Ag Rec (%) | % | 96.4% | 96.4% |
| Zn rec (%) | % | 74.7% | 74.7% |
| Pb Rec (%) | % | 82.0% | 82.0% |
| Metal Production |
| Gold Production | koz | 877 | 2,254 |
| Silver Production | koz | 43,683 | 81,167 |
| Zinc Production | Mlbs | 467 | 931 |
| Lead Production | Mlbs | 219 | 431 |
| Gold-Equivalent Production (Au-eq) | koz | 1,740 | 3,889 |
| Silver-Equivalent Production (Ag-eq) | koz | 121,283 | 272,219 |
| Operating Cost per Ounce |
AYA GOLD & SILVER INC., BOUMADINE POLYMETALLIC PROJECT 5
| | | | | | | | | | | |
| Item | Units | Year 1-5 | LOM |
Total Cash Costs1 | $/oz AuEq | 998 | 1,169 |
Total AISC2 | $/oz AuEq | 1,105 | 1,300 |
1.Cash costs include mine-site operating costs such as mining, processing, and direct site G&A, as well as product shipping, royalties and mining taxes.
2.AISC is calculated as the sum of treatment and refining charges, onsite operating costs, sustaining capital costs, and closure costs, divided by the quantity of ounces equivalent produced.
Figure 1-1 Boumadine Project - Annual Free Cash Flow Profile
1.12Environmental Studies, Permits and Social or Community Impact
The biophysical and social characteristics of the planned mining area are defined by its semi-arid climate and relatively rural and remote nature. Urban settlements are concentrated along main transport routes with villages located along valleys with access to water resources. Climatic conditions influence local ecosystems and land uses including agriculture, concentrated in areas of water availability.
Limited environmental studies have been completed in the past. As part of the environmental and social work currently being undertaken, an environmental baseline sampling program was initiated by BGM in September 2024 and a high-level screening for critical biodiversity habitat was undertaken by SLR in September 2024.
The baseline sampling, covering soils, air quality and water, was undertaken by AfriLabs, a Moroccan-based laboratory specializing in mineral and environmental analysis.
Additional baseline surveys have been completed during the course of 2026 covering social, biodiversity, soil, water, air quality and noise. The results are being processed to inform the international ESIA process outlined below. Studies covering the topics of biodiversity, hydrology, hydrogeology, soils and sediments, air quality, noise, GHG, climate change, stakeholder engagement, labour and working conditions, community health and safety, and other social elements are ongoing.
The Project will require national permits to support the development of the mine and the requirement to carry out an Environmental Impact Assessment (EIA) under Moroccan Law. The EIA under Moroccan Law, prepared by NOVEC, was completed and submitted in July 2026 to the “Centre Régional d'Investissement” (CRI) (Regional Investment Center). In addition to meeting national permitting requirements, the Project is being undertaken to meet international ESIA lender standards.
AYA GOLD & SILVER INC., BOUMADINE POLYMETALLIC PROJECT 6
A conceptual mine closure plan governed by Aya’s Environmental Policy will be prepared as part of the ESIA.
1.13Conclusions
The Project is at an advanced stage of exploration and geological understanding, supported by drilling and sampling, geological mapping, orientated core, geophysical surveys, historical mine plans as well as previous geological studies. In addition, no significant issues were identified with the analysis of the quality control and assurance (QAQC) programs. These studies provide confidence to the local scale geometry of the mineralization and grade distributions in the resultant Mineral Resources and has allowed SRK to produce a robust geological model with over 158 individual domains modelled. However, there are areas of lower geological confidence, classified as Inferred Mineral Resources and there are some domains SRK was not able to classify, which may be subject to further revision in the future. SRK notes that the there is a degree of uncertainty associated with depletion survey as-builts and that these underground workings are currently inaccessible.
SRK has declared a Mineral Resource Statement for the Boumadine Project. The Mineral Resources are limited to material contained within the conceptualised open pit shell above the NSR reporting cut-off of 60 USD/t and, below the pit shell, to material contained within grade shells (following the removal of isolated shapes) based on a 110 USD/t NSR cut-off that satisfy a minimum 1.5 m minable thickness. The Mineral Resources are reported within the Boumadine Mining licence on an in-situ, undiluted basis and amount to:
•Indicated Mineral Resources (open pit and underground) of some 8,582 kt, at a mean grade of 121.7 g/t Ag, 1.9 g/t Au, 0.09 % Cu, 1.01 % Pb and 2.19 % Zn; and
•Inferred Mineral Resources (open pit and underground) of some 45,365 kt, at a mean grade of 56.8 g/t Ag, 1.8 g/t Au, 0.08 % Cu, 0.58 % Pb and 1.33 % Zn.
The Updated PEA provides a base case assessment for developing the Boumadine mineral resource by conventional open pit and underground mining methods, and a crushing-milling-flotation processing plant with a tailings dam.
The Updated PEA economic analysis shows the Boumadine Polymetallic Project has an after-tax NPV5% of $3.5B, IRR of 93%, and a payback period of 0.7 years. The PEA economics support a decision to continue to advance the Project and carry out additional detailed studies, including pre-feasibility level work and completion of a feasibility study.
1.14Recommendations
Additional expenditures are recommended by the Boumadine Report Authors for the following activities:
•Advance metallurgical testwork, including spatial composites and variability samples.
•Undertake detailed studies for infrastructure, including TSF design, raw water sourcing, electrical line connection and concentrate logistics studies.
•Update and upgrade mining and processing designs through pre-feasibility and feasibility level designs.
•Conduct hydrogeology and geotechnical studies to improve design parameters for mining.
•Complete the ESIA, which will inform a comprehensive Environmental and Social Management and Monitoring Plan to be developed for the Project.
SRK considers there to be opportunities to further improve confidence in the geological interpretation, MRE, and supporting datasets for the Boumadine Project. SRK recommends that Aya consider the following:
AYA GOLD & SILVER INC., BOUMADINE POLYMETALLIC PROJECT 7
•In relation to drilling and geological understanding:
•All drillholes should be designed to intersect the interpreted mineralized wireframes as close to perpendicular as practicable, thereby maximising representativity and location accuracy.
•Continue the ongoing infill drilling program to improve geological and grade continuity that support the conversion of Inferred Mineral Resources to the Indicated category.
•Complete additional twinned diamond drillholes (DD) at representative locations across the deposit, targeting selected existing RC, MP and DD holes completed between 2018 and 2026. Twin holes should be selected to provide representative coverage of the principal mineralised domains, mineralisation styles and grade ranges, one of the target areas should be where different drilling and sampling methods overlap. The twinning program should be used to assess drilling and sampling precision, identify any systematic bias between drilling methods, quantify short-scale geological and grade variability (including the nugget effect), and provide additional information to support the confidence assigned to the current MRE.
•Complete additional step-out diamond drilling to test the strike and depth extensions of the known massive sulphide domains, where this remains open.
•Aya should investigate whether whole rock geochemistry will help with the identification and standardisation of the lithologies encountered in the drilling.
•Include total sulphur (S%), and where practicable sulphide/sulphate sulphur analyzes, within future drilling programs to improve/confirm definition of the oxidation profile and weathering boundary.
•In relation to sampling and core management:
•Record the sample weight for every RC drillhole interval (including rejects) and compare this with the theoretical sample mass based on the logged lithology to identify intervals with poor recovery that may require re-drilling.
•Photograph all available drill core and RC chip trays and incorporate these records into the Imago database to establish a comprehensive digital photographic archive.
•Include all drillcore photographs taken prior to 2024 into the Imago database.
•Continue to maintain and periodically review sampling and QA/QC procedures as exploration progresses.
•In relation to density:
•Expand the density measurement program, particularly within the mineralized wireframes and transitional (weathered) mineralized zones, to improve the representativeness of the density dataset and reduce reliance on regression-derived density estimates.
•Collect density measurements from drillholes that currently contain no density information and consider obtaining additional measurements from archived drill core where appropriate.
•Consider the use of plastic film or paraffin wax coatings during density determinations to minimize moisture ingress for friable or fractured core.
•Undertake a representative moisture content sampling program using fresh drill core collected from across the Project to improve future mining and processing studies, particularly for the Feasibility Study.
•In relation to QA/QC:
•Expand the duplicate QA/QC database to include the complete analytical suite and include the following assays obtained as a minimum, Cu, Pb and Zn prior to the next Mineral Resource update.
AYA GOLD & SILVER INC., BOUMADINE POLYMETALLIC PROJECT 8
•Introduce pulp duplicate samples into the routine QA/QC program.
•Consider introducing a commercially certified blank material or undertake a round-robin program to better characterise the locally sourced blank material.
•Review duplicate records where assay values are missing or recorded as zero and update the database against the original laboratory certificates where appropriate.
•Investigate and correct anomalous CRM assay values, including the Zn CRM records noting as being in excess of 100%.
•Consider discontinuing OREAS 100A, OREAS 354 and OREAS 994 as these are not certified CRMS for base metal analysis using Aqua regia or for Au and Ag using fire assay analysis.
•Investigate the small number of CRM sample swaps/mislabels that remain within the QA/QC database, resulting either from the mislabelling of original drill core samples or from other QA/QC samples (including CRMS) being incorrectly assigned, and resolve these where possible.
•Continue the routine umpire laboratory program and consider increasing the proportion of samples submitted to the umpire laboratory, including representative samples from the 2024 drilling program.
•Where practicable, ensure that future umpire analyzes use analytical methods with reporting limits comparable to those of the primary laboratory.
•In relation to surveying:
•Incorporate the planned high-resolution pre-mining drone survey into future geological models and associated mining studies.
•Where safe and practicable, resurvey historical underground workings (once mining begins) and surface artisanal excavations to improve confidence in future depletion models.
•In relation to Resource Estimation:
•Develop a 3D lithological model, subject to the availability of sufficient geological data, to improve geological understanding and support future Mineral Resource, Mineral Reserve, geotechnical, and mine planning studies.
•Undertake a change-of-support study following additional infill drilling to optimize the parent block dimensions and improve future Mineral Resource estimates.
•Incorporate a Mineable Stope Optimizer (MSO) into future Mineral Resource estimates using parameters representative of the proposed underground mining method for Resource reporting.
•Aya should expand its metallurgical test work program to include the weathered/transitional material in order to demonstrate this has reasonable prospects for eventual economic extraction.
•In relation to Net Smelter return Calculation and Equivalent cut-off value calculations:
•Aya should review the NSR royalty calculation in future updates so that royalties are applied directly to the relevant concentrate streams and remain linked to the underlying value drivers.
•SRK recommends that Aya model concentrate penalties and deductions separately from treatment charges, using concentrate grades as inputs.
•Aya should consider incorporating freight costs within the NSR calculation in future updates, rather than operating costs, to link these costs directly to the saleable concentrate mass.
•Review the concentrate mass calculation methodology to account for the sequential processing flowsheet. Specifically, Pb concentrate should be based on plant feed grades, Zn concentrate
AYA GOLD & SILVER INC., BOUMADINE POLYMETALLIC PROJECT 9
should be based on Pb-circuit tailings grades, and pyrite concentrate should be based on Zn-circuit tailings grades. This would affect the calculated mass pull and therefore shipment costs. The difference is expected to be immaterial for Pb and Zn concentrates but may be more relevant for pyrite concentrate.
•SRK recommends calculating the equivalent Ag and Au grades using NSR factors, opposed to the current approach which uses metal prices and metallurgical recoveries only. This approach will avoid any inconsistency with the NSR framework already in place.
SRK has not prepared a detailed exploration budget for the Project but has reviewed the budget and associated schedules provided by Aya. These principally relate to infill drilling intended to upgrade portions of the currently classified Inferred Mineral Resources to Indicated Mineral Resources and support the proposed 15- year life-of-mine plan. Based on Aya's proposed program, approximately 326 000 m of additional drilling is anticipated, with estimated drilling and sampling costs of approximately US$ 65 million. This cost estimate excludes the multidisciplinary Feasibility Study (FS) planned by Aya for 2027.
AYA GOLD & SILVER INC., BOUMADINE POLYMETALLIC PROJECT 10
2.0INTRODUCTION AND TERMS OF REFERENCE
2.1Terms of References
This Technical Report on the Boumadine (also known as Boumaadine, Boumâadine, and Bou Madine) Deposit was prepared by Aya Gold and Silver Inc. (“Aya” or the “Company”) at the request of Mr. Benoit La Salle, President & CEO of Aya Gold & Silver Inc. Aya is a public, TSX listed company trading under the symbol “AYA”, with its head office located at: Suite 132, 1320 Graham, Ville Mont-Royal, Québec, H3P 3C8. This Technical Report has an effective date of September 9, 2026.
This Technical Report (“the Report”) has been prepared to provide a fully compliant NI 43-101 Technical Report and Preliminary Economic Assessment ("PEA") of the existing mineralization at the Boumadine Deposit (or the “Boumadine Property” or the “Boumadine Mining License”), located in the Kingdom of Morocco. The Boumadine Mining License is a joint venture owned by Aya (85%) and l’Office National des Hydrocarbures et des Mines (“ONHYM”) (15%) of the Kingdom of Morocco. Aya (known as Maya Gold & Silver at the time of the Acquisition Agreement) and Office National des Hydrocarbures et des Mines (“ONHYM”) signed an agreement on October 9, 2012, for the acquisition of the Boumadine Mining License. A new Moroccan company, Boumadine Global Mining (“BGM”), was created with Aya (85%) and ONHYM (15%) as shareholders. The mining title of the Boumadine Mining License was transferred to BGM by ONHYM.
The name change from Maya Gold & Silver Inc. to Aya Gold & Silver Inc. was announced in a press release dated July 30, 2020. The Updated Mineral Resource Estimate reported herein is based on up-to-date drilling results and appropriate metal pricing, and is fully conformable to the “CIM Standards on Mineral Resources and Reserves – Definitions (2014) and Best Practices Guidelines (2019)”, as referred to in National Instrument (“NI”) 43-101 and Form 43-101F, Standards of Disclosure for Mineral Projects.
2.2Sources of Information
2.2.1Site Visit
In accordance with NI43-101, Guy Dishaw (QP) of SRK completed a site visit to the Project between 23 and 28 April 2026, accompanied by Pierre Pihouée of Aya. The site visit took place during the course of the commission to gain an understanding of the local geology, styles of mineralization, drilling practices, core handling procedures, core orientation methods, sampling protocols, and the data management systems employed by the Company, as well as to interview Project personnel. During the site visit, Guy Dishaw also undertook high-level mapping of mineralization exposed at surface, verified the collar positions of 14 drillholes, and inspected key Project infrastructure, including areas of historical artisanal mining. In addition, Guy visited the Company's sample preparation laboratory on site and the assay laboratory operated by Afrilab, located in Marrakech.
Observations made during the site visit were consistent with the geological interpretations adopted for the Mineral Resource Estimate (MRE) and provided confidence that the drilling, sampling, and data collection procedures employed by the Company are suitable for supporting an MRE.
Two additional independent Qualifed Persons have visited the site. Cortney Palleske, M.A.Sc., P.Eng., visited the Boumadine Property from June 5 to 7, 2024 and July 7 to 16, 2026, to meet with project geological team, inspect core, and tour the property as part of the mining geotechnical evaluation program. Alex Pheiffer, PrSciNat, visited the site from September 1 to 3, 2024 and January 19 to 20, 2026 as part of the Environmental and Social Impact Assessment ("ESIA"), met with the geology team and toured site to assess proposed locations of infrastructure.
AYA GOLD & SILVER INC., BOUMADINE POLYMETALLIC PROJECT 11
2.2.2Additional Information Sources
This Report is based, in part, on internal Company technical reports, database, and maps, published government reports, company letters and memoranda, and public information as listed in the references (Section 27) of this Report. Several sections from reports authored by other consultants have been directly quoted or summarized in this Technical Report, and are cited where appropriate.
The Authors of this Report have used selected portions or excerpts from material contained in the following NI 43-101 compliant Technical Reports, which are publicly available on SEDAR+ under Aya’s profile:
•Boily, M. 2014. The Boumadine Polymetallic (Au, Ag, Zn, Pb, Cu) Deposit, Errachidia Province, Kingdom of Morocco. Prepared for Maya Gold & Silver Inc. by Boily, Michel. Effective Date April 2, 2014. Issue Date April 2, 2014. 217 pages.
•GoldMinds Geoservices Inc. 2019. NI 43-101 Technical Report Preliminary Economic Assessment [of the] Boumadine Polymetallic Deposit, Kingdom of Morocco. Prepared for Maya Gold & Silver Inc. by Duplessis, C., Rachidi, M., Dufort, D. and Rousseau, G. Effective Date: April 24, 2019. Issue Date: May 24, 2019. 304 p.; and
•P&E Mining Consultants Inc. 2024. NI 43-101 Technical Report and updated Mineral Resource Estimate of the Boumadine Polymetallic Project, Kingdom of Morocco. Prepared for Aya Gold & Silver Inc. by Stone, W., Brown, F., Barry, J., Yassa, A., Feasby, G. and Puritch, E. Effective Date: May 08, 2024. Issue Date: May 31, 2024. 214 p.;
•Aya Gold & Silver 2025. NI 43-101 Technical Report and Updated Mineral Resource Estimate of the Boumadine Polymetallic Project, Kingdom of Morocco. Prepared for Aya Gold & Silver Inc. by Lalonde, D, and Pérez, P. Effective Date: February 24, 2025. Issue Date : March 31, 2025. 193 p.
•Aya Gold & Silver 2025. NI 43-101 Technical Report and Preliminary Economic Assessment for the Boumadine Polymetallic Project, Kingdom of Morocco. Prepared for Aya Gold & Silver Inc. by Nayak, P., Venter, R., Shaikh, Z., Berson, B., Pheiffer, A., Papageorgiou, G., Puritch, E., Yassa, A., Brown, F., Barry, J., Stone, W., and Palleske, C. Effective Date: November 4, 2025. Issue Date : December 18, 2025. 326 p.
Since 2024, Aya has continued extensive mineral exploration and drilling programs. The results of these programs were disclosed publicly in numerous Aya press releases and are summarized in Sections 9 and 10 of this Report.
The Authors and Co-authors of each section of this Report are listed in Table 2-1, who in acting as Qualified Persons as defined by NI 43-101, take responsibility for those sections of this Report as outlined in the “Certificate of Author” included in Section 28 of this Report.
Table 2-1 Qualified Persons Responsible for this Report
| | | | | | | | |
Qualified Person | Company | Sections of Technical Report |
Preetham Nayak, P.Eng. | Lycopodium (Americas) Ltd. | 2, 3.2, 19, 21.1.1, 21.1.3, 21.1.6-21.1.10, 21.2.4, 22, 24.1 and Co-Author 1, 25, 26, 27 |
| Ruan Venter, P.Eng. | Lycopodium (Americas) Ltd. | 13, 17, 21.2.2 - 21.2.3, 24.2 and Co-Author 1, 25, 26, 27 |
| Zuned Shaikh P.Eng. | Lycopodium (Americas) Ltd. | 18.1 to 18.3, 18.6 to 18.13, and Co-Author 1, 25, 27 |
Paul Gauthier, P.Eng. | CCE Mining | 16.1, 16.3-16.10, 18.4, 21.1.2, 21.2.1 and Co-Author 1, 25, 26, 27 |
| Alex Pheiffer, PrSciNat | SLR Consulting France SAS | 20 and Co-Author 1, 25, 26, 27 |
| George Papageorgiou PrEng, PhD, MSc, BSc, Eng (Civil), Wits | Epoch Resources (Pty) Ltd | 18.5, 21.1.4-21.1.5, 21.2.5, and Co-Author 1, 25, 26, 27 |
AYA GOLD & SILVER INC., BOUMADINE POLYMETALLIC PROJECT 12
| | | | | | | | |
Qualified Person | Company | Sections of Technical Report |
| Guy Dishaw, P.Geo. | SRK Consulting (UK) Ltd | 3.1, 4-12, 14, 23.1 and Co-author 1, 14, 25, 26, 27 |
| Cortney Palleske, M.A.Sc., P.Eng. | RockEng Inc. | 16.2 and Co-Author 25, 27 |
2.3Units and Currency
In this Technical Report, all currency amounts are stated in US dollars (“$”) unless otherwise stated. Commodity prices are typically expressed in US dollars (“US$”) and will be duly noted where appropriate. Quantities are generally stated in Système International d’Unités (“SI”) metric units including metric tons (“tonnes”, “t”) and kilograms (“kg”) for weight, kilometres (“km”) or metres (“m”) for distance, hectares (“ha”) for area, grams (“g”) and grams per tonne (“g/t”) for metal grades. Platinum group metal (“PGM”), gold and silver grades may also be reported in parts per million (“ppm”) or parts per billion (“ppb”). Copper metal values are reported in percentage (“%”) and parts per billion (“ppb”). Quantities of PGM, gold and silver may also be reported in troy ounces (“oz”), and quantities of copper in pounds (“lb”). Abbreviations and terminology are summarized in Table 2-2 and units in Table 2-3.
Grid coordinates for maps are given in the UTM WGS 84 Zone 30 R or as longitude and latitude.
Table 2-2 Terminology and Abbreviations
| | | | | |
| Abbreviation | Meaning |
| $ | dollar(s) |
| ° | degree(s) |
| °C | degrees Celsius |
| < | less than |
| > | greater than |
| % | percent |
| 3-D | three-dimensional |
| AAS | atomic absorption spectrometry |
| Actlabs | Activation Laboratories Ltd. |
| Ag | silver |
| AgEq | silver equivalency |
| ALS | ALS Laboratory (Australian Laboratory Services), ALS Limited |
| ANCOLD | Australian National Committee on Large Dams |
| As | arsenic |
| Au | gold |
| AuEq | gold equivalency |
| avg | average |
| Aya | Aya Gold & Silver Inc. |
| Ba | barium |
| BGM | Boumadine Global Mining |
| BRGM | Bureau des Recherches Géologiques et Minières |
| BRPM | Bureau de Recherches et de Participations Minières |
| BWI | ball mill work index |
| CaO | calcium oxide |
| Cd | cadmium |
| CDA | Canadian Dam Association |
| CGG | Compagnie Générale de Géophysique |
AYA GOLD & SILVER INC., BOUMADINE POLYMETALLIC PROJECT 13
| | | | | |
| Abbreviation | Meaning |
| CIL | carbon-in-leach |
| CIM | Canadian Institute of Mining, Metallurgy and Petroleum |
| cm | centimetre(s) |
| CN | cyanide |
| Co | cobalt |
| Company, the | Aya Gold & Silver Inc. |
| CRI | Comité Régional d’Investissement (centre of investment) |
| CRM(s) | certified reference material(s) |
| CSA | Canadian Securities Administrators |
| CSAMT | controlled-source audio magnetotelluric survey |
| Cu | copper |
| d | day |
D80 | 80% passing size |
| DAR | Direction des Affaires Rurales |
| Deposit, the | Boumadine Deposit |
| E | east |
| EBRD | European Bank for Reconstruction and Development |
| ESMS | environmental and social management system |
| ESIA | Environmental and Social Impact Assessment |
| FA | fire assay |
| Fe | iron |
| g | gram |
| G&A | General and administration |
| g/L | grams per litre |
| g/t | grams of metal per tonne |
| GISTM | Global Industry Standard on Tailings Management |
| GoldMinds | GoldMinds Geoservices Inc. |
| ha | hectare(s) |
| HC | Hot Curing |
| HSEC | Health and Safety, Environment and Community |
| ICOLD | International Commission on Large Dams |
| ICP | inductively coupled plasma |
| ICP-OES | inductively coupled plasma-optical emission spectroscopy |
| ID | identification |
ID2 | inverse distance squared |
| IFC | International Finance Corporation |
| ISO | International Organization for Standardization |
ISO/IEC | International Organization for Standardization/International Electrotechnical Commission |
| k | thousand(s) |
| kg | kilogram(s) |
| kg/t | kilogram(s) per tonne |
| km | kilometre(s) |
km2 | square kilometre(s) |
| koz | thousands of ounces |
| kt | kilotonne(s), thousands of tonnes |
| kWh/t | kilowatt hour per tonne |
| L | litre(s) |
AYA GOLD & SILVER INC., BOUMADINE POLYMETALLIC PROJECT 14
| | | | | |
| Abbreviation | Meaning |
| lb | pound(s) (weight) |
| LB | Lime Boiling |
| LCT(s) | locked cycle testwork(s) |
| level | mine working level referring to the nominal elevation (m RL), e.g. 4285 level (mine workings at 4285 m RL) |
| LoM | life of mine |
| M | million(s) |
| m | metre(s) |
m3 | metres cubed |
| m asl | metres above sea level |
| Ma | millions of years |
| MAD | Moroccan Dirham |
| mag | magnetic(s) |
| max. | maximum |
| Maya | Maya Gold and Silver Inc. |
| mbs or MBS | metres below surface |
| Mg | magnesium |
| min. | minimum |
| mL | millilitre(s) |
| mm | millimetre(s) |
| Mn | manganese |
| Moz | million ounce(s) |
| MRE | Mineral Resource Estimate |
| Mt | million(s) tonnes per year |
| MTEDD | le ministère de transition énergétique et durable or minister of durable energetic transition |
| N | total number of observations/population size |
| N | north |
| N10 | National Highway 10 |
| NaCN | sodium cyanide |
| Ni | nickel |
| NI or NI 43-101 | National Instrument or National Instrument 43-101 |
| NN | Nearest Neighbour |
| NPV | net present value |
| NSR | net smelter return |
| OK | Ordinary Kriging |
| ONEE | Office National de l'Électricité et de l'Eau Potable |
| ONHYM | Office National des Hydrocarbures et des Mines |
| ORE | ORE Research & Exploration Pty Ltd. |
| oz | ounce(s) |
P80 | 80% passing size |
| P&E | P&E Mining Consultants Inc. |
| PAX | potassium amyl xanthate |
| PEA | Preliminary Economic Assessment |
| Pb | lead |
| P.Eng. | Professional Engineer |
| P.Geo. | Professional Geoscientist |
| POX | pressure oxidation |
| ppm | parts per million |
AYA GOLD & SILVER INC., BOUMADINE POLYMETALLIC PROJECT 15
| | | | | |
| Abbreviation | Meaning |
| Property, the | Boumadine Property |
| Q1, Q2, Q3, Q4 | first quarter, second quarter, third quarter, fourth quarter of the year |
| QA | quality assurance |
| QA/QC | quality assurance / quality control |
| QC | quality control |
R2 | the coefficient of determination |
| Report, the | this Technical Report |
| RQD | rock quality designation |
| S | south |
| S | sulphur |
| SEDAR | System for Electronic Document Analysis and Retrieval |
| SGS | SGS Canada Inc. / SGS Lakefield Research |
| Si | silicon |
| SIPX | sodium isopropyl xanthate |
| SODECAT | Société de Développement du Cuivre de l’Anti Atlas |
| SODIM | Société de Développement de l'industrie maricole |
| Sr | strontium |
| t | metric tonne(s) |
t/m3 | tonnes per cubic metre |
| Technical Report | (this) NI 43-101 Technical Report |
| TEM | Transmission Electron Microscopy |
| TIMA-X | Tescan Integrated Mineral Analyses |
| TSF | tailings storage facility |
| TSX-V | Toronto Venture Stock Exchange |
| TTF | Tamerzaga-Timrachine Formation |
| URSTM | Unité de recherche et de service en technologie minérale |
| US$ | United States dollars |
| UTM | Universal Transverse Mercator |
| VTEM | Versatile Time Domain Electromagnetic (survey) |
| W | west |
| w/w | weight by weight |
| wireframe | polygons joined together to represent a specific 3-D domain or unit |
| wt% | weight percent |
| XRD | x-ray diffraction |
| Zn | zinc |
AYA GOLD & SILVER INC., BOUMADINE POLYMETALLIC PROJECT 16
Table 2-3 Unit Measurement Abbreviations
| | | | | | | | | | | |
| Abbreviation | Meaning | Abbreviation | Meaning |
| μm | microns, micrometre | m3/h | cubic metre per hour |
| $ | dollar | m3/s | cubic metre per second |
| $/t | dollar per metric tonne | m3/y | cubic metre per year |
| % | percent sign | mØ | metre diameter |
| % w/w | percent solid by weight | m/h | metre per hour |
| ¢/kWh | cent per kilowatt hour | m/s | metre per second |
| ° | degree | Mt | million tonnes |
| °C | degree Celsius | Mtpy | million tonnes per year |
| cm | centimetre | min | minute |
| d | day | min/h | minute per hour |
| ft | feet | mL | millilitre |
| GWh | Gigawatt hours | mm | millimetre |
| g/t | grams per tonne | Mt | million tonnes or megatonnes |
| h | hour | MV | medium voltage |
| ha | hectare | MVA | mega volt-ampere |
| hp | horsepower | MW | megawatts |
| Hz | hertz | oz | ounce (troy) |
| k | kilo, thousands | Pa | Pascal |
| kg | kilogram | pH | Measure of acidity |
| kg/t | kilogram per metric tonne | ppb | part per billion |
| kHz | kilohertz | ppm | part per million |
| km | kilometre | s | second |
| kPa | kilopascal | t or tonne | metric tonne |
| kt | thousands of tonnes or kilotonnes | tpd | metric tonne per day |
| kV | kilovolt | t/h | metric tonne per hour |
| kW | kilowatt | t/h/m | metric tonne per hour per metre |
| kWh | kilowatt-hour | t/h/m2 | metric tonne per hour per square metre |
| kWh/t | kilowatt-hour per metric tonne | t/m | metric tonne per month |
| L | litre | t/m2 | metric tonne per square metre |
| L/s | litres per second | t/m3 | metric tonne per cubic metre |
| lb | pound(s) | T | short ton |
| M | million | tpy | metric tonnes per year |
| m | metre | V | volt |
m2 | square metre | W | Watt |
m3 | cubic metre | wt% | weight percent |
m3/d | cubic metre per day | yr | year |
AYA GOLD & SILVER INC., BOUMADINE POLYMETALLIC PROJECT 17
3.0RELIANCE ON OTHER EXPERTS
3.1Expert Reports
SRK's opinion is based on information provided by the Company through its employees. Most notably, Pierre Pihouée and David Lalonde, Aya Geology Specialists, provided insight into the geological interpretation and mineralization characteristics of the deposit based on their experience at the Project. Patrick Perez, Aya Director of Technical Services, also provided information regarding the most up-to-date technical and economic parameters used to support the reporting of the MRS.
SRK has relied upon this information and, where possible, has independently verified the data provided. In addition, SRK’s QP (Guy Dishaw) completed a site visit to review the physical evidence associated with the deposit.
SRK has not performed an independent verification of land title and tenure as summarised in Section 3 of this report. SRK did not verify the legality of any underlying agreement(s) that may exist concerning the permits or other agreement(s) between third parties but has relied on the Company and its legal advisor for land title issues. SRK was informed by the Company that there are no known litigations potentially affecting the Boumadine mining Licence, which contains the Project.
SRK is not an insider, associate, or affiliate of the Company, and neither SRK nor any affiliate has acted as advisor to the Company or its affiliates in connection with the Project. The results of the MRE, as declared by SRK are not dependent on any prior agreements concerning the conclusions to be reached, nor are there any undisclosed understandings concerning any future business dealings.
SRK would like to acknowledge the support and collaboration provided by Aya personnel for this assignment. Their collaboration was greatly appreciated and instrumental to the success of this project.
3.2Reliance on External Reports and Exports
3.2.1Logistics
The QP for Section 18.13 and Section 22 has relied upon the report titled « Étude logistique du transport en vrac de minerai », prepared by SCX Technology in October 2025. The QP has not independently verified the information contained in this study and considers such reliance reasonable for the purposes of this Technical Report.
3.2.2Marketing
Lycopodium has relied on external information for Request for Interest documents provided by Aya and reviewed by Lycopodium.
3.2.3Taxes
The Qualified Person (QP) responsible for Section 22, has relied upon information, interpretations, and assumptions related to taxation provided by Aya based on current Morocco tax regulations. Lycopodium has not independently verified the taxation inputs and considers such reliance reasonable for the purposes of the Technical Report.
AYA GOLD & SILVER INC., BOUMADINE POLYMETALLIC PROJECT 18
4.0ACCESSIBILITY, CLIMATE, LOCAL RESOURCES, INFRASTRUCTURE AND PHYSIOGRAPHY
4.1Location
Boumadine is located within the Drâa-Tafilalet Region of southeastern Morocco within the Central Anti-Atlas Mountain Belt, a well-established metallogenic province that hosts numerous precious and base metal deposits and occurrences. It is located approximately 340 km southeast of Rabat, 220 km east northeast of Ouarzazate, 290 km east of Marrakech and approximately 80 km southwest of Errachidia (Figure 4‑1). Access to the Project is provided via the national highway network, followed by a series of regional paved and gravel roads extending to the exploration camp and deposit area.
Project coordinates are referenced using the WGS84 UTM Zone 30N coordinate system, unless otherwise stated.
The approximate centre of the deposit is located at approximately 317290E and 3476780N:
Figure 4-1 Location of Boumadine (WGS84 UTM Zone 30N)
4.2Property Description and Mineral Tenure
The Project is located within the Boumadine Mining Licence (LE-383661), which is held by Boumadine Global Mining SA (BGM). BGM is owned 85% by Aya Gold & Silver Inc. (Aya) and 15% by the Office National des Hydrocarbures et des Mines (ONHYM). The Boumadine Mining Licence covers an area of approximately 31.7 km², which expired in May 2026. Aya have informed SRK that they are currently in the processes of renewing the Licence (no change to the extent or conditions) for an additional 10 years. The Company also holds an additional 11 Mining Licences and 19 Exploration Permits within the surrounding region. Figure 4‑2 shows the
AYA GOLD & SILVER INC., BOUMADINE POLYMETALLIC PROJECT 19
Boumadine Mining Licence in relation to Aya permits which are located next to or adjacent to the Boumadine Mining Licence.
All Mineral Resources reported in the MRE are located within the Boumadine Mining Licence. The Boumadine Mining Licence, along with other permits held by Aya in the surrounding area, is listed in Table 4-1.
The project is divided into three zones know as North (contains Tizi and Imarirren Zones), Central and South, shown in Figure 7‑2 and Figure 14‑5 below.
Historical artisanal mining activities have been recognized at several places on the Boumadine Property. Historical mining activity at Boumadine has focused on barite and Pb veins, though the sulphide mineralization at surface has also been historically mined. The BRPM also undertook underground mining of the sulphide mineralization in the three zones (North, Central and South).
SRK has relied upon information supplied by the Company regarding the ownership, status and extent of the Mining Licence and any associated surface rights comprising the Boumadine Project. The Company has stated that the mineral tenure is in good standing. Furthermore, SRK understands that there are no known legal disputes relating to the ownership of the Mining Licence or associated rights.
SRK has not undertaken an independent legal review of the mineral tenure, licence agreements, land ownership, or surface access rights, and expresses no legal opinion regarding the validity of such rights. The information presented in this report relating to mineral tenure and property ownership has been prepared based on documentation supplied by the Company and, where appropriate, publicly available information.
AYA GOLD & SILVER INC., BOUMADINE POLYMETALLIC PROJECT 20
Table 4-1 Aya Mining and Exploration Permits in the Boumadine Property Area
| | | | | | | | | | | | | | | | | |
| Permit ID | Permit Type | Interest of Aya* | Area (km2) | Granted | Expires |
| LE-383631** | Licence d'exploitation | 100% Ownership | 10.34 | 42929 | 46580 |
| LE-383657** | Licence d'exploitation | Option to own 100% | 8 | 45948 | 49599 |
| LE-383661* | Licence d'exploitation | 85% ownership | 31.67 | 42507 | 46158 |
| LE-383685** | Licence d'exploitation | Option to own 100% | 14.67 | 42904 | 46555 |
| LE-383692** | Licence d'exploitation | 100% Ownership | 4.02 | 42504 | 46155 |
| LE-383722** | Licence d'exploitation | Option to own 100% | 9.53 | 45562 | 49213 |
| LE-383724** | Licence d'exploitation | Option to own 100% | 6.16 | 43064 | 46715 |
| LE-383763 | Licence d'exploitation | Option to own 100% | 14.24 | 45135 | 48787 |
| LE-383852** | Licence d'exploitation | Option to own 100% | 9.49 | 43389 | 47041 |
| LE-383853** | Licence d'exploitation | Option to own 100% | 17.59 | 43455 | 47108 |
| LE-383856** | Licence d'exploitation | Option to own 100% | 25.87 | 42571 | 46222 |
| LE-383874** | Licence d'exploitation | Option to own 100% | 8.1 | 42340 | 45992 |
| PE-3052** | Permis d'exploitation | Option to own 100% | 11.68 | 41837 | 46219 |
| PR-3842950** | Permis de recherche | Option to own 100% | 15.57 | 45104 | 46199 |
| PR-3843051** | Permis de recherche | Option to own 100% | 16 | 45087 | 46182 |
| PR-3843056** | Permis de recherche | Option to own 100% | 15.89 | 45087 | 46182 |
| PR-3843057** | Permis de recherche | 100% Ownership | 9.43 | 45087 | 46182 |
| PR-3843146** | Permis de recherche | 100% Ownership | 8.54 | 45091 | 46186 |
| PR-3843156** | Permis de recherche | 100% Ownership | 11.72 | 45091 | 46186 |
| PR-3843332** | Permis de recherche | 100% Ownership | 4.7 | 45211 | 46306 |
| PR-3843342** | Permis de recherche | 100% Ownership | 11.4 | 45091 | 46186 |
| PR-3843370** | Permis de recherche | 100% Ownership | 3.99 | 45359 | 46453 |
| PR-3843371** | Permis de recherche | 100% Ownership | 3.03 | 45359 | 46453 |
| PR-3843372** | Permis de recherche | 100% Ownership | 7.99 | 45359 | 46453 |
| PR-3843387** | Permis de recherche | 100% Ownership | 8.28 | 45472 | 46566 |
| PR-3843388** | Permis de recherche | 100% Ownership | 5.73 | 45472 | 46566 |
| PR-3843389** | Permis de recherche | 100% Ownership | 1.56 | 45472 | 46566 |
| PR-3843390** | Permis de recherche | 100% Ownership | 14.34 | 45472 | 46566 |
| PR-3843391** | Permis de recherche | 100% Ownership | 13 | 45472 | 46566 |
| PR-3843448** | Permis de recherche | 100% Ownership | 12.55 | 45797 | 46892 |
| PR-3843449** | Permis de recherche | 100% Ownership | 14.37 | 45797 | 46892 |
| PR-3843450** | Permis de recherche | 100% Ownership | 5.59 | 45797 | 46892 |
| PR-3843581 | Permis de recherche | 100% Ownership | 0.86 | 46128 | 47223 |
| PR-3843582 | Permis de recherche | 100% Ownership | 0.43 | 46128 | 47223 |
| PR-3843583 | Permis de recherche | 100% Ownership | 0.39 | 46128 | 47223 |
AYA GOLD & SILVER INC., BOUMADINE POLYMETALLIC PROJECT 21
Figure 4‑2 Boumadine Mining Licence in relation to Aya surrounding Licences
4.3Moroccan Mining Legislation
Mining activities within the Kingdom of Morocco are governed principally by Law No. 33-13 relating to Mines, together with its implementing regulations, including Decree No. 2-15-807, and other applicable environmental, land access, health and safety, and administrative laws.
The Moroccan mining framework provides for exploration authorisations, research permits and mining licences, together with associated renewal and transfer procedures, environmental assessment and approval requirements, mine development and operating requirements, and closure and rehabilitation obligations, where applicable.
Under the Moroccan mining code, mining titles are distinct from surface land ownership. A research permit provides the holder with the exclusive right to undertake exploration/search activities within the defined permit area for the relevant mineral substances, subject to compliance with applicable legislation, permit conditions, and work commitments.
A mining licence may be granted following the discovery and delineation of a mineable deposit, subject to satisfaction of the applicable technical, legal, administrative, and environmental requirements as noted in the Moroccan Mining Legislation.
SRK understands, based on information provided by the Company, that the Company’s exploration and mining activities are undertaken in accordance with applicable Moroccan mining legislation. SRK has not independently provided a legal opinion on Moroccan mineral tenure or regulatory compliance.
AYA GOLD & SILVER INC., BOUMADINE POLYMETALLIC PROJECT 22
4.4Acquisition History
On 9 October 2012, Maya Gold & Silver Inc. (Maya) and the Office National des Hydrocarbures et des Mines (ONHYM) entered into a joint venture agreement for the acquisition, development, and exploitation of the Boumadine deposit. Under the terms of the agreement, Maya acquired an 85% interest in Mining Licence LE-383661 for total cash consideration of MAD 28 million (approximately USD 2.8 million at the time of the transaction). A new Moroccan company, Boumadine Global Mining SA (BGM), was subsequently established, with Maya and ONHYM holding 85% and 15% ownership interests, respectively.
On 31 July 2020, Maya changed its name to Aya.
The Boumadine Mining Licence was subsequently transferred by ONHYM to BGM. Under the terms of the joint venture agreement, ONHYM is entitled to a 3% royalty, while Aya is entitled to a 2.75% management fee based on BGM's sales revenue from the first year of commercial production.
Aya, through its Moroccan subsidiaries, has progressively consolidated its interest in the Boumadine Region by undertaking extensive exploration, and by acquiring surrounding Exploration Permits and Mining Licences.
Based upon documentation supplied by the Company, SRK understands that the Boumadine Project is subject to certain royalty interests and contractual agreements associated with historical ownership of the Property. The Company has represented that these agreements are well understood and have been appropriately considered within previous economic evaluations of the Project. SRK has not independently reviewed the contractual agreements relating to royalties or other commercial encumbrances and therefore expresses no opinion regarding their legal interpretation or enforceability.
From the information available, SRK is not aware of any royalty or encumbrance that would materially affect the reporting of the Mineral Resources presented herein.
AYA GOLD & SILVER INC., BOUMADINE POLYMETALLIC PROJECT 23
5.0ACCESSIBILITY, CLIMATE, LOCAL RESOURCES, INFRASTRUCTURE AND PHYSIOLOGY
5.1Accessibility
The Boumadine Project is located within Errachidia Province in the Draa-Tafilalet Region of southeastern Morocco, on the northwestern flank of the Ougnat Massif in the Anti-Atlas Mountains. The Project is readily accessible from the regional road network, being located via National Highway N10. The nearest town is Tinejdad, located approximately 16 km north of the Project, whilst the village of Bouyoud is situated approximately 4 km east of the Project. Access from Tinejdad to the Project is provided by a combination of paved and well-maintained gravel roads suitable for year-round access.
5.2Infrastructure
The Boumadine Project benefits from existing infrastructure developed during historical mining operations and more recent exploration activities. The Property is connected to the Moroccan national electricity grid, which currently supplies power to the exploration camp and associated facilities. Water for exploration activities is obtained from historical underground mine workings and groundwater wells located within the Property.
Existing exploration infrastructure includes administrative offices, drill core logging and storage facilities, the Afrilab sample preparation laboratory, drill contractor workshops, drill contractor accommodation camps and associated storage areas. These facilities support ongoing drilling, geological logging, sampling and other exploration-related studies.
Numerous historical mine access roads, tracks, shafts and underground workings occur across the Property, providing access to the principal historically identified mineralized zones and the historical underground mine (Figure 5‑1). The Project is located approximately 16 km from Tinejdad, which provides basic commercial services, accommodation and supplies, while the regional centre of Errachidia, approximately 70 km northeast of the Project, provides a broader range of commercial services, equipment suppliers, medical facilities and an international airport. Specialist equipment and supplies can be sourced from the larger commercial centres of Marrakech and Casablanca.
SRK considers that the existing infrastructure is adequate to support the current exploration activities being undertaken by Aya.
AYA GOLD & SILVER INC., BOUMADINE POLYMETALLIC PROJECT 24
Figure 5‑1 View looking across the Boumadine project area
5.3Climate
The Project lies within the eastern Anti-Atlas Mountains and experiences a hot desert (BWh) climate under the Köppen climate classification. The High Atlas Mountains form an effective climatic barrier to the north, limiting the influence of Mediterranean weather systems resulting in an arid, Saharan climate.
Summers are typically hot and dry, with maximum daytime temperatures commonly exceeding 40°C, particularly during July and August. Winters are generally mild, with daytime temperatures remaining moderate, although night-time temperatures can fall to near freezing during the coldest months. Average annual rainfall is low and is concentrated primarily during the winter months. Humidity is generally low throughout the year, while sunshine duration remains consistently high. Climatic records from the nearby town of Tinejdad indicate average summer maximum temperatures of approximately 38°C, winter average temperatures between 9°C and 15°C, and annual precipitation typically less than 110 mm.
Seasonal weather conditions are not considered to impose any significant constraints on exploration or future mining operations.
5.4Physiography
The Project is situated within the northwestern portion of the Ougnat Massif, where the landscape is characterised by rugged desert terrain comprising low hills, ridges and broad intervening valleys. Elevations across the Property range from approximately 980 m to 1,300 m above sea level, with local relief being typically controlled by the volcanic and volcano-sedimentary rocks that host the Boumadine mineralization.
AYA GOLD & SILVER INC., BOUMADINE POLYMETALLIC PROJECT 25
The landscape exhibits characteristics typical of the eastern Anti-Atlas, with extensive areas of exposed bedrock, thin soils and limited vegetation cover (Figure 5‑2 and Figure 5‑1). Drainage is predominantly ephemeral, with surface water generally restricted to seasonal watercourses following rainfall events.
Vegetation is sparse and consists primarily of drought-resistant desert species including Acacia raddiana and Tamarix amplexicaulis, together with scattered grasses adapted to arid conditions. More densely vegetated areas occur locally within oasis environments associated with permanent water sources, where date palm cultivation and small-scale agriculture are practised.
Figure 5‑2 shows a view looking across the historic Boumadine mine infrastructure, demonstrating the typical relief and vegetation of the area., whilst Figure 5‑1 also shows the access tracks used by Aya and its contractors and consultants to access the Project area.
Figure 5‑2 View looking over historical Boumadine mine
5.5Local Resources
The principal activity within the region is agricultural, focussed in river valleys and a number of oasis settlements, including Tinejdad. Date palm cultivation is the dominant agricultural activity, although smaller areas of mixed farming also occur where water resources are available.
The local population includes both permanent settlements and traditional Amazigh (Berber) nomadic communities, whose livelihoods are based principally on camel and goat husbandry. Seasonal movement of livestock through the Project area is common and represents a longstanding land use within the region.
The nearest major service centre is Errachidia, which provides commercial services, accommodation, medical facilities, equipment suppliers and an international airport. Additional services and accommodation are available in Tinejdad, whilst specialist equipment and supplies can be sourced from the larger commercial centres of Rabat, Casablanca and Marrakech. A local workforce suitable for exploration activities is available from the surrounding communities, with additional skilled personnel readily obtainable from elsewhere within Morocco.
AYA GOLD & SILVER INC., BOUMADINE POLYMETALLIC PROJECT 26
Overall, SRK considers that the availability of local infrastructure, services, utilities and labour is adequate to support the current exploration activities and potential future mining activities at Boumadine.
AYA GOLD & SILVER INC., BOUMADINE POLYMETALLIC PROJECT 27
6.0HISTORY
6.1Exploration and Mining History
The Boumadine Project has a long history of mineral exploration and small-scale mining (both artisanal and mechanised), with evidence of mineral extraction dating back several centuries. Historical and more modern surface workings are distributed along the principal mineralized structures and targeted both barite and polymetallic mineralization. The surface barite mining relates to modern mining activities, which are undertaken on a small scale for the collection of hand specimens and is ongoing within the Project area. Since the mid-twentieth century, the Project has been explored by several government organisations and private companies using geological mapping, geophysical surveys and drilling, progressively improving the geological understanding of the Project. The Boumadine deposit was also exploited using underground mining methods between 1986 and 1992 by BRPM.
6.2Antiquity to the sixteenth Century
Historical records indicate that Boumadine is located within one of the oldest known mining districts in Morocco. Mineralization is believed to have been exploited during antiquity, with more extensive mining activities undertaken during the fifteenth and sixteenth centuries, when Portuguese miners extracted high-grade oxidised (sulphide) mineralization exposed at surface. Numerous shallow pits, trenches and small underground workings remain visible throughout the Project area and extend to depths up to 20 m below surface. These historical workings occur along more than 4 km of the principal mineralized trend and provided the earliest indication of the continuity of the polymetallic vein system.
6.3BRPM Exploration (1956-1985)
Systematic exploration of the Project area commenced following the establishment of the Bureau de Recherches et de Participations Minières (BRPM), the former Moroccan Government mining agency responsible for national mineral exploration. Between 1956 and 1985, BRPM completed several phases of exploration designed to evaluate the economic potential of the known mineralized structures.
Early exploration activities included regional and detailed geological mapping, trenching, surface sampling and ground geophysical surveys, followed by diamond drilling to test the continuity of the mineralization at depth. These programs confirmed the presence of multiple steeply dipping polymetallic sulphide veins/domains containing Ag, Au, Pb, Zn and Cu mineralization.
During the 1970s and early 1980s, BRPM expanded exploration through additional drilling, underground development, mineralogical investigations and preliminary metallurgical testwork. Geological interpretations developed during this period established some of structural controls on mineralization and demonstrated the continuity of the principal mineralized zones along strike and down dip.
6.4Underground Development and Mining (1986–1992)
Following encouraging exploration results, underground development commenced in 1986 under the management of the Moroccan mining company SODIM. Mining was principally conducted as a pilot-scale operation to evaluate the continuity of the mineralized structures, metallurgical performance, and the economic potential of the deposit, rather than as a sustained commercial mining operation. Between July
AYA GOLD & SILVER INC., BOUMADINE POLYMETALLIC PROJECT 28
1986 and June 1988, SODIM treated approximately 23,700 t of mineralized material sourced from the -50 m level of the Central Zone, with reported average feed grades of 1.38% Pb and 6.0% Zn. Au and Ag recoveries were reported to be less than 30%, reflecting the limitations of the pilot flotation circuit employed at the time.
In June 1988, BRPM resumed control of the Project to undertake further industrial-scale metallurgical testwork. Between June 1988 and May 1989, BRPM processed a further 42,785 t of mineralized material from the -50 m level of the Central Zone, grading 1.57% Pb and 4.97% Zn, through the existing flotation plant. Although metallurgical performance improved, precious metal recoveries remained relatively low.
In 1989, BRPM transferred (loaned) operation of the Project to the "Société de Développement du Cuivre de l'Anti-Atlas" (SODECAT), which continued underground development and pilot-scale mining. Mining activities were concentrated principally on the -100 m level of the Central Zone and the -120 m level of the South Zone, with limited mining also undertaken in the North Zone. During this period, approximately 1,570 m of surface diamond drilling, 111 m of shaft sinking, 1,058 m of underground development and 187 m of raises were completed, together with the rehabilitation and extension of the existing underground infrastructure. In parallel with mining operations, underground drilling, channel sampling, metallurgical investigations and engineering studies were undertaken to further evaluate the deposit.
Mining operations ceased in 1992 after SODECAT concluded that the operation was only marginally profitable under the prevailing economic conditions. Despite the relatively limited scale of historical mining, the underground development and associated geological information have provided insights into the geometry, continuity and controls on the mineralized structures. At the effective date of this report, the majority of the historical underground workings are flooded and are currently utilized by the Company as a source of water for exploration activities.
6.5BRPM Exploration (1993–1998)
Following the cessation of mining, BRPM resumed exploration activities to reassess the remaining mineral potential of the Property. Work completed during this period included additional diamond drilling, geophysical surveys and a reassessment of the geological interpretation. These programs culminated in a MRE in 1998 (not compliant with modern CRIRSCO reporting codes), which represented the most comprehensive assessment of the deposit completed prior to the involvement of Maya.
Further details of the historical MREs are presented in Section 6.8.
6.6Maya Gold & Silver / Aya Gold & Silver (2013–Present)
On 9 October 2012, Maya entered into a joint venture agreement with the Office National des Hydrocarbures et des Mines (ONHYM) for the acquisition, development and exploitation of the Boumadine deposit. Exploration activities recommenced in 2013 following the establishment of Boumadine Global Mining SA, the operating company responsible for the Project.
Initial work programs focused on validating historical exploration results through geological mapping, surface prospecting and systematic grab sampling of the historical mineralized structures. These early investigations confirmed the presence of extensive polymetallic mineralization and identified numerous exploration targets beyond the historical mine areas.
Diamond drilling (DD) recommenced in 2017 with a program designed to confirm the historical geological interpretation and Mineral Resource. Between 2017 and 2020, the Company completed approximately 12,700 m of diamond drilling targeting the South, Central, North (includes the Tizi and Imarirren) Zones. Additional exploration work was also undertaken, including drone topographic surveys, sampling of historical tailings,
AYA GOLD & SILVER INC., BOUMADINE POLYMETALLIC PROJECT 29
geological mapping and continued metallurgical investigations. Collectively, these programs formed the basis of the first CRIRSCO-compliant MRE completed for the Project and reported in accordance with CIM Code guidelines.
On 31 July 2020, Maya changed its name to Aya and exploration activities were significantly expanded. Exploration completed between 2022 and the effective date of this MRE included DD, reverse circulation (RC) drilling, airborne electromagnetic, magnetic and radiometric surveys, satellite-based hyperspectral surveys, geological mapping, trenching, systematic surface sampling alongside a structural study. These programs substantially improved the geological understanding of the deposit, extended known mineralization along strike and down dip depth, and identified several new exploration targets throughout the Project area.
The progressive increase in drilling density and geological understanding has supported successive MRE updates and is a principal reason for the changes reflected in the updated 2026 MRE presented in this report.
During this time, hydrogeological, geotechnical, mineral processing, environmental, social, and mining studies have all been initiated by Aya to support the previous and forthcoming Preliminary Economic Assessments (PEAs).
6.7Historical Production
Historical underground mining undertaken between 1986 and 1992 produced approximately 261,485 t of mineralized material from four underground mining levels. According to BRPM (1998), production comprised 22,355 t from the Central Zone (-50 m level) between 1986 and 1987, 48,130 t from the Central Zone (-50 m level) between 1988 and 1989, 132,000 t from the Central Zone (-50 m and -100 m levels) between 1989 and 1992, and 59,000 t from the South Zone (-70 m and -120 m levels) between 1989 and 1992, at reported average grades of 3.69 g/t Au, 328 g/t Ag and 0.94% Pb.
6.8Previous Mineral Resource Estimates
Four previous MRE’s have been completed for the Boumadine Project. These comprise the historical MRE completed by the BRPM in 1998 (Table 6‑1), this estimate was not compliant with modern CRIRSCO reporting codes. The three other MRE’s were NI43-101 compliant estimates.
The NI43-101 compliant MRE’s were completed by GoldMinds Geoservices Inc in May 2019 (Table 6‑2), P&E Mining Consultants Inc. in May 2024 (Table 6‑3) and by Aya in March 2025 (Table 6‑4). The Aya estimate, the 2025 MRE, and model was used as the basis of a Preliminary Economic Assessment (PEA) dated December 2025.
All previous MRE and Mineral Resource Statements have been superseded by the SRK grade estimation, the 2026 MRE, presented in this Technical Report.
Table 6‑1 BRPM 1998 Boumadine MRE (not compliant with modern CRIRSCO reporting codes)
| | | | | | | | | | | | | | | | | |
| Category | Tonnes | Au (g/t) | Ag (g/t) | Zn (%) | Pb (%) |
| Certain | 280,775 | 3.17 | 171 | 3.6 | 0.7 |
| Very Probable | 267,670 | 2.27 | 155 | 3.27 | 1.02 |
| Probable | 231,230 | 1.06 | 175 | 3.03 | 0.86 |
| Possible | 450,000 | 1.52 | 95 | 3.51 | 1.05 |
AYA GOLD & SILVER INC., BOUMADINE POLYMETALLIC PROJECT 30
Table 6‑2 GoldMinds Geoservices Inc 2019 Boumadine MRE (effective date 15 February 2019)
| | | | | | | | | | | | | | | | | | | | | | | | | | | | | |
| Classification | Tonnes | Au (g/t) | Ag (g/t) | Zn (%) | Pb (%) | Ge (g/t) | USDEq | Au eq (g/t) | Au eq (oz) |
| Total Measured | 337 000 | 3.89 | 142.12 | 0.54 | 0.13 | 0 | 251.65 | 6.02 | 65,000 |
| Total Indicated | 2,195,000 | 1.57 | 127.88 | 3.06 | 1.2 | 3.9 | 250.45 | 6 | 423,000 |
| Total Meas & Ind | 2,532,000 | 1.88 | 129.77 | 2.73 | 1.06 | 3.38 | 250.61 | 6 | 489,000 |
| Total Inferred | 6,451,000 | 1.56 | 89.55 | 2.73 | 1.16 | 5.08 | 222.96 | 5.31 | 1,102,000 |
AYA GOLD & SILVER INC., BOUMADINE POLYMETALLIC PROJECT 31
Table 6‑3 P&E Mining Consultants Inc. 2024 Boumadine MRE (effective date 23 February 2024)
| | | | | | | | | | | | | | | | | | | | | | | | | | | | | | | | | | | | | | | | | | | | | | | | | | |
| Class | Cut-off NSR US$/t | Tonnes (kt) | Average Grade | Contained Metal |
| Ag (g/t) | Au (g/t) | Cu % | Pb % | Zn % | AgEq (g/t) | AuEq (g/t) | Ag (koz) | Au (koz) | Cu (kt) | Pb (kt) | Zn (kt) | AgEq (koz) | AuEq (koz) |
| Pit-Constrained |
| Indicated | 95 | 995 | 145 | 2.71 | 0.17 | 1.58 | 5.92 | 634 | 7.4 | 4,647 | 87 | 2 | 16 | 59 | 20,299 | 237 |
| Inferred | 95 | 8,474 | 103 | 2.97 | 0.1 | 0.79 | 2.54 | 475 | 5.54 | 28,087 | 808 | 8 | 67 | 215 | 129,478 | 1,510 |
| Out-of-Pit |
| Indicated | 125 | 1,046 | 82 | 2.33 | 0.11 | 0.58 | 2.79 | 402 | 4.69 | 2,751 | 78 | 1 | 6 | 29 | 13,533 | 158 |
| Inferred | 125 | 15,096 | 76 | 2.42 | 0.07 | 0.87 | 2.19 | 389 | 4.53 | 36,653 | 1,175 | 11 | 131 | 330 | 188,663 | 2,198 |
| Total |
| Indicated | 95/125 | 2,042 | 113 | 2.51 | 0.14 | 1.07 | 4.32 | 515 | 6.01 | 7,398 | 165 | 3 | 22 | 88 | 33,832 | 395 |
| Inferred | 95/125 | 23,569 | 85 | 2.62 | 0.08 | 0.84 | 2.32 | 420 | 4.89 | 64,740 | 1,983 | 19 | 198 | 546 | 318,141 | 3,708 |
Table 6‑4 Aya Gold & Silver Inc. 2025 Boumadine MRE (effective date 24 February 2025)
| | | | | | | | | | | | | | | | | | | | | | | | | | | | | | | | | | | | | | | | | | | | | | | | | | |
| Class | Cut-off NSR US$/t | Tonnes (kt) | | Average Grade | Contained Metal |
| Ag (g/t) | Au (g/t) | Cu % | Pb % | Zn % | AgEq (g/t) | AuEq (g/t) | Ag (koz) | Au (koz) | Cu (kt) | Pb (kt) | Zn (kt) | AgEq (koz) | AuEq (koz) |
| Pit-Constrained |
| Indicated | 95 | 3,920 | 94.3 | 2.99 | 0.13 | 0.84 | 2.95 | 476.5 | 5.3 | 11,881 | 343 | 5.1 | 33 | 116 | 60,051 | 667 |
| Inferred | 95 | 14,258 | 89.7 | 2.89 | 0.1 | 0.81 | 2.38 | 450 | 5 | 41,135 | 1102 | 14.3 | 115 | 339 | 206,293 | 2,293 |
| Out-of-Pit |
| Indicated | 125 | 1,249 | 80.1 | 2.11 | 0.08 | 0.87 | 2.32 | 358.2 | 3.98 | 3,216 | 106 | 1 | 11 | 29 | 14,382 | 160 |
| Inferred | 125 | 14,938 | 74.3 | 2.39 | 0.07 | 0.82 | 1.85 | 356.9 | 3.97 | 35,669 | 1,294 | 10.5 | 122 | 276 | 171,393 | 1,905 |
| Total |
| Indicated | 95/125 | 5,169 | 90.8 | 2.78 | 0.12 | 0.85 | 2.8 | 447.9 | 4.981 | 15,097 | 449 | 6.1 | 44 | 145 | 74,433 | 827 |
| Inferred | 95/125 | 29,196 | 81.8 | 2.63 | 0.08 | 0.82 | 2.11 | 402.4 | 4.473 | 76,804 | 2,396 | 24.8 | 237 | 615 | 377,686 | 4,198 |
AYA GOLD & SILVER INC., BOUMADINE POLYMETALLIC PROJECT 32
7.0GEOLOGICAL SETTING AND MINERALIZATION
7.1Regional Geology
Boumadine is located within the eastern Anti-Atlas Mountains of southeastern Morocco, on the northwestern margin of the Ougnat Massif (also referred to as the Ougnat Boutonnière). The Anti-Atlas forms a major east-northeast-trending mountain belt extending for more than 600 km across southern Morocco and comprises a series of Neoproterozoic inliers (boutonnières) surrounded by younger Palaeozoic sedimentary rocks. The region has exposed rocks associated with the Pan-African Orogeny (approximately 900–550 Ma), which record multiple phases of volcanism, sedimentation, deformation and granitoid intrusion.
Within the Ougnat Massif, a Neoproterozoic metasedimentary basement is unconformably overlain by volcano-sedimentary rocks of the Ouarzazate Supergroup. These rocks comprise felsic to intermediate volcanic and volcaniclastic units together with subordinate mafic volcanic rocks and sedimentary horizons. The Ougnat Massif was subjected to Neoproterozoic shearing, which generated regional-scale faults, which trend northeast – southwest (030/210°). Subsequent Hercynian deformation resulted in the reactivation of these earlier Pan-African structures, producing a complex structural framework that exerted a fundamental control on the emplacement of hydrothermal mineralization throughout the Anti-Atlas.
Recent regional geological studies by Gaboury (2022, 2023) further suggest that the Ougnat Massif may represent part of a large Neoproterozoic volcanic graben or caldera complex, within which the Boumadine deposit is situated (Figure 7‑1). This interpretation is based on the distribution of volcanic and volcano-sedimentary rocks, felsic volcanic centres and regional structural architecture, and provides a possible tectono-magmatic framework for the development of the extensive hydrothermal system associated with the Boumadine deposit.
The volcanic and volcano-sedimentary rocks have been grouped into three formations:
•Tamerzaga-Timrachine Formation ("TTF"): Consists of a volcano-sedimentary sequence comprising felsic crystal tuffs, rhyodacitic ignimbrites, volcaniclastic rocks and subordinate mafic tuffs.
•Isilf-Ouinou-Oufroukh Formation ("IOF"): Consists of volcano-sedimentary rocks, including tuffs and breccias, andesitic flows, and fine- to coarse-grained sedimentary rocks.
•Aoujane-Aissa-Akchouf Formation ("AAA"): Consists of ignimbrites, dacite domes and flows, and andesitic flows.
Boumadine is hosted within the TTF, which comprises felsic volcanic and volcaniclastic rocks overlying mafic volcanic units. Subsequent geological evolution included emplacement of felsic subvolcanic intrusions together with later mafic dykes, which locally offset or truncate the mineralized system. The volcanic succession has undergone extensive hydrothermal alteration associated with polymetallic Au-Ag-Zn-Pb mineralization.
Similar Neoproterozoic volcanic-hosted precious and base metal deposits occur elsewhere throughout the Anti-Atlas Province, reflecting the regional-scale metallogenic significance of the Pan-African tectonic and magmatic events.
Figure 7-1 is a regional geology of the Anti-Atlas and the Ougnat Massif.
AYA GOLD & SILVER INC., BOUMADINE POLYMETALLIC PROJECT 33
Figure 7‑1 Regional geology of the Anti-Atlas and the Ougnat Massif. (A) Geological map showing the distribution of the Neoproterozoic inliers (boutonnières) within the Anti-Atlas (after Bouabdellah and Levresse, 2016). (B) Simplified geological map of the regional geological setting (after Duplessis et al., 2019). The red dashed oval outlines the interpreted graben or caldera. Figure reproduced from Gaboury (2022).
AYA GOLD & SILVER INC., BOUMADINE POLYMETALLIC PROJECT 34
7.2Property Geology
As noted above, the mineralization is hosted by Neoproterozoic volcanic and volcano-sedimentary rocks of the TTF, comprising both mafic and felsic units. The host succession comprises felsic volcanic and volcaniclastic rocks that unconformably overlie mafic volcanic rocks. The felsic succession consists principally of crystal-rich felsic tuffs and volcaniclastic units containing quartz-eye fragments and plagioclase phenocrysts, whereas the underlying mafic succession comprises crystal-rich mafic tuffs containing abundant plagioclase and subordinate amphibole phenocrysts. Locally, the mafic volcanic rocks contain sedimentary clasts, supporting their interpretation as volcaniclastic deposits emplaced in a subaqueous volcanic environment.
The distinction between the felsic and mafic tuffs is an important component of the geological interpretation and appears to influence the distribution and intensity of mineralization; however, this distinction is locally difficult to recognize or is absent from the historical drillhole logging. The principal mineralized corridors are interpreted to be predominantly structurally controlled and extend across the different volcanic and intrusive lithologies.
The geology varies between the principal mineralized zones, as shown in Figure 7‑2. The South and Central zones comprise a combination of felsic volcanic and volcaniclastic rocks, felsic subvolcanic intrusions and mafic tuffs, with mineralization hosted within both the felsic and mafic successions. In contrast, mineralization in the northern area, particularly at Tizi and Imarirren, is more strongly associated with the mafic volcanic succession.
The felsic volcanic and volcaniclastic succession comprises a complex assemblage of felsic volcanic rocks, hydrothermal breccias and felsic subvolcanic intrusions that have been affected by multiple stages of faulting, hydrothermal alteration and sulphide mineralization. Mineralization occurs within predominantly structurally controlled corridors. The Imarirren and Tizi zones, grouped within the North Zone, are located west of the principal Boumadine trend associated with the Central and South zones. Rhyolitic intrusions and volcanic breccias occur locally across the Project. Geological studies undertaken by Gaboury indicate that the stratigraphy and intrusive relationships across the Property are more complex than previously recognized, with repetition of the volcanic sequence interpreted to result locally from synvolcanic faulting.
Drilling completed by Aya has demonstrated that the volcanic stratigraphy includes numerous felsic subvolcanic intrusions occurring as dykes, sills and dome-like bodies. These intrusions display massive, flow-banded, autobrecciated and volcaniclastic textures, indicating emplacement within a shallow volcanic environment. The felsic intrusions are spatially associated with the principal mineralized corridors and are interpreted to have locally provided favourable permeability for hydrothermal fluid flow. Later mafic dykes, including locally porphyritic varieties, cross-cut the volcanic stratigraphy and mineralized structures and are interpreted to post-date the principal mineralizing event. These dykes are commonly north-south oriented, although their orientation varies locally, and they are more abundant in the northern area of the deposit.
The mafic dykes are compositionally similar to the mafic tuffs, contain abundant plagioclase phenocrysts, and occur both as sills within the felsic tuffs and as dykes cutting felsic intrusive rocks. Gaboury (2022, 2023) interpreted these relationships to suggest that at least part of the mafic magmatism was broadly synchronous with the felsic magmatism, reflecting the evolution of a bimodal volcanic system.
Hydrothermal alteration is widespread throughout the Property and is closely associated with the mineralized structures. The felsic volcanic sequence is characterised by pervasive phyllic alteration comprising quartz-sericite-pyrite assemblages that form broad alteration halos surrounding the mineralized zones. Localized zones of kaolinite, pyrophyllite and silicification occur adjacent to mineralization and are interpreted to reflect the circulation of relatively acidic hydrothermal fluids. The underlying mafic volcanic rocks exhibit predominantly
AYA GOLD & SILVER INC., BOUMADINE POLYMETALLIC PROJECT 35
propylitic alteration characterised by chlorite and epidote, with increasing chloritization and pyrite developed proximal to mineralized structures. Black chlorite alteration has also been recognized immediately adjacent to some massive sulphide zones and is interpreted to represent a proximal hydrothermal alteration assemblage.
Extensive near-surface weathering has produced an iron-rich oxidised profile ("chapeau de fer") developed above the sulphide mineralization. The depth of oxidation is variable but typically ranges from 10 m to 50 m below surface, although local variations occur depending on topography and structural setting. The oxidised zone is dominated by goethite and jarosite with subordinate hematite and reflects prolonged supergene oxidation of the sulphide-bearing vein systems.
AYA GOLD & SILVER INC., BOUMADINE POLYMETALLIC PROJECT 36
Figure 7‑2 Simplified geological map of the Boumadine Project showing the principal lithological units, intrusive rocks, major structures and the distribution of the North (Imarirren and Tizi), Central, South, mineralized zones (modified after Bouabdellah and Levresse, 2016; reproduced by Gaboury, 2022).
AYA GOLD & SILVER INC., BOUMADINE POLYMETALLIC PROJECT 37
7.3Structural Geology
The structural framework of the Boumadine Project has been described by several previous studies, including BRPM (1998), GoldMinds Geoservices (2019) and P&E Mining Consultants (2024). Earlier interpretations considered the deposit to comprise a series of steeply dipping, structurally controlled polymetallic veins developed within regional Pan-African structures that were subsequently affected by later deformation. Regional-scale faults, together with associated subsidiary fractures and structures, were interpreted to have acted as conduits for hydrothermal fluid flow and mineral deposition.
The principal mineralized structures generally strike northwest-southeast to north-northwest-south-southeast (340°–350°/160°–170) and dip steeply towards either the northeast or southwest. The principal mineralized structures are cross-cut and locally offset by later northeast-striking (020-200°) steeply dipping faults. The northeast striking faults with the larger offset have been used to divide the deposit into its three distinct areas (South, Central and North). Mafic and felsic dykes also cross-cut the volcanic succession and occur in several orientations; earlier andesite dykes are reported to strike approximately 160-340, whereas later dyke swarms commonly strike approximately north-south (0-180) to north-northeast (030-210°). Late mafic dykes are particularly abundant within the Tizi and Imarirren areas. These interpretations formed the basis of the geological models supporting the 2019 and 2024 MREs.
In addition to this, geological investigations undertaken by Aya, including detailed drill core logging and geological studies completed by Gaboury (2022, 2023), refined the structural interpretation of the deposit (Figure 7‑3). These studies indicate that the principal mineralized corridors are spatially associated with steeply dipping synvolcanic extensional fault systems that accommodated vertical displacement during deposition of the volcanic succession. Repetition of the felsic and mafic volcanic stratigraphy across several of the principal mineralized corridors provides support for this interpretation. Gaboury interpreted these structures as long-lived synvolcanic faults that focused hydrothermal fluid flow and controlled the emplacement of polymetallic sulphide mineralization.
Interpretation of Worldview-3 alteration imagery (Figure 7‑4), geological mapping and drilling indicates that the principal mineralized structures are spatially associated with major structural corridors and felsic subvolcanic intrusions. Gaboury (2022, 2023) proposed that mineralization developed preferentially within structurally favourable zones associated with synvolcanic faulting, including dilational zones and fault intersections. Hydrothermal breccias, massive to semi-massive sulphides, pyrite stockworks and felsic subvolcanic intrusions are spatially associated with these structures, with repeated fault activity providing pathways for hydrothermal fluid circulation and mineral deposition. Felsic subvolcanic intrusions are also interpreted to have locally provided favourable permeability and, in some areas, an additional magmatic fluid contribution to the hydrothermal system.
Gaboury also identified cross-cutting fault sets that locally intersect the principal northwest- to north-northwest-trending mineralized corridors. In particular, Gaboury (2023) identified approximately 020-200°-trending structures and interpreted intersections between these structures and the principal mineralized trend as possible controls on local thickening and metal enrichment.
The current geological interpretation adopted for the 2026 MRE incorporates these updated structural concepts while maintaining continuity with the previous geological framework.
AYA GOLD & SILVER INC., BOUMADINE POLYMETALLIC PROJECT 38
Figure 7‑3 Conceptual structural model proposed by Gaboury (2022) illustrating the interpreted relationship between synvolcanic normal faulting, dextral strike-slip faulting, felsic subvolcanic intrusions, pyrite stockwork and the development of semi-massive sulphide mineralization at the Boumadine deposit (after Gaboury, 2022).
AYA GOLD & SILVER INC., BOUMADINE POLYMETALLIC PROJECT 39
Figure 7‑4 WorldView-3 alteration map and structural interpretation presented by Gaboury, 2022.
AYA GOLD & SILVER INC., BOUMADINE POLYMETALLIC PROJECT 40
7.4Mineralization
The polymetallic sulphide mineralization at the Boumadine deposit generally comprises 1 to 5 m wide, massive to semi-massive sulphide veins and lenses, although locally thicker zones exceeding 10 m are observed. The principal mineralized structures typically strike northwest-southeast (approximately 135°–315°) or, north-south (approximately 000°–180°), and generally dip steeply (>70°), predominantly towards the northeast. These structures typically host the highest-grade mineralization within the Project. The massive sulphide (>70% logged visible sulphide) and semi-massive sulphide (>30% and <70% logged visible sulphide) mineralization is composed predominantly of pyrite, with lesser amounts of arsenopyrite, sphalerite, galena and traces of chalcopyrite. Previous publications have also noted minor amounts of cassiterite, silver-rich sulphosalts, stannite, enargite, bismuthinite, native copper and bismuth.
The massive to semi-massive sulphide mineralization is generally surrounded by a 1 to 10 m thick, and locally up to 20 m thick, halo containing approximately 10 to 30% disseminated sulphides, predominantly pyrite, although the sulphide content within the halo can be considerably lower.
Quartz-carbonate-galena-sphalerite veins are also observed across the Project area and can be laterally continuous at surface. These veins have locally been exploited for barite, principally for the collection of hand specimens.
Gaboury (2022, 2023) suggested that the mineralization can be broadly characterised by four recurring styles that record the evolution of the Boumadine hydrothermal system: (i) massive to semi-massive sulphide veins developed within quartz-carbonate veins and fault zones; (ii) sulphide-rich hydrothermal breccias formed within zones of brittle deformation; (iii) replacement (impregnation) sulphide mineralization developed within porous felsic volcanic and volcaniclastic rocks; and (iv) pyrite-dominated stockwork veinlets and disseminated sulphides developed within alteration halos surrounding the principal mineralized structures. These styles commonly occur together within the principal mineralized corridors and reflect multiple episodes of fault movement, hydrothermal fluid flow, brecciation and sulphide deposition. Gaboury (2022) developed a conceptual model illustrating how these mineralization styles may occur in different configurations depending on the interpreted fluid pressure and structural setting (Figure 7‑6). Under suprahydrostatic pressure conditions, semi-massive sulphide veins may be surrounded by pyrite stockworks forming a damage zone or by pyrite veinlets developed approximately parallel to the principal sulphide vein. Under hydrostatic pressure conditions, mineralization may occur within synvolcanic fault-related hydrothermal breccias (BX3), characterised by silicification, disseminated pyrite, rounded pyrite fragments and angular lithic fragments. Semi-massive sulphide mineralization may be absent from these breccias or may occur as impregnation developed asymmetrically along one wall or symmetrically along both walls of the mineralized breccia zone. The orientation of the smaller pyrite veinlets can be highly variable.
Representative mineralization textures are shown in Figure 7‑6. Gaboury also noted that the orientation of the smaller pyrite veinlets can be highly variable.
Geochemical relationships identified during previous studies indicate a strong positive correlation between Au, Ag and Cu, together with a weaker positive correlation between Zn, Pb and molybdenum (Mo). More recent mineralogical investigations undertaken by Aya indicate that approximately 95% of the Au is associated with pyrite and arsenopyrite and occurs in microscopic to submicroscopic form. Gaboury (2023) further recognized that local enrichment in Au, Ag, Zn and Pb is associated with thermal refinement of massive sulphides, while elevated Au grades within pyrite stockworks are closely associated with arsenopyrite development.
Petrographic observations from mineralized samples at Boumadine indicate that sphalerite locally replaces earlier pyrite and is subsequently followed by galena, reflecting multiple stages of hydrothermal mineral
AYA GOLD & SILVER INC., BOUMADINE POLYMETALLIC PROJECT 41
deposition. U-Pb single-zircon dating of a “chonolithic” rhyolite intrusion that cross-cuts the mineralized veins yielded an age of 553 ± 16 Ma (Levresse, 2001), which has been interpreted to provide a late Neoproterozoic maximum age for the mineralization.
Figure 7‑5 Examples of sulphide mineralization textures from the Boumadine Project. A) Brecciated and slightly oxidized pyrite-rich mineralization with quartz veinlets from the Central Zone muck pile. B) Pyrite-sphalerite mineralized material, sample BOU2012-02, collected from the muck pile near Shaft A of the Central Zone. C) Galena-rich mineralization with pyrite, pyrrhotite, chalcopyrite, sphalerite and later quartz veining from the Central Zone muck pile. D) Reflected-light microphotograph showing pyrite with sphalerite and galena Modified after Boily (2014)
AYA GOLD & SILVER INC., BOUMADINE POLYMETALLIC PROJECT 42
Figure 7‑6 Conceptual model illustrating five configurations of sulphide mineralization at Boumadine under interpreted suprahydrostatic and hydrostatic pressure conditions, including semi-massive sulphide (SM) veins, pyrite (Py) stockworks and veinlets, and synvolcanic fault-related hydrothermal breccias (BX3) with variable development of semi-massive sulphide mineralization (after Gaboury, 2022)
AYA GOLD & SILVER INC., BOUMADINE POLYMETALLIC PROJECT 43
8.0DEPOSIT TYPES
Earlier studies (prior to Gaboury involvement) interpreted mineralization to be largely confined to altered felsic volcanicand volcaniclastic rocks, as mineralized outcrops are exposed almost exclusively within felsic tuffs. More recent drilling completed by Aya has demonstrated that significant mineralization also extends into the underlying mafic volcanic sequence, in some cases the mineralized structures appear to be locally more continuous, thicker and of higher grade. This observation has led Gaboury (2022, 2023) to propose that the mafic volcanic succession represents an important host to the mineralizing system and may reflect a deeper, more confined part of the hydrothermal system.
Gaboury (2022, 2023) further proposed that Boumadine formed within a shallow submarine volcanic environment developed in an extensional basin or graben setting, rather than in a purely subaerial epithermal environment. Under this interpretation, circulation of low-temperature saline convective fluids produced widespread propylitic alteration, while episodic input of acidic magmatic fluids associated with subvolcanic felsic intrusions generated local quartz-sericite-pyrite and advanced argillic alteration together with Au-Ag mineralization. Mixing of these fluid types is interpreted to have produced the observed polymetallic sulphide assemblage dominated by pyrite, and lesser amounts of sphalerite and galena, with subordinate chalcopyrite and arsenopyrite, thereby explaining the transitional characteristics between epithermal and VMS-style mineralization.
This interpretation also provides a geological explanation for the laterally extensive phyllic alteration within the felsic volcanic sequence, the continuity of the mineralized structures into the mafic volcanic succession, and the coexistence of vein-hosted, replacement and massive sulphide mineralization within the same hydrothermal system. Nevertheless, the precise genetic classification of the Boumadine deposit remains the subject of ongoing investigation. The 2026 MRE is based on the observed geological, structural and mineralization characteristics of the deposit and does not depend on any particular genetic interpretation.
AYA GOLD & SILVER INC., BOUMADINE POLYMETALLIC PROJECT 44
9.0EXPLORATION
This section summarises exploration work completed by Maya and Aya at the Boumadine Project. Historical exploration completed prior to Maya’s acquisition of the Project is summarised in Section 6 above.
Since acquiring the Project in 2012, Maya and Aya have undertaken systematic exploration comprising geological mapping, specialist geological studies, geochemical sampling, airborne geophysical surveys, hyperspectral surveys, grab sampling, trenching, tailings sampling and extensive drilling programs. Exploration has progressively expanded from confirmation of the historical Boumadine deposit to regional exploration across the wider property, together with infill drilling undertaken to support the 2026 MRE.
As of 16 April 2026, the exploration database comprised 1,859 exploration records, including surface diamond drilling (DD), reverse circulation (RC) drilling, RC pre-collars with DD tails (MP), historical underground channel samples, underground production drillholes, and dedicated tailings drilling and sampling records. The database contains approximately 425,919 m of drilling and sampling completed by BRPM, Maya and Aya, together with historical underground exploration data (Table 9‑1), as well as drilling conducted in neighbouring Aya licences (Figure 9‑1). It should be noted that the latest assays associated with the database were issued from Afrilabs on the 28 February 2026.
The tailings deposit, and the shallow holes drilled to investigate it, associated with the historical underground mine has not been considered as part of this study.
Table 9‑1 Summary of Aya Database provided by Aya to SRK
| | | | | | | | | | | | | | | | | |
| Company | Year(s) | Type (Code) | Exploration Record Type | Number of Records | Total Metres (m) |
| BRPM | 1963–1985 | DD | Surface diamond drillholes | 118 | 15,590.81 |
| BRPM (SODIM & SODECAT?) | 1964–1966 | PA | Underground percussion (production) drillholes | 18 | 391.03 |
| BRPM (SODIM & SODECAT?) | 1964–1992 | CS | Underground face channel samples | 172 | 680.3 |
| BRPM (SODIM & SODECAT?) | 1,964 | UG-Channel | Underground wall channel samples | 4 | 789 |
| BRPM | Historical* | SS | Surface grab/channel sampling | 207 | 351.26 |
| BRPM Subtotal | | | | 519 | 17,802.40 |
| Maya | 2017–2020 | DD | Surface diamond drillholes | 87 | 12,158.71 |
| Maya | 2,018 | TA | Diamond drillholes completed on historical tailings | 49 | 187.28 |
| Maya Subtotal | | | | 136 | 12,345.99 |
| Aya | 2022–2026 | DD | Surface diamond drillholes | 1,032 | 349,968.29 |
| Aya | 2025 | DD† | Surface diamond drillholes completed on historical tailings facilities | 160 | 673.5 |
| Aya | 2023–2025 | RC | Reverse circulation drillholes | 91 | 18,488.90 |
| Aya | 2024–2025 | MP (RC/DD) | Reverse circulation pre-collar with diamond tail | 81 | 27,313.20 |
| Aya Subtotal | | | | 1,204 | 395,770.39 |
| Grand Total | 1963–2026 | | | 1,859 | 425,918.78 |
AYA GOLD & SILVER INC., BOUMADINE POLYMETALLIC PROJECT 45
Figure 9‑1 Inclined image showing the exploration database provided by Aya plotted in relation to the Boumadine Mining Licence (black), collars coloured by Year with traces coloured grey
9.1Geochemical Sampling/Grab Samples
Surface geochemical sampling has comprised grab sampling, rock-chip sampling, which was completed during geological mapping and prospecting programs, the exploration database contains 207 historical surface grab/channel sampling records demoted as SS in Aya’s database. Sampling was undertaken to characterise exposed mineralization, evaluate new exploration targets and support geological interpretation. Historical tailings have also been systematically sampled to evaluate their precious- and base-metal content, though the associated assay data does not appear to be contained within the Aya database but is noted in the P&E 2024 MRE report.
These samples were used for exploration purposes only and were not used directly in the 2026 MRE.
9.2Historical Underground Sampling
Historical underground mining completed by BRPM generated a valuable geological dataset comprising 172 underground face channel samples, denoted as “CS” in Aya’s database; four underground wall channel samples, denoted as “UG-Channel”; and 18 underground percussion (production) drillholes, denoted as “PA”.
9.3Bulk Sample
No specific bulk samples have been taken by Aya or Maya at the Project to date, historically the underground mining was used to obtain samples for a pilot-scale operation to evaluate the continuity of the mineralized structures, metallurgical performance, and the economic potential of the deposit, rather than as a sustained commercial mining operation, see Section 6.4 for further details on this.
AYA GOLD & SILVER INC., BOUMADINE POLYMETALLIC PROJECT 46
9.4Hyperspectral Surveys
At the end of 2021, Compagnie Générale de Géophysique – Veritas (CGG) completed a satellite-based geological and hyperspectral mineral mapping study over the Boumadine Property on behalf of Aya (Figure 9‑2). The objective of the study was to identify areas exhibiting hydrothermal alteration and favourable structural features associated with the Boumadine mineralizing system, and to place these within a geological framework to support exploration targeting. The program generated geologically meaningful target areas that were subsequently verified during geological mapping campaigns completed in 2022 and 2023.
The study was completed in two stages. The first comprised a regional interpretation at a scale of approximately 1:25,000, aimed at defining the principal structural controls and regional alteration patterns across the property. The second consisted of detailed mapping at a scale of approximately 1:5,000 focused on the Boumadine Mining Licence, providing higher-resolution structural and alteration information over the known mineralized corridor(s).
Multiple satellite datasets were integrated during the interpretation. Sentinel-2 imagery was used as the primary geological base, with Copernicus digital elevation data incorporated to enhance lithological and structural interpretation. ASTER multispectral imagery was utilized to identify clay-, iron- and carbonate-rich alteration assemblages associated with hydrothermal systems and intrusive activity. For detailed mapping, high-resolution WorldView-3 imagery was employed for both structural interpretation and spectral mineral mapping.
The interpreted alteration mineral maps showed a strong spatial correlation with the principal mapped structures and known mineralized zones/corridors. Significant argillic alteration was identified along the northwest-trending fault in the northeastern part of the Boumadine Mining Licence, together with additional argillic alteration developed along a northeast-trending fault immediately west of the principal mineralized corridor. The hyperspectral mineral products also exhibited a close correspondence with the underlying geology, particularly within the North Zone where altered rhyodacite-rhyolite ignimbrite units were clearly delineated. These results provided additional confidence in the structural interpretation and were subsequently integrated with geological mapping, airborne geophysical data and drilling to prioritize follow-up exploration targets.
AYA GOLD & SILVER INC., BOUMADINE POLYMETALLIC PROJECT 47
Figure 9‑2 Map of the 2022 Hyperspectral Survey Completed on Boumadine, (source Aya 2025)
AYA GOLD & SILVER INC., BOUMADINE POLYMETALLIC PROJECT 48
9.5Geophysical Surveys
Historical geophysical surveys completed by BRPM included self-potential (SP), induced polarization (IP), magnetic, gravimetric and controlled source audio-frequency magnetotelluric (CSAMT) surveys, which assisted in delineating the principal mineralized structures and guiding historical drilling programs.
Aya significantly expanded the geophysical coverage of the Boumadine Property. In March 2022, Geotech Ltd. completed a helicopter-borne airborne geophysical survey covering approximately 366 line-km (33 km²) over the Boumadine Mining Licence. Traverse lines were flown east-west at 100 m spacing, with 1,000 m-spaced tie lines. The survey incorporated a Versatile Time Domain Electromagnetic (VTEM) survey (Figure 9‑3), a caesium vapour magnetometer, and an RSI ARGS RSX-5 radiometric spectrometer. The objective of the program was to acquire high-resolution magnetic, electromagnetic and radiometric datasets capable of mapping the known mineralized corridor and identifying potential extensions beneath shallow cover.
The 2022 survey successfully identified a prominent north-south elongate conductive (low-resistivity) anomaly measuring approximately 6 km by 1.5 km, which coincides closely with the historical Boumadine mine workings and the principal mineralized corridor. The conductive anomaly also spatially corresponds with the northern portion of a magnetic low, accurately delineating the known mineralization and supporting the continuation of the prospective structural corridor to both the north and south of the deposit extents known at the time. These datasets were subsequently integrated with geological mapping, hyperspectral interpretation and drilling to refine the geological model and prioritize exploration targets.
Following the success of the 2022 program, Aya commissioned Expert Geophysics Limited (EGL) to complete a second helicopter-borne MobileMT electromagnetic and magnetic survey between February and July 2024. The survey covered the Boumadine (contains the deposit itself), Boumadine West (area to the west of the mining licence) and Boumadine East (area to the east of the mining licence) blocks, encompassing all permits held by Aya at that time. The MobileMT system incorporated airborne three-component electromagnetic sensors together with a caesium vapour magnetometer to provide improved conductivity and magnetic imaging to depths exceeding those achieved during the 2022 survey.
Interpretation of the 2024 survey identified numerous conductive anomalies exhibiting orientations similar to the Boumadine deposit, including several previously unrecognized sub-parallel conductive corridors. Of particular significance was the identification of a large conductive anomaly located approximately 5 km west of the Boumadine deposit, together with extensions of the principal Boumadine conductivity anomaly to the south and additional northwest- and north-south-trending conductive features. These anomalies continue to provide priority targets for follow-up geological mapping and drilling.
AYA GOLD & SILVER INC., BOUMADINE POLYMETALLIC PROJECT 49
Figure 9‑3 2022 VTEM Magnetic Survey Completed at Boumadine (source Aya 2025)
9.6Geological and Structural Mapping
Geological mapping has been undertaken during serval major phases of exploration at the Boumadine Project. Between 2013 and 2016, Maya completed reconnaissance geological mapping and grab sampling of the historically known mineralized structures to verify historical geological interpretations and identify targets for the initial drilling programs. Following the commencement of Aya's exploration programs, detailed geological mapping was undertaken between 2022 and 2025, including specialist studies by Gaboury, to improve the understanding of the lithology, alteration, structural geology and mineralization. This work was integrated with airborne geophysical surveys, hyperspectral interpretation, drilling and geological modelling of the deposit.
Structural mapping identified two principal fault sets superimposed on the main northwest-southeast-trending mineralized corridor, which strikes approximately 340°–350°/160°–170°. The first fault set comprises
AYA GOLD & SILVER INC., BOUMADINE POLYMETALLIC PROJECT 50
northeast (approximately 030°) striking faults that intersect the principal mineralized structures and are interpreted to have influenced Au enrichment and a subsequent Zn mineralizing event. The second fault set comprises east-northeast (approximately 070°) striking faults that cross-cut both the main mineralized corridor as well as north-northeast (approximately 020°) trending structures. These faults are interpreted to represent a later structural event associated with Ag-Pb mineralization.
9.7Trenching
A single trench was completed by Aya during the 2022 exploration program was excavated between drillholes BOU-DD22-001 and BOU-DD22-006 on Section 8125N for a total of 37 m. No significant additional mineralization was identified, and subsequent exploration concentrated on drilling.
AYA GOLD & SILVER INC., BOUMADINE POLYMETALLIC PROJECT 51
10.0DRILLING
Drilling completed to date has comprised predominantly DD, undertaken to identify, delineate, extend and infill the Boumadine mineralized system and surrounding exploration targets located in adjacent licences. DD has also been completed on the historical tailings deposits, although these are not considered as part of the 2026 MRE. The drilling has provided the principal geological, structural, geotechnical and assay information supporting the geological interpretation and grade estimation associated with the 2026 MRE.
As of the effective date of the 2026 MRE, the exploration database contains 1,237 surface DD (377,717.81 m), 91 RC drillholes (18,488.90 m) and 81 MP drillholes (RC pre-collar with a diamond tail; 27,313.20 m), together with historical underground production drilling, underground channel sampling and surface sampling completed by previous operators, as summarised in Table 9‑1. In addition to the resource drilling programs, both Maya and Aya completed dedicated DD programs to investigate the historical tailings facilities, comprising 49 drillholes (187.28 m) completed by Maya during 2018 and 160 drillholes (673.50 m) completed by Aya during 2025. These tailings drillholes are presented separately in Table 9‑1 and are not included within the Mineral Resource drilling statistics in Section 14 below, as the tailings are not considered part of this study. It should be noted that information relating to the drillholes completed in 1992 by the SODECAT-BRPM were not able to be sourced by Aya and therefore are not contained within the Aya database.
Since 2022, Aya has significantly expanded the drilling program, resulting in an increase in the quantity of geological information available to support geological modelling and subsequent MRE updates. In 2023, Aya relogged and re-sampled all available historical DD core from DD completed between 2018 and 2020, comprising 77 drillholes totalling 9,510 m. Historical BRPM drill core and core from the 14 Maya DD completed during 2017, totalling 3,158.2 m, could not be located within Aya's core storage facilities and were therefore unavailable for relogging and re-sampling. These drillholes have been excluded from the 2026 MRE due to the lack of available drill core to support verification of the historical geological and assay data.
Maya and Aya have utilized two drilling contractors during the modern exploration programs: Geosond (Geosond) Maroc SARL and FTE Drilling. At the time of the SRK site visit in April 2026, Geosond and FTE Drilling were active on site, with each contractor operating five diamond drill rigs, Figure 10‑1 shows one of the DD drill rig set up for drilling at the Project. CT20 and CS140 drill rigs were used by (Geosond), whilst FTE used Versadrill and Marcotte drill rigs.
All RC drilling has been conducted by FTE drilling. The drill rigs are all aligned by Aya geologists prior to commencement of drilling.
Drillhole spacing is variable across the Project. However, the majority of the modern drilling used in the 2026 MRE was initially completed on nominal 100-200 m-spaced inclined drill fences, with subsequent infill drilling undertaken on approximately 50 m spacing. The infill drilling is ongoing, with data being collected to be incorporated into future studies. In certain locations, drillhole spacing is closer owing to variations in drillhole inclination or where additional drilling was planned to provide increased drill coverage.
AYA GOLD & SILVER INC., BOUMADINE POLYMETALLIC PROJECT 52
Figure 10‑1 DD drill rig set up at the Project during the SRK QP site visit
10.1Diamond Drilling
Surface diamond drilling forms the principal exploration dataset supporting the geological modelling and grade estimation. Historical drilling completed by BRPM between 1963 and 1985 comprised 118 surface DD totalling approximately 15,591 m. Maya was the first company to undertake modern surface DD at the Project, completing 87 drillholes between 2017 and 2020 for a total of approximately 12,159 m. Aya subsequently expanded the exploration program between 2022 and the effective date of this report, completing 1,032 surface DD drillholes totalling approximately 349,968 m.
Review of the assay database indicates that modern diamond drilling was completed using both HQ and NQ core diameters. Approximately 54% of the assayed diamond drill intervals were drilled using NQ core and 44% using HQ core. Both HQ and NQ core diameters have been utilized throughout the modern drilling programs completed between 2018 and 2026. Analysis of the drillhole database indicates that the majority of drillholes were initiated using HQ core before reducing to NQ at depth.
It should be noted that all drillholes are collared from surface, with the exception of BOU-DD24-455. According to Aya, BOU-DD24-455 is a daughter hole that was wedged from the parent drillhole BOU-DD24-352 at a depth of approximately 215 m below the collar of the parent hole. Consequently, the collar of BOU-DD24-455 does not coincide with the topographic surface.
AYA GOLD & SILVER INC., BOUMADINE POLYMETALLIC PROJECT 53
10.2Reverse Circulation Drilling
RC drilling was undertaken by FTE Drilling to improve drilling productivity. As of the effective date of the drilling database, Aya had completed 91 RC drillholes totalling 18,488.9 m. The RC drilling was undertaken using 6 m drill rods.
In addition, Aya completed 81 MP drillholes, comprising RC pre-collars followed by diamond drill tails, totalling 27,313.2 m. The MP drilling method was used where rapid penetration through overburden or barren rock was required, before continuing with diamond drilling to obtain geological, structural and geotechnical information within and around the mineralized intervals.
SRK’s QP did not observe an RC drill rig in operation during the site visit, as no RC drilling was being undertaken at that time.
10.3Collar Surveys
Historical drillhole collars completed by BRPM were surveyed using the survey methods available at the time of drilling; however, the procedures used for surveying these historical collars have not been documented. The historical surface drillhole collar coordinates were originally recorded in a local mine grid. As noted in Section 12.3, Maya commissioned GOULEX, in 2014 to compile and validate the available historical exploration and mining data. The scope of work included the verification and surveying of historical drillhole collars, shafts and tailings facilities using differential GPS (DGPS), with all surveyed coordinates recorded in the Project UTM coordinate system.
Modern drillhole collars completed by Maya and Aya were surveyed by a Moroccan company named ADETOP, who used a Trimble R8 station, which has an accuracy of 10 cm in the X, Y and Z direction or less. The surveyed collar coordinates were then incorporated into the Project database.
As part of the preparation of the 2026 MRE, SRK independently verified the locations of 14 drillhole collars during the site visit, as noted in Section 12.2 below.
10.4Downhole Surveys
Downhole deviation surveys were completed on all modern exploration drillholes to accurately define drillhole trajectories for geological interpretation and grade estimation. Aya provided the information in Table 10‑1 below, which notes the downhole survey instruments utilized during the drilling; the survey instrument is noted vary depending on the drilling contractor and year of drilling. Geosond initially employed Reflex EZ-Track instruments between 2022 and early 2023 drilling programs before introducing Devico DeviFlex instruments during 2023 and 2024. From 2024 onwards, Geosond progressively adopted Devico DeviGyro and subsequently SPT GyroMaster gyro survey instruments. FTE Drilling predominantly utilized Reflex EZ-Track instruments for drilling between 2024 to 2026, while both Reflex EZ-Gyro and Devico DeviGyro were employed for RC drilling during 2025. The downhole quality control checks were done at the drill rig, which included the survey reading and inspected the magnetic intensity, gravity, deviation and standard deviation of the survey performed with magnetic surrey tools. If all readings were within expected tolerance limits, the survey was accepted.
Downhole survey measurements were generally completed with the first reading at 12.5 m, followed by measurements at approximately 25 m intervals for the majority of drilling campaigns. More recent gyro surveys also include additional closely spaced survey stations, typically at 1 m intervals.
No documented procedures relating to magnetic corrections, magnetic susceptibility testing or independent verification surveys were provided. However, the progressive adoption of gyro survey instruments, particularly
AYA GOLD & SILVER INC., BOUMADINE POLYMETALLIC PROJECT 54
those referenced to true north, substantially reduces the potential influence of magnetic interference on recorded drillhole trajectories. Furthermore, SRK did not identify any material inconsistencies in drillhole trajectories during the three-dimensional (3D) validation of the drilling database.
Table 10‑1 Table showing drilling contractor and downhole survey used between 2022 and 2026 (as provided by source Aya)
| | | | | | | | | | | | | | | | | |
| Drilling Contractor | Year | Drill Type | Survey Tool | Manufacturer | Reference North |
| Geosond | 2022 | DD | EZ-Track | Reflex | Magnetic |
| Geosond | 2023 | DD | EZ-Track | Reflex | Magnetic |
| Geosond | 2023 | DD | DeviFlex | Devico | No |
| Geosond | 2024 | DD | DeviFlex | Devico | No |
| Geosond | 2024 | DD | DeviGyro | Devico | No |
| Geosond | 2025 | DD | DeviGyro | Devico | No |
| Geosond | 2025 | DD | GyroMaster | SPT | True North |
| Geosond | 2,026 | DD | GyroMaster | SPT | True North |
| FTE | 2024 | DD | EZ-Track | Reflex | Magnetic |
| FTE | 2025 | DD | EZ-Track | Reflex | Magnetic |
| FTE | 2025 | RC | EZ-Gyro | Reflex | True North |
| FTE | 2025 | RC | DeviGyro | Devico | No |
| FTE | 2026 | DD | EZ-Track | Reflex | Magnetic |
10.5Hole Orientation
Drilling has generally been designed to intersect the mineralization as close to perpendicular to strike as practicable, with drillholes typically collared from the hangingwall where topography and site access permit. However, south of 3475177 N (in the south zone), the majority of the drillholes have been drilled from the footwall side of the mineralized system, as the steep and rugged terrain locally constrained drill pad locations and prevented drilling from the preferred orientation, resulting in locally sub-optimal intersection angles for certain drillholes. However, given the steeply dipping nature of the mineralization, and variation in dip most drillholes still intersect the mineralized zones at reasonable angles. Consequently, SRK considers that these locally sub-optimal intersection angles are unlikely to have a material impact on the geological interpretation or grade estimation presented in this report.
SRK recommends that future drilling programs continue to consider the orientation of the interpreted mineralized wireframes during Aya drillhole planning to maximize the angle of intersection and minimize excessively long, non-perpendicular mineralized intercepts where terrain and site access allows.
Figure 10‑2 presents a plan view of the drillhole traces relative to the interpreted mineralized wireframes, while Figure 10‑3, presents a representative cross-section illustrating drilling completed from both the hangingwall and footwall sides of the mineralized system.
AYA GOLD & SILVER INC., BOUMADINE POLYMETALLIC PROJECT 55

Figure 10‑2 Plan view showing the modelled wireframes (green) vs the drillhole traces at Boumadine (includes excluded drillholes)
AYA GOLD & SILVER INC., BOUMADINE POLYMETALLIC PROJECT 56

Figure 10‑3 Cross-sections A and B showing interpreted mineralized zones and drillhole traces. Section A is located at X = 317377, Y = 3476536; Section B is located at X = 317754, Y = 3473655. Drillhole traces are shown in pink, interpreted zones in green, and topography in grey.
AYA GOLD & SILVER INC., BOUMADINE POLYMETALLIC PROJECT 57
10.6Core Orientation
Core orientation was routinely completed during the modern diamond drilling programs to enable the collection of oriented structural data and improve the interpretation of the geological framework and mineralized structures. Review of the Project database indicates that the Company utilized both Devico DeviCore BTT and Imdexs ACTx (Figure 10‑4) core orientation systems during the exploration programs; however, no information was available to identify which drillholes were oriented using each device. Orientation marks were transferred onto the drill core immediately following retrieval from the drill string and maintained throughout the logging process to facilitate the measurement of geological structures.
This orientation line provided a reference which runs along the length of the core, relative to which the orientations of planar structural features (inclusive of bedding, foliation, veining, faulting, etc.) and/or linear features (lineations, striations, etc) could be determined.
For the orientated drilling, structural features such as faults, fractures and veins were recorded. The depths of the features were measured along with orientation data such as the alpha and beta angles on the core. The alpha angle is the acute angle described by the plane of the structural feature (the line joining the top and bottom closures of the core ellipsoid), and a line parallel to the core axis. The beta angle is the angle between the reference orientation line along the core and the bottom of the ellipse in a clockwise direction on the down dip end of the structural feature (0-360º).
Oriented structural logging largely depends on accurate marks from the orientation tool for downhole orientation. At Boumadine each structural measurement is assigned an orientation confidence rating ranging from 0 (low) to 4 (high), allowing lower-confidence measurements to be readily identified during subsequent structural interpretation.
Figure 10‑4 Core orientation procedure using the ACTx tool. A: ACTx orientation tool fitted to the core barrel with green status lights indicating successful operation. B: Bottom-of-hole orientation mark recorded on the end of the core run after ACTx orientation.
AYA GOLD & SILVER INC., BOUMADINE POLYMETALLIC PROJECT 58
10.7SRK Comments
SRK considers that the exploration work completed by Maya and Aya is appropriate for the style of mineralization and the current stage of the Project and conforms to industry best practices. The combination of geological mapping, hyperspectral interpretation, airborne geophysics, surface sampling and extensive drilling including orientated drilling has provided a suitable basis for geological interpretation and grade estimation. SRK notes that drilling remains the principal source of data supporting the 2026 MRE. Confidence in the geological interpretation decreases in areas of reduced sample coverage and is reflected in the classification of mineral resources, as noted in Section 14.12.
The procedure used to acquire drilling information in programs prior to Maya/Aya are not fully documented. Historical holes (surface and underground), make up 11% of the DD database. These are generally surrounded by newer Maya and Aya drillholes which largely confirm the location of mineralization which indirectly suggests that the location accuracy of the historical holes is reasonable. However, as noted in Section 14.1, the historical drillholes have been excluded from the 2026 MRE due to a lack of QAQC and or core available for verification sampling and assaying.
AYA GOLD & SILVER INC., BOUMADINE POLYMETALLIC PROJECT 59
11.0SAMPLE PREPARATION, ANALYSIS AND SECURITY
11.1Introduction
The following section relates to the logging and sampling methods and protocols used by Aya and Maya during the exploration conducted post 2017. Logging and sampling procedures have evolved during successive exploration campaigns; however, the overall workflow has remained consistent throughout the modern exploration programs.
The historical BRPM drilling programs pre-date the current exploration undertaken by Maya and Aya. Although historical geological and assay data have been retained within the Project database, very little documentation describing the associated logging, sampling, sample preparation, analytical and sample security procedures relating to the historical BRPM drilling has been made available to SRK. Consequently, this section primarily describes the procedures adopted during the modern Maya and Aya exploration programs.
For the DD, the drill core from each run was placed in the core boxes (plastic and wood) at the rig by the drilling team, with plastic spacers inserted at the start/end of each run, marked with the appropriate depth. At the end of each shift the drillcore is transported to Aya’ s secure core logging and sampling facility where the core is then subjected to the following steps:
•the core was reconstructed,
•geotechnically logged,
•Structurally logged (orientated core)
•geologically logged,
•photographed
•marked for sampling prior to being cut
•Core cutting and preparation of samples for dispatch.
For the RC, the drill cuttings were collected from the cyclone at nominal 1 m intervals. Further sample reduction was obtained using a riffle splitter, with one split retained for laboratory analysis and a second split retained in labelled chip trays for geological logging, photography and future reference.
11.2Core Recovery
For the Maya and Aya drilling core recovery was measured for each drilling run at Aya’s core logging and sampling facility after the core was reconstructed within the core trays using depth blocks to identify individual drill runs. The recovered core length was measured and compared with the drilled interval to determine the percentage core recovery. Core loss and Rock Quality Designation (RQD) were recorded concurrently within the Project database as part of the geotechnical logging process. No documentation relating to core recovery or RQD measurements for the historical BRPM drilling programs was available for review by SRK.
Review of the Project database indicates that core recovery information is available for 879 modern diamond drillholes, comprising approximately 115,900 individual core runs. The recorded dataset represents approximately 346,133 m of drilled core, with a very good overall average core recovery of 98.3%. A small proportion of individual core runs record recoveries greater than 100%, which are interpreted to reflect minor measurement tolerances, reconstruction of broken core and local core expansion following drilling, and are not considered unusual for diamond drilling programs.
AYA GOLD & SILVER INC., BOUMADINE POLYMETALLIC PROJECT 60
The drill core observed in the core boxes during the SRK site visit appeared to exhibit generally very high core recovery within both the fresh mineralized and unmineralized zones. Slightly lower, although still good, recoveries were observed within weathered and faulted zones, which are consistent with the core recovery database. SRK also reviewed a representative selection of drill core photographs as part of this study, which supports this conclusion. A representative example of the core recovery is presented in Figure 11-2.
No information relating to the total sample recovery for the RC drillholes has been provided to SRK, other than that a split of the drilled samples is weighed (typically 4.7 kg). SRK recommends that, for any future RC drilling program, the total drilled interval sample weight is recorded to determine a theoretical sample recovery based on the logged lithology.
Average core recovery remained consistently high throughout the modern exploration programs, varying between approximately 97.2% and 98.9% between 2022 and 2026. Local reductions in core recovery occur within zones of intense faulting, weathering and fractured rock; however, SRK did not identify any systematic relationship between reduced core recovery and mineralization that would materially affect the geological interpretation or grade estimation.
Figure 11‑1 Histogram showing the core recovery data provided to SRK for review

Figure 11‑2 Image of BOU-DD26-817, taken during the SRK site visit
AYA GOLD & SILVER INC., BOUMADINE POLYMETALLIC PROJECT 61
11.3Geotechnical Logging
Geotechnical logging was completed on all modern diamond drillholes prior to geological logging and sampling. Parameters recorded within the Project database include core recovery, Rock Quality Designation (RQD), fracture frequency, fracture characteristics and other observations relating to rock quality and ground conditions. These data support the geological interpretation and provide a dataset for geotechnical and mining studies.
No documentation is available describing the geotechnical logging procedures undertaken by BRPM on the historical drillcore, there are also no records associated with the 2017 Maya drilling.
Review of the Project database indicates that the average recorded RQD is 85.1% (median 93.2%), indicating generally competent rock conditions across much of the Project. Lower RQD values are typically associated with zones of faulting, weathering and locally fractured ground.
The geotechnical data collection to be appropriate for the current stage of exploration and suitable for geological interpretation.
11.4Geological Logging
At the Aya core shed, drill core was laid out in a series of core boxes on logging tables (Figure 11‑3). The core logging is qualitative in nature whereas the sampling and results this gives is quantitative in nature.
Geological logging was completed on all modern DD following geotechnical logging and prior to sampling. Logging was undertaken by Company geologists using standardised digital logging templates and controlled geological coding schemes, with Aya/Maya geological supervisors reviewing each drillhole to ensure consistency between drilling campaigns and adherence to the Company's logging standards. The geological database was developed and maintained using GeoticLog and subsequently exported for geological modelling and grade estimation.
Historical geological logs are available for a proportion of the BRPM drillholes; however, no documentation describing the historical geological logging procedures, coding schemes, logging standards or quality control procedures was available for review by SRK. As part of its data verification program, Aya relogged the available drill core from the 2018 to 2022 drilling programs during 2023 and also re-sampled selected intervals of the available drill core for verification purposes, as described in Section 12.4.
Geological logging included the systematic recording of lithology, weathering, alteration, mineralization, veining, oxidation, structure and other geological observations considered relevant to the interpretation of the deposit. Lithological contacts, mineralized intervals and major geological features were identified during logging and subsequently used to define the sampling intervals.
Aya provided SRK with its legends and codes associated with the geological logging, for the purposes of the 2026 MRE. It should be noted that massive sulphide (MS) is distinguished by approximately >70% logged visible sulphide, whilst semi massive sulphide is <70% and >30% logged visible sulphide. Oxidised mineralization (gossan) is denoted by A3 code.
During geological logging, the oriented core was used to collect structural data, such as the orientation of veins, faults, fractures, lithological contacts, foliations and other structural features (azimuth and dip). Each structural measurement is assigned an orientation confidence rating (0 to 4). This confidence ranking enables lower-quality orientation measurements to be identified and, where appropriate, excluded from structural interpretation and analysis.
AYA GOLD & SILVER INC., BOUMADINE POLYMETALLIC PROJECT 62
Geological observations and structural measurements formed an important component of the interpretation of the volcanic stratigraphy, synvolcanic fault architecture and controls on mineralization, and are subsequently incorporated into the geological interpretation supporting the 2026 MRE.
In addition to diamond drilling, geological logging was also completed on RC drillholes. Drill cuttings were collected from the cyclone and representative material from each sample interval was washed and placed into labelled plastic chip trays, with each compartment representing a discrete interval, typically 1 m in length. Company geologists examined the washed drill chips and systematically recorded lithology, weathering, oxidation, alteration, mineralization and other geological observations using the same controlled geological coding scheme adopted for the DD program. The chip trays were retained at the Project site as a permanent geological record and were available for subsequent review and validation.
During the site visit, SRK observed the DD geological logging procedures undertaken by the Company's geological staff and reviewed representative drill core and RC chip trays from a selection of modern drilling. SRK considers the geological logging procedures, geological coding schemes and quality of the geological database to be appropriate for the style of mineralization and sufficient to support the geological interpretation and grade estimation presented in this report.

Figure 11‑3 Aya core logging facility
AYA GOLD & SILVER INC., BOUMADINE POLYMETALLIC PROJECT 63
11.5Photography
DD core was systematically photographed following geological and geotechnical logging and after sample intervals had been marked, but prior to cutting and sampling. During the site visit, the Aya geological team advised SRK that each section of core is photographed twice: initially in its natural wet condition immediately following logging and subsequently after the core has dried. This procedure provides a permanent visual record of both the wet and dry appearance of the drill core and supports subsequent geological review and interpretation.
Drill core photographs were acquired using the Imago Capture software. Images were captured with up to three core boxes positioned on the photography table. Immediately following image acquisition, the photographs are reviewed within the software to ensure image quality and completeness (Figure 11‑4). Where issues such as poor focus, lighting or image quality are identified, the photographs are retaken before the core proceeds to the cutting and sampling stage. Following quality verification, the photographs are processed within the Imago software.
At the time of SRK's review, the Imago photographic database contained drill core imagery for the 2024, 2025 and 2026 drilling programs. Aya has informed SRK that they hold core photographs taken in 2022 and 2023 and plan to upload these to Imago in the coming months.
During the SRK QP site visit, SRK reviewed the Company's drill core photography procedures and subsequently examined representative drill core photographs during the desktop phase of the study. SRK also used the core photographs during the modelling of the weathering domains. Currently, RC chip trays are not photographed by the Company, and no core photographs exist prior to 2022. SRK recommends that Aya photograph all available drill core and RC chip trays and incorporate these records into the Imago database to establish a comprehensive digital photographic archive for the Project.
AYA GOLD & SILVER INC., BOUMADINE POLYMETALLIC PROJECT 64
Figure 11‑4 Aya core photography stand, with inlay image of drillcore image in Imago Capture software
11.6Density and Moisture Measurements
Density measurements were routinely completed on modern diamond drill core following the completion of geological and geotechnical logging and prior to sampling. Density determinations were undertaken using the Archimedes water displacement method, with the resulting measurements recorded within the Project. This procedure has been routinely undertaken since 2018.
During the SRK site visit, the Aya geological team demonstrated the density determination procedures. Density measurements were undertaken in a dedicated enclosed room to minimize environmental influences on the weighing process (Figure 11‑5). Prior to commencing daily measurements, the electronic balance was calibrated using certified 200 g and 500 g reference weights to verify the accuracy of the instrument. The water was also regularly changed according to Aya. The drillcore is first dried in an oven at 105°C, the dry core (mass) and submerged core (mass) is then measured to calculate the bulk dry density. SRK notes that the drill core was not wrapped in plastic film or coated with paraffin wax prior to measurement. In the opinion of the
AYA GOLD & SILVER INC., BOUMADINE POLYMETALLIC PROJECT 65
SRK QP, the majority of the drill core appeared sufficiently competent that such treatment (wrapping of drillcore) does not appear to be warranted. However, for locally broken or highly fractured core, SRK recommends that Aya consider the use of plastic film or paraffin wax coating to minimize the potential effects of water ingress during density determination.
The frequency of density measurements varied according to the lithology encountered. Within waste rock, density measurements were generally completed at approximately 10 m intervals. As massive sulphide mineralization was approached, additional density measurements were completed immediately prior to entering the mineralized zone, with measurements subsequently undertaken at approximately 1 m intervals throughout the massive sulphide intervals. However, density measurements within disseminated or apparently weakly mineralized zones were completed at a lower frequency. SRK recommends that the frequency of density measurements within these disseminated mineralized intervals be reviewed to ensure they are adequately represented within the density dataset. This may require additional density measurements to be collected following receipt of the assay results or, where appropriate, by re-sampling archived drill core. Density measurements were recorded within the Project.
SRK notes that the Company has not undertaken routine moisture content determinations on drill core samples. Although moisture content data are not required for the 2026 MRE, they represent an important physical property for future mining and processing studies, particularly the forthcoming Feasibility Study (FS). SRK recommends that Aya undertake a representative moisture content sampling program using fresh drill core collected from across the Project and analyzed within one to two days of drilling to minimize the effects of moisture loss. The sampling program should include representative samples of the principal lithologies, weathering states and mineralization styles expected to be encountered during future mining operations.

Figure 11‑5 Aya density measurement station
AYA GOLD & SILVER INC., BOUMADINE POLYMETALLIC PROJECT 66
11.7Sampling
Following geological logging, drill core was marked for sampling by Company geologists. Sample intervals were selected to honour geological contacts, lithological boundaries and mineralization, with a nominal sample length of approximately 1.0 m. Sample lengths generally ranged between 0.5 m and 1.2 m depending on the geological characteristics encountered.
During the SRK site visit, the Company advised that sample intervals are generated within dedicated sampling spreadsheets external to the geological logging database. Each sample is assigned a unique sample identification number, together with a corresponding Laboratory Information Management System (LIMS) code and QR code to maintain sample traceability throughout the analytical process, the sample information is entered directly into the GeoticLog database.
During the SRK site visit, the QP observed that, following core cutting, samples were placed into heavy-duty plastic sample bags. In addition to the sample ticket and QR code, the Sample ID was also handwritten on the exterior of each sample bag, providing a secondary means of sample identification should the QR label become damaged, detached or unreadable (Figure 11‑6 and Figure 11‑7).
RC samples were collected at nominal 1 m intervals directly from the cyclone. The cyclone discharged into a splitter, which produced three sample streams simultaneously: (i) a representative sample submitted for laboratory analysis, (ii) a duplicate sample collected at a nominal frequency of one in every 25 routine samples, and (iii) the remaining bulk reject, which was collected in large bags and retained at the drill site. All routine samples were weighed at the drill rig by an Aya technician using a calibrated hanging scale prior to dispatch (average weight of 4.7 kg). Representative samples were subsequently submitted for geological logging, sample preparation and laboratory analysis in accordance with the Company's sampling procedures.
No detailed documentation describing the sampling procedures adopted during the historical BRPM drilling programs was available for review by SRK. Consequently, the sampling methodology described below relates to the modern Maya and Aya exploration programs.
Figure 11‑6 Active sampling of drillcore at Aya core processing facility
AYA GOLD & SILVER INC., BOUMADINE POLYMETALLIC PROJECT 67
Figure 11‑7 Sampled drillcore with the sample identification and individual QR code denoted on the bag
11.8Core Cutting and Drying
Following sample interval selection, diamond drill core was cut longitudinally using a diamond saw (Figure 11‑8). One half of the core was retained within the core boxes (Figure 11‑6) as a permanent geological record, whilst the remaining half was submitted for laboratory analysis Quarter-core samples were routinely collected from selected intervals for insertion into the Company's Quality Assurance and Quality Control (QA/QC) program as field duplicate samples.
Following cutting, the samples were placed into individually labelled plastic sample bags and transferred to the on-site Afrilab sample preparation facility, the samples typically weighed between 2-4 kg. Prior to sample preparation, samples (including RC samples) were dried in accordance with the laboratory's standard operating procedures to remove moisture.
No documentation describing the core cutting, sample selection or sample drying procedures adopted during the historical BRPM drilling programs was available for review by SRK.
AYA GOLD & SILVER INC., BOUMADINE POLYMETALLIC PROJECT 68
Figure 11‑8 Aya core saw facility
11.9Sample Preparation
Since 2024, sample preparation has been undertaken at Afrilab's dedicated sample preparation laboratory located at the Project site. Prior to 2024, sample preparation was undertaken at Afrilab's laboratory in Marrakech. SRK has been provided with and reviewed Afrilab's documented sample preparation protocols and procedures.
No documentation describing the sample preparation procedures applied during historical BRPM drilling programs was available for review by SRK.
During the SRK site visit, the sample preparation procedures were demonstrated by laboratory personnel. Samples were initially crushed using a jaw crusher to achieve a target particle size of approximately 85% passing 2 mm. Following crushing, approximately 200 g of material was automatically split for further preparation. The remaining coarse reject was bagged, labelled and retained on site for future reference.
To minimize the potential for cross-contamination, compressed air was used to clean the jaw crusher between samples. In addition, clean sandstone was periodically passed through the crusher, followed by a further compressed-air clean before processing the next sample.
The split sample was subsequently pulverized using a puck pulverizer to achieve a target grind size of approximately 85% passing 75 µm (Figure 11‑9). Routine samples were pulverized for approximately four minutes, whereas blank (sandstone) material was pulverized for approximately one minute. Between each
AYA GOLD & SILVER INC., BOUMADINE POLYMETALLIC PROJECT 69
sample and blank, the pulverizer was cleaned using compressed air and a brush to minimize the potential for sample carry-over.
During the SRK site visit, laboratory personnel advised that sample preparation quality is routinely monitored through sieve testing (crushing and pulverizing).
Following pulverization, each pulp sample was visually inspected before being packaged into individual clean plastic bag envelopes. Approximately five analytical batches (~25 samples including QA/QC samples comprise each batch) were subsequently combined into a larger shipment bag before being transported to the Afrilab analytical laboratory in Marrakech for analysis, accompanied by a sample dispatch sheet.

Figure 11‑9 Rocklabs sample crusher
AYA GOLD & SILVER INC., BOUMADINE POLYMETALLIC PROJECT 70
Figure 11‑10 Pulverized samples being prepared for shipment to Afrilab analytical laboratory in Marrakech
11.10Sample Analysis
For the Maya and Aya drilling, the Company contracted Afrilab analytical laboratory in Marrakech to conduct the chemical analysis. No documentation describing the analytical laboratories, analytical methods, digestion techniques, analytical finish, detection limits or quality control procedures used during the historical BRPM drilling programs was available for review by SRK.
The analytical certificates reviewed by SRK indicate that Afrilab is an ISO 9001-certified laboratory and holds Canadian Association for Laboratory Accreditation (CALA) accreditation.
Au was analyzed by 50 g fire assay with an atomic absorption spectrometry (AAS) finish (Afrilab method MO/ANA/001). Ag, Cu, Fe, Pb and Zn were analyzed following aqua regia digestion (Afrilab method MO/ANA/002) with an ICP-OES finish. Samples returning Cu, Fe, Pb or Zn grades greater than 1% were routinely re-analyzed by atomic absorption spectrometry (AAS) to provide accurate assays at higher concentrations. Ag was initially analyzed by ICP-OES; however, since 2022 samples returning Ag grades greater than or equal to 200 g/t were routinely re-analyzed by 50 g fire assay with a gravimetric finish to provide accurate assays for high-grade mineralization. Aya confirmed that the fire assay gravimetric method has an upper analytical limit of 100% Ag (pure silver) and 100 g/t for Au and lower detection limit of 0.05 g/t for Au.
Additional trace elements, including As, Mo, Sn and S were analyzed following aqua regia digestion with ICP analysis, though the amount of assay associated with these is variable. For instance only 92 S% assay are contained within the database compared to 163,822 As values and 329,370 Mo values. The analytical methods provided lower detection limits of 1 g/t Ag, 0.01% Cu, Fe, Pb and Zn. While the routine ICP-OES method has an upper analytical limit of 1% for Cu, Pb and Zn, above which samples are routinely re-analyzed by AAS (no upper detection limit provided by Aya).
AYA GOLD & SILVER INC., BOUMADINE POLYMETALLIC PROJECT 71
Upon review of the Afrilab analytical certificates, SRK noted that base metal analyses have been undertaken using an aqua regia digestion method since 2017, rather than the four-acid digestion method previously reported in Boumadine technical reports.
In addition, an independent umpire laboratories has been used, during the 2022 to 2024 drilling campaigns. Umpire analyses were completed by ALS Seville, Spain, while from late 2024 onwards this work transitioned to ALS Morocco (Zgounder) following commissioning of this laboratory. In addition, independent verification samples were submitted to Actlabs (Ancaster, Canada) by P&E during its 2024 due diligence program as part of an external verification exercise.
11.11Sample Security
Throughout the exploration programs, drill core remained under the control of Company and drilling contractor personnel from the drill rig to Ayas secure core logging facility. Following logging, photography and sampling, prepared samples were securely transported to the on-site Afrilab sample preparation laboratory. Following sample preparation, analytical pulps were packaged into sealed shipment bags and transported to the Afrilab analytical laboratory in Marrakech for analysis. Coarse reject material was retained, bagged and stored at the Project site for future reference.
No documentation describing the chain of custody or sample security procedures employed during the historical BRPM drilling programs was available for review by SRK.
The use of unique sample identification numbers, QR codes and the Company's Laboratory Information Management System (LIMS) provides traceability throughout the sampling and analytical process.
11.12SRK Comments
SRK reviewed the Company's geological logging, sampling, sample preparation, sample security and analytical procedures during the site visit and considers these to be appropriate for the style of mineralization and that they are generally aligned with industry-standard practices, and adequate for the purposes of the 2026 MRE. The dedicated on-site sample preparation facility and routine equipment cleaning procedures provide additional confidence in the quality and integrity of the prepared samples submitted for laboratory analysis.
The procedures used for logging, sampling, sample preparation, analytical testing and sample security during historical BRPM drilling programs are not adequately documented. In addition, limited information is available to SRK regarding the drilling, logging, sampling, sample preparation and QA/QC procedures employed during the 2017 Maya drilling program. Furthermore, the drill core from the 14 Maya drillholes completed during 2017 could not be located within Aya's core storage facilities and was therefore unavailable for verification by relogging or re-sampling.
Although historical and 2017 drilling data is available within the Project database, the absence of documented QA/QC procedures, together with the lack of archived drill core and supporting records available for independent verification, limits confidence in the historical analytical data. Historical and 2017 drillholes are generally surrounded by modern Maya and Aya drillholes, which largely confirm the geometry and tenor of the mineralization, though there is some uncertainty over the spatial position of the historical drilling as this data has been translated into a UTM system from the historical mine grid.
SRK recommends that Aya continue to maintain and periodically review its sampling and QA/QC procedures as exploration progresses. In addition, SRK recommends that representative moisture content measurements be undertaken on fresh drill core during future drilling programs to support the forthcoming FS. Samples
AYA GOLD & SILVER INC., BOUMADINE POLYMETALLIC PROJECT 72
selected for moisture determination should be representative of the principal lithologies, weathering states and mineralization styles expected to be encountered during mining operations.
12.0DATA VERIFICATION
12.1Introduction
SRK undertook a program of independent data verification to assess the suitability of the geological, drilling, sampling, analytical and survey data supporting the MRE. The verification program included a site visit; review of the drilling and assay databases; assessment of the QA/QC data and Aya's drill core re-sampling program; verification of selected drillhole collar locations; assessment of historical underground mine plans and depletion surveys; review of drill core orientation procedures; and comparison of the geological interpretations against the available drilling, surface and underground geological information.
The verification program was designed to provide confidence that the Project database is suitable for use in a MRE. Particular attention was given to the quality and reliability of the modern Maya and Aya drilling database, which forms the basis of the 2026 MRE. Historical BRPM drilling and underground information were also reviewed where appropriate.
In addition, SRK has reviewed the findings and recommendations presented within previous technical reports where relevant to the current commission but it has not relied solely upon the conclusions of previous consultants in preparing the 2026 MRE.
12.2SRK Verification
SRK completed both desktop and field-based verification of the geological, drilling, survey and analytical information supplied by the Company. Verification activities included review of the Project database, inspection of drill core, observation of logging and sampling procedures (including drillhole logs), verification of selected drillhole collar locations, comparison of historical underground workings with current topography and review of the core orientation methodology.
The onsite verification work was completed by Mr Guy Dishaw, P.Geo., QP, during the site visit, together with subsequent desktop reviews undertaken by the SRK project team.
12.2.1Site visit
Guy Dishaw (QP) completed a site visit to the Boumadine Project between 23 and 28 April 2026. The purpose of the visit was to verify the geological setting, observe current exploration practices and assess the quality of the geological, drilling, sampling and analytical information supporting the Mineral Resource Estimate (MRE).
During the site visit, the Qualified Person:
•observed active diamond drilling operations and reviewed drilling practices;
•reviewed the drill core handling, reconstruction, orientation, geotechnical logging, geological logging and sampling procedures;
•observed the density determination and sample preparation procedures (this was limited);
•inspected representative diamond drill core and RC chip trays;
•independently verified the locations of 14 selected drillhole collar locations (Figure 12‑1);
AYA GOLD & SILVER INC., BOUMADINE POLYMETALLIC PROJECT 73
•undertook high-level confirmatory geological mapping of representative surface exposures, including gossanous outcrops and historical artisanal mining excavations, to confirm the geological interpretation and styles of mineralization and orientation of structures (Figure 12‑2).
•compared the geological interpretation (Aya geological logs) against drill core observations and surface exposures;
•surveyed the locations of selected historical mining infrastructure, including shafts and adits, using a handheld Global Positioning System (GPS) receiver to assess the accuracy of the georeferenced historical mine plans;
•reviewed the core photography procedures and the digital photographic archive;
•inspected the on-site Afrilab sample preparation facility at Boumadine and observed the sample preparation workflow;
•undertook a high-level inspection of the Afrilab assay laboratory in Marrakech and observed the laboratory workflow.
•discussed the geological interpretation, exploration programs and data management procedures with Company personnel.
During the collar verification component of the SRK site visit, only one of the 14 selected historical drillhole collars could not be directly located due to the absence of an identifiable collar marker. However, field evidence, including the presence of a drill sump and broken concrete, provided some confidence in the recorded collar location. The remaining selected drillhole collars were located and verified in the field by SRK using a handheld GPS. Based on the results of the collar verification program, SRK considers the drillhole collar locations to be sufficiently accurate for the purposes of geological modelling and the 2026 MRE.
The high-level geological mapping undertaken during the SRK site visit provided an independent assessment of the geological framework. The observed lithologies, alteration assemblages, gossan development, surface structural features, including those exposed within artisanal workings, and styles of mineralization were consistent with the geological interpretation adopted for the 2026 MRE and with the geological logs selected for review. Structural observations made at surface were also consistent with structural measurements obtained from oriented drill core and with the interpreted orientations of the principal mineralized structures.
Overall, SRK considers that the geological and structural observations made during the site visit are consistent with the information contained within the Project database.
AYA GOLD & SILVER INC., BOUMADINE POLYMETALLIC PROJECT 74

Figure 12‑1 Drillhole BOU-DD95-404 verified by SRK in the field
AYA GOLD & SILVER INC., BOUMADINE POLYMETALLIC PROJECT 75
Figure 12‑2 Gossanous outcrop observed at surface during the high level geological mapping undertaken by SRK
12.2.2Twin drillhole Comparison
No twinned drillholes have been completed at Boumadine, however a few drillholes were terminated due extreme deviation and a later hole was redrilled covering a similar area, however in all circumstances the terminated drillholes never intersection modelled mineralization (included in the 2026 MRE wireframes). There are also a few sections of drillholes which occur within close proximity to one another (drillholes drilled at different collar sites with different azimuth and dips).
SRK recommends that twinned drillholes be completed at several representative locations across the deposit. Where practicable, the program should include twins of each drilling method used at the Project (MP, RC and DD) by DD. The twin DD drillholes should be used to assess the precision and representativeness of the different drilling methods through visual and statistical comparisons. The additional closely spaced sample pairs would also assist in quantifying short-scale grade variability (nugget effect) and support geostatistical analysis (improve confidence in the interpretation of short-range grade continuity).
12.2.3Verification of underground depletion as-builts
The historical underground workings were captured in a local Mine grid; the supporting mine plans and associated as-builts were transformed from the historical local mine grid into the Project UTM coordinate system by GoldMinds Geoservices Inc.
SRK reviewed a selection of the georeferenced historical mine plans used by GoldMinds in the construction of the depletion meshes and considers that these provide an appropriate representation of the overall historical mining geometry for geological interpretation and depletion purposes. However, numerous local positional discrepancies remain evident between some of the georeferenced underground workings and the mineralization wireframes interpreted as part of the 2026 MRE.
AYA GOLD & SILVER INC., BOUMADINE POLYMETALLIC PROJECT 76
As part of the verification process, SRK compared the locations of selected historical shafts, adits and other surface mining infrastructure shown on the georeferenced mine plans with their observed positions in the field using a handheld GPS receiver. These observations were undertaken in conjunction with the geological mapping program and provided an independent assessment of the positional accuracy of the georeferenced historical mine plans and associated depletion surveys. The review indicated that the overall georeferencing is suitable for the purposes of geological interpretation and depletion, with the locations of the selected surface features generally within the expected positional accuracy of the handheld GPS receiver.
However, local positional discrepancies remain between some of the georeferenced historical mine plans and as-builts in relation to the modern drilling database used to interpret the mineralization wireframes. Consequently, the historical underground information, including the interpreted orientations and extents of the stopes, can only be used as a guide for geological modelling, with greater reliance placed on the Aya drilling database where inconsistencies between the datasets were identified. Additional depletion adjustments were therefore required to account for mineralization interpreted to have been historically mined but which does not spatially coincide with the available depletion meshes, as discussed in Section 14.13.
12.2.4Inspection of Afrilabs Analytical laboratory
As part of the data verification program, SRK also completed a high-level inspection of the Afrilab sample analytical laboratory in Marrakech on the 28 April 2026. The purpose of the visit was to gain an understanding of the laboratory layout, sample handling procedures and analytical facilities used for the Project. During the visit, SRK observed that the laboratory was clean, well-organised and logically laid out, with samples stored in a neat and clearly labelled manner throughout the analytical workflow. The QP viewed the fire assay furnaces and ICP analytical machines (Figure 12‑3) and discussed the laboratory procedures, analytical methods and quality control protocols with the laboratory manager. Although the inspection did not constitute a formal laboratory audit, no issues were identified that would materially affect confidence in the analytical results reported for the Project.

Figure 12‑3 Fire assay furnaces (A) and the inductively coupled plasma (ICP) analytical instrument (B) at the Afrilab laboratory, Marrakech, Morocco.
12.2.5Verification of sample database
SRK completed a phase of data validation on the digital sample data supplied by the Company, which included the following:
•search for sample overlaps, duplicate or absent samples;
AYA GOLD & SILVER INC., BOUMADINE POLYMETALLIC PROJECT 77
•checks for anomalous assay results;
•checks for incorrect or irregular survey results;
•search for non-sampled drillhole intervals within the mineralized zones; and
•Review of the exported database and cross-check against a selection of the 2025 Afrilabs assay certificates, comprising 485 Au samples, 778 Ag samples, and 992 Cu, Fe, Pb, and Zn samples.
SRK did not identify any material issues during the data verification process. However, several minor database issues were identified, including missing drillhole type codes and inconsistent formatting of analytical detection limits (e.g. spaces between the "<" and ">" symbols and reported values), as well as 6 samples reporting Ag at 200 g/t using ICP, these all relate to tailings drilling which is does not form part of this MRE. These issues were communicated to Aya and were corrected by Aya.
12.3Verification by the Company and External Consultants
In addition to the independent verification completed by SRK, the Company has implemented a series of internal verification procedures throughout the exploration programs to ensure the quality and integrity of the Project database. These procedures include geological supervision (Aya personnel) of drillhole logging, routine validation of geological and sampling information prior to incorporation into the Project database, routine review of QA/QC performance, and ongoing reconciliation of geological interpretations against newly acquired drilling data.
As part of the redevelopment of the Boumadine Project, Maya commissioned GOULEX, a French exploration consulting company, in 2014 to compile and validate the available historical exploration and mining data. The scope of work included the verification and surveying of historical drillhole collars, shafts and tailings facilities using differential GPS (DGPS), with all surveyed coordinates recorded in the Project UTM coordinate system. The historical underground mine plans and associated underground drilling data were subsequently transformed from the historical local mine grid to the Project UTM coordinate system by GoldMinds Geoservices Inc., providing the basis for incorporation of the historical information into the modern geological database.
The Company has also commissioned a number of independent technical reviews of the Project during successive exploration programs. Most notably, P&E Mining Consultants Inc. completed independent reviews of the geological database, sampling procedures, analytical QA/QC program and MRE, as documented in the 2024 NI 43-101 Technical Report. The P&E study also included an independent QP site visit, as well as the collection and submission of independent verification samples for laboratory analysis at Actlabs in Ancaster, Canada.
The Boumadine Project has also been the subject of additional independent technical studies, including reviews of the geological setting, geological mapping and other supporting technical information relevant to the 2026 MRE.
AYA GOLD & SILVER INC., BOUMADINE POLYMETALLIC PROJECT 78
12.4Aya Drillcore re-Sampling
All available drill core from the 2018 to 2021 drilling programs was relogged by Aya during 2023, and selected intervals were resampled during the same time period. The resampled intervals were derived from quarter-core opposed to the half-core samples (original sample). Drill core from the earlier programs (2017 Maya and BRPM) could not be verified through resampling or relogging, as the core could not be located. The resampling program was undertaken due to the lack of accompanying QA/QC samples associated with the original assays, both in terms of the types of QA/QC samples inserted and their frequency of insertion. The resampled core was submitted for analysis together with accompanying QA/QC samples (CRM’s, duplicates, blanks), see Section 12.5. Aya informed SRK that, where reassaying and relogging were completed for the post-2018 drillholes, the reassayed and relogging data were used in place of the original assay and logging data within the Project database. Aya also informed SRK that in some cases the resampling intervals did not match the original sample intervals.
SRK was provided with Aya's comparative statistics Excel spreadsheet, which compares the original assay results with the corresponding results from the resampled drill core from 10 drillholes drilled between 2018-2020 (Maya drilling). It should be noted that SRK did not independently review the resampling intervals during the site visit and has not observed the resampling program. Figure 12‑4 to Figure 12‑7 are scatter plots for showing the resampling results for Au, Ag, Fe and Pb.
A total of 207 intervals contained paired original and reassayed Au results, while 170 samples contained paired Ag results, 173 contained paired Zn results, and 72 contained paired Fe and Pb results, other analytes were also analyzed but not compared by Aya graphically.
The samples were selected across a range of grades from both visually identified mineralization and from the surrounding lower grade and waste units. Aya compared the original and reassayed results using scatter plots to provide a visual assessment of the correlation between the two datasets. Aya and the previous consultant, P&E, concluded that the drill core resampling results were of sufficient quality, with minimal bias observed and that these could be used to support an MRE.
SRK review of Aya's comparative statistics spreadsheet and notes that the total number of paired samples available for verification is relatively low for a comprehensive assessment of the original assay data. However, the number of samples is considered sufficient to identify any material bias between the original and reassayed datasets. Overall, the scatter plots show greater variability for Au compared with Ag, Fe and Pb (Figure 12‑4 to Figure 12‑7). Several anomalous results were identified, including one reassayed sample that returned 61.44% Pb compared with an original assay result of 0.06% Pb (note this is not included in Figure 12‑7 due to scaling of Y axis). The same sample returned a reassayed Ag grade of 2,176 g/t compared with an original grade of 16 g/t, with similar differences also observed for the other analytes. The reason for these differences is unknown, although they may reflect differences between the original and resampled core interval and/or less likely the heterogeneous nature of the mineralization. SRK recommends that Aya investigate the reason for these discrepancies with the Ag assay values.
In addition, 19 samples returned reassayed Fe grades ranging from 3.33% to 25.38%, whereas the corresponding original samples all reported Fe values of 0.5%. The reason for these differences is unknown and again this may reflect differences between the original and resampled core interval and/or the heterogeneous nature of the mineralization. SRK recommends that Aya investigate the reason for these discrepancies with the Fe assays.
AYA GOLD & SILVER INC., BOUMADINE POLYMETALLIC PROJECT 79
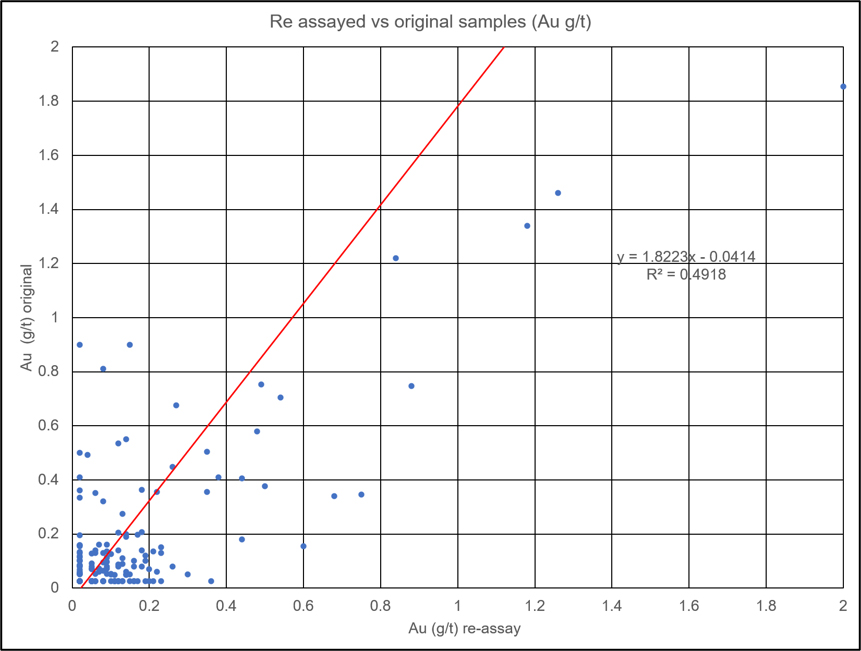
Figure 12‑4 Scatter plot showing Aya resampled drillcore (Au g/t)
Figure 12‑5 Scatter plot showing Aya resampled drillcore (Ag g/t)
AYA GOLD & SILVER INC., BOUMADINE POLYMETALLIC PROJECT 80
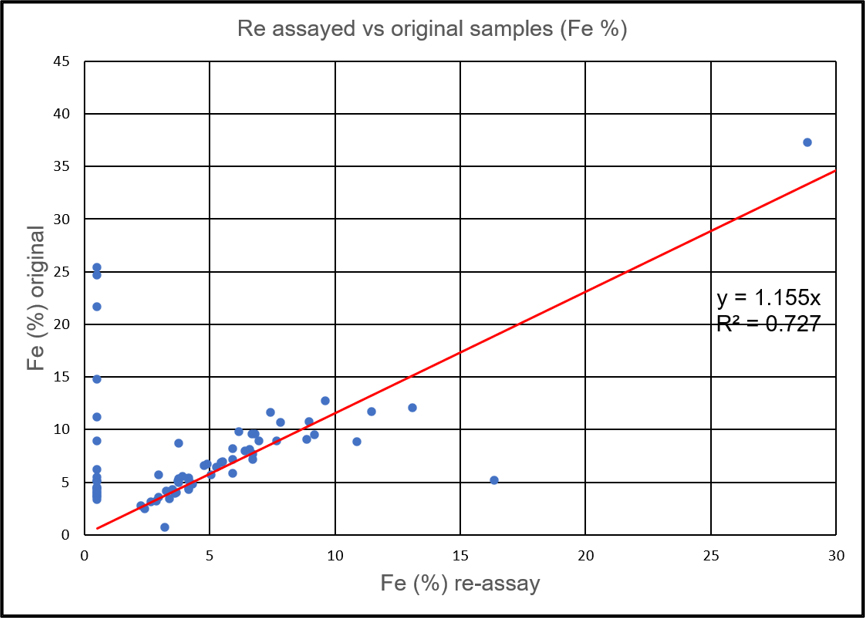
Figure 12‑6 Scatter plot showing Aya resampled drillcore (Fe %)Figure 12‑7 Scatter plot showing Aya resampled drillcore (Pb%)
Overall, the Pb data show reasonable correlation, although greater variability is observed at elevated Pb grades, typically above 1%. The Fe data show good correlation across the assayed grade range, excluding the 19 samples that returned reassayed Fe grades significantly higher than the corresponding original values. The Ag data also shows good correlation, with most samples returning grades below 100 g/t, excluding the anomalous sample discussed above. The Au data show greater scatter but remain within acceptable tolerances, with the grades encountered typically below 0.6 g/t. For the analytes reviewed by SRK, there
AYA GOLD & SILVER INC., BOUMADINE POLYMETALLIC PROJECT 81
appears to be a slight overall bias towards higher grades in the reassayed results. These biases are not considered material to the use of the data in the current study. Should further drill core resampling be undertaken, SRK recommends that the resampling intervals correspond as closely as practicable to the original sample intervals to improve the comparability of the datasets.
Overall, SRK considers the correlation between the original and reassayed datasets to be within acceptable tolerances, taking into consideration the different sample types (quarter core versus half core), potential different sample intervals, the relatively limited number of paired samples and the nature of the mineralization. SRK recommends that Aya investigate the reasons for the significant differences associated with the 19 Fe sample pairs discussed above, together with the anomalous Pb and Ag results. The biases observed between the datasets are not considered material to the 2026 MRE, and the overall findings are consistent with the conclusions previously reached by Aya and P&E (suitable for inclusion in a MRE).
AYA GOLD & SILVER INC., BOUMADINE POLYMETALLIC PROJECT 82
12.5Quality Assurance and Quality Control (QA/QC) Analysis
12.5.1Introduction
QA/QC procedures are implemented in modern exploration programs to assess the accuracy and precision of the sampling process and to check for bias and calibration of the sampling and analysis procedures. The accuracy is a measure of the sample bias and the precision, its repeatability. Poor accuracy can often be attributed to the instrument calibration, and poor analytical techniques. Whereas poor precision is often due to sampling or preparation procedures. The accuracy and precision of any sampling program can be monitored by a series of checks which may include, but are not limited to, the insertion of:
•Blank samples: Typically, these samples have a very low (known) grade of the elements of interest and are used to assess contamination between samples in laboratories.
•Certified Reference Material (CRM): are material where the grade(s) of the material has been determined by multiple laboratories by round-robin analysis and have an accompanying certificate.
•Duplicate samples including:
•Field duplicates – in core drilling, this typically represents a second sample from the same interval, typically these are quarter core samples collected from the retained half-core. These duplicates are used to test the effectiveness of the sampling method.
•Coarse duplicate – sample prepared from the reject coarse material created during sample preparation. These samples are used to check the homogeneity and effectiveness of the sample crushing and splitting stage.
•Pulp duplicate – sample prepared from the reject pulverized material created during sample preparation. These samples are used to check the homogeneity and effectiveness of the sample pulverization stage.
•Umpire Duplicate – re-analysis of the same sample (typically pulp) using a third-party laboratory. These are used to check for issues within the laboratory or analytical equipment which may introduce bias.
It should be noted that the blank and CRM datasets provided by Aya included analytical results for Au, Ag, Cu, Pb, Zn and a range of additional multi-element analyses. In contrast, the duplicate datasets supplied to SRK contained results for only Au, Ag and Mo. Consequently, SRK's assessment of duplicate sample precision was limited to these elements, other than Mo which has not been considered in SRK’s QAQC review. For completeness, SRK recommends that Aya include the full suite of analyzed elements, though as a minimum Cu, Pb and Zn should be included in the duplicate QA/QC database prior to the next MRE update. The insertion rates presented by SRK below are based on the number of Au samples associated with the QA/QC and assay database, which is biased by the resampling. Aya informed SRK that for a batch of 25 samples: one certified reference material (CRM), one blank and one field duplicate is typically inserted into the sample stream. Coarse duplicates and umpire samples are also analyzed, though they are fewer in number.
As noted above, all historical drill core from the 2018 to 2021 drilling programs was relogged and resampled with QA/QC samples by Aya during 2023, whilst the previous drilling (2017 Maya and historical BRPM) was not able to be verified through resampling. The 2018 Maya drilling program comprises the earliest drilling incorporated into the 2026 MRE and was either completed under, or subsequently resampled using, Aya modern sampling and QA/QC protocols. Consequently, these data are considered directly comparable with the subsequent Aya drilling programs and have been assessed as part of the current QA/QC review.
SRK did not review the internal laboratory QA/QC samples as part of this study. Instead, SRK's review focused on the Company's own QA/QC program.
AYA GOLD & SILVER INC., BOUMADINE POLYMETALLIC PROJECT 83
12.5.2Pre 2018 QA/QC
The limited drilling completed by Maya during 2017 predates the implementation of the current QA/QC program. The original drill core from the 2017 Maya program and the historical BRPM drilling programs could not be located during the current study, and the Company advised SRK that little to no routine QA/QC data are associated with the original analytical results. As the 2017 Maya and historical BRPM drillholes were excluded from the 2026 MRE, the associated analytical data have not been included in SRK's QA/QC assessment presented below. This approach is consistent with that adopted in previous studies.
12.5.3Blanks
Blank samples were routinely inserted into the sample stream throughout the modern exploration programs by Aya technicians and geologists prior to sample preparation, to monitor potential contamination during sample preparation and laboratory analysis. Blank samples were inserted at an approximate rate of 4.5%. In total, 17,206 blank samples are recorded in the QA/QC database for the period from 2018 to 2026.
The Company utilized two types of blank material. The primary blank material comprised local sandstone (labelled as Gris) and was included in all sample streams between 2018 and 2026. A second blank material comprised concrete, which was also periodically inserted into the sample stream between 2018 and 2022. Neither of the blank materials used by the Company has been independently certified.
SRK reviewed the analytical performance of the blank samples for Au, Ag, Cu, Pb and Zn. The majority of blank samples returned assay values at, or close to, the respective analytical lower detection limits, indicating that contamination during sample preparation and laboratory analysis is generally well controlled and there no evidence of systematic bias (Figure 12‑8).
Occasional isolated elevated values were identified; however, these occurrences were infrequent and did not indicate systematic contamination within the analytical program.
Although the analytical performance of the blank samples is considered satisfactory and raise no QA/QC concerns, SRK recommends that Aya consider introducing a commercially certified blank material with documented concentrations for the principal elements of interest, or alternatively undertake a round robin program on the locally sourced sandstone blank to certify this.
AYA GOLD & SILVER INC., BOUMADINE POLYMETALLIC PROJECT 84
Figure 12‑8 Blank performance between 2018 and 2026 (A= Au, B = Ag, C= Cu, D= Pb and E = Zn)
AYA GOLD & SILVER INC., BOUMADINE POLYMETALLIC PROJECT 85
12.5.4Certified reference materials
CRM’s sourced from OREAS were routinely inserted into the sample stream throughout the modern exploration programs (including the resampling program) to monitor the analytical accuracy and precision of the primary laboratory across a range of grades and material types.
Review of the CRM database indicates that Aya has utilized 31 different certified reference materials throughout the modern exploration programs. Collectively, the CRM suite provides reasonable grade coverage for the principal analytes of economic interest, (Au, Ag, Cu, Pb and Zn), encompassing both low-grade, medium-grade and high-grade mineralization expected to be encountered at the Project. Several of the CRMs were specifically developed for monitoring either precious metals (Au and Ag) or base metals and Ag and, consequently, do not contain certified values for all analytes or contain certified concentrations below the analytical reporting limits or above the grade encountered in the drilling database. Of the 31 CRMs reviewed by SRK, 11 are not certified for Au, one for Ag, and one for Zn.
Where certified values were unavailable, or where certified concentrations were below the analytical detection limits, SRK excluded those analytes from its assessment. Sufficient alternative CRMs containing appropriate certified concentrations are available to adequately assess laboratory performance across the expected grade ranges.
SRK assessed the analytical performance of the CRMs by comparing the reported assay values against the certified values and associated standard deviations supplied by OREAS for the appropriate digestion method. Results were considered acceptable where the reported assay value fell within ±2 standard deviations (SD) of the certified value, whilst results falling outside ±3 SD were considered failures requiring further investigation.
SRK completed an initial review of the CRM database supplied by Aya, which identified numerous instances where CRM sample IDs had been incorrectly assigned (mislabelled) or swapped within the database. The majority of these involved similarly named standards, such as OREAS 353 and OREAS 353B. These discrepancies were communicated to Aya during the review process and, at the time of preparing this report, the majority of the identified issues had been corrected and are therefore not presented in the figures below. A small number of sample swaps still remain in the database such as OREAS 234B and OREAS 236, these are either from the mislabelling of original samples or from samples being incorrectly assigned from other CRM’s or QA/QC sample types, SRK recommends Aya investigate these and attempt to resolve them if possible.
For Au, SRK used the certified 50 g fire assay values and associated standard deviations provided by OREAS. For Ag, SRK used the aqua regia digestion certified values and associated standard deviations for CRMs with certified Ag concentrations below 200 g/t, consistent with the routine analytical method employed by Afrilab. For CRMs with certified Ag concentrations greater than 200 g/t, SRK used the fire assay certified values and associated standard deviations, reflecting the ore-grade analytical procedure adopted by Aya. For Cu, Zn and Pb, SRK used the certified values and associated standard deviations for aqua regia digestion, where available. SRK notes that not all CRMs used by Aya are certified for aqua regia digestion for Ag <200 g/t or the base metals (Cu, Pb and Zn %), with some instead certified using other digestion methods, typically four-acid digestion. Where certified values for aqua regia digestion were not available but certified values for four-acid digestion were available, SRK assigned a lower level of confidence to the assessment of CRM performance, as the certified values are not directly comparable with the aqua regia digestion method employed by Afrilab. Nevertheless, no material issues were identified in the performance of these CRMs based on comparison with the four-acid certified values.
The CRMs that do not have certified values for fire assay analysis of Au and/or Ag (for Ag concentrations above 200 g/t), or for the base metals (Cu, Pb and Zn) using aqua regia digestion, include OREAS 100A (last inserted into the sample stream in June 2023), OREAS 354 and OREAS 994. SRK recommends that these CRMs are no longer inserted into the sample stream, as other CRMs certified for the applicable analytical methods adequately cover the typical grade ranges encountered at the Project. The exclusion of these CRMs is not considered material to the outcome of the QA/QC review. Furthermore, no material issues were
AYA GOLD & SILVER INC., BOUMADINE POLYMETALLIC PROJECT 86
identified in the Cu, Pb and Zn results for OREAS 354 and OREAS 994 when assessed against the available certified values, other than a small number of apparent sample swaps or mislabelling issues.
Overall, the CRM results demonstrate acceptable analytical accuracy for the principal elements of economic interest. The vast majority of analyses fall within the expected control limits, with only a limited number exceeding the ±3 SD failure limits. A number of these failures are interpreted to relate to historical CRM sample ID assignment errors. For example, the Au results for OREAS 234B suggest that several samples may have been incorrectly assigned and should instead correspond to OREAS 236. The certified base metal concentrations for this CRM are below the Afrilab reporting limits.
Several of the lower-grade CRMs exhibit comparatively poorer performance, with results falling outside the ±3 SD control limits. These CRMs generally contain analyte concentrations close to, or below, Afrilab lower detection limits, where analytical precision is expected to decrease. Although these CRMs locally exceed the QA/QC control limits, the absolute analytical differences are small and are not considered material to the assessment of laboratory performance or the 2026 MRE. Furthermore, analytical performance improves at higher analyte concentrations, providing confidence in the laboratory's performance across the grade ranges of principal economic interest.
For Pb, SRK notes that OREAS 353, is certified for a classical wet chemistry digest, and has returned a number of failures during 2022 and 2023. However, this CRM does not have a certified Pb value based on aqua regia digestion and is therefore not directly comparable with the aqua regia digestion method employed by Afrilab. Furthermore, the certified Pb concentration of 61.26% is approximately twice the maximum Pb grade contained within the Project assay database and is therefore not representative of the grades typically encountered during routine exploration or within the MRE dataset. Other Pb CRMs certified using aqua regia digestion, which cover grade ranges more representative of the Project mineralization, demonstrate acceptable analytical performance. In addition, OREAS 353 does not appear to have been routinely inserted into the sample stream after 2024.
SRK also identified two Zn CRM results reporting values greater than 100% (123% and 1299%). These values are considered anomalous and are likely to represent transcription or database errors. SRK recommends that Aya investigate and correct these records.
SRK has presented multi-CRM plots below (with rescaled y axis) in Figure 12‑9 to Figure 12‑13, which correspond to dates between 2022 to 2026, though all CRM plots are included in appendix A.
Overall, SRK considers the CRM program to demonstrate acceptable analytical accuracy and precision throughout the modern exploration programs. Following correction of the identified CRM sample ID discrepancies, no material issues were identified that would adversely affect confidence in the analytical database or the 2026 MRE.
AYA GOLD & SILVER INC., BOUMADINE POLYMETALLIC PROJECT 87

Figure 12‑9 Ag multi CRM plots (A = full range, B = rescaled Y axis)
AYA GOLD & SILVER INC., BOUMADINE POLYMETALLIC PROJECT 88

Figure 12‑10 Au multi CRM plots (A = full range, B = rescaled Y axis)
AYA GOLD & SILVER INC., BOUMADINE POLYMETALLIC PROJECT 89
 Figure 12‑11 Cu multi CRM plots (A = full range, B = rescaled Y axis)
AYA GOLD & SILVER INC., BOUMADINE POLYMETALLIC PROJECT 90

Figure 12‑12 Pb multi CRM plots (A = full range, B = rescaled Y axis)
AYA GOLD & SILVER INC., BOUMADINE POLYMETALLIC PROJECT 91
Figure 12‑13 Zn multi CRM plots (A = full range with sample reporting 1299% Zn omitted, B = rescaled Y axis)
12.5.5Duplicates
Duplicate samples are intended to assess the repeatability of the analytical results and provide a measure of the precision associated with the sampling, sample preparation and analytical procedures. Comparison of the different duplicate sample types can also be used to identify potential issues within the sample preparation workflow, including crushing, splitting and pulverization.
SRK notes that Aya does not routinely include pulp duplicate samples within its QA/QC program, instead it typically includes field and coarse rejects within the sample stream. SRK recommends that pulp duplicates be incorporated into future QA/QC programs, as they provide an additional measure of the homogeneity of the pulverized sample and the effectiveness of the crushing and pulverization stages. Field duplicates typically exhibit greater variability than coarse reject or pulp duplicates because they incorporate the additional
AYA GOLD & SILVER INC., BOUMADINE POLYMETALLIC PROJECT 92
variability associated with sample collection. Consequently, pulp duplicates can provide a more sensitive assessment of laboratory precision and sample preparation performance.
SRK acknowledges that the Company's umpire laboratory program involves the re-analysis of prepared pulp samples and, therefore, provides some information on pulp homogeneity and analytical repeatability. However, the primary purpose of umpire samples is to assess analytical accuracy and identify potential bias between laboratories, rather than to routinely monitor the precision of the primary laboratory's sample preparation procedures.
SRK identified 38 duplicate sample pairs for which the duplicate sample has no reported Au assay (blank entry in the database), despite the corresponding original sample having a reported Au assay. This issue was not observed for the Ag duplicate dataset. SRK recommends that Aya investigate these records and or provide an explanation on this.
SRK also identified a number of Au and Ag duplicate pairs where assay values of zero associated with the field, coarse reject and umpire duplicate database. Specifically, 44 zero values occur within the duplicate assay column and 191 within the original assay column, despite the corresponding paired duplicate assay containing a value for the same element. Although these zero values are likely to represent assays below the analytical detection limit, this could not be confirmed from the duplicate database alone. SRK recommends that Aya review these records against the original analytical certificates and replace the zero values with the reported assay values or, where appropriate, the laboratory detection limit. Where no analytical result is available, the assay value should remain blank and the reason documented within the database, rather than assigning a value of zero.
As noted previously, SRK's assessment of the duplicate database was limited to Au and Ag, as duplicate assay results for the remaining analyzed elements (Cu, Zn and Pb) were not provided by the Company.
12.5.6Field duplicates
Field duplicate samples (recorded as COARSE_DUP_UMP by Aya) were routinely inserted into the sample stream to assess the precision of the complete sampling, sample preparation and analytical process. Overall, field duplicates were inserted at an average insertion rate of approximately 3.41% (13,019 total samples) and have date range between with 2023 and 2026. A small portion of these samples relate to the Aya resampling and the increase of additional QAQC samples.
For DD, field duplicates comprised quarter-core duplicate samples, whereby one-quarter of the drill core was submitted as the duplicate sample following routine half-core sampling. For reverse circulation (RC) drilling, field duplicates comprised second representative splits collected directly from a riffle splitter at the drill rig. These duplicate samples were intended to assess the precision associated with both the sampling procedures and the laboratory analytical process.
SRK reviewed the field duplicate results for Au and Ag via scatter graphs (Figure 12‑14) and considers in general the duplicates are in reasonable agreement with their original sample grades, as noted by the moderate to high statistical correlation for Ag (R2= 0.83) and Au (R2=0.80), and visual inspection of the graphs. The coarse reject duplicate graphs are also impacted by zero values in the original value, though this will not impact the R2value. The observed variability is consistent with that expected for polymetallic mineralization and is considered acceptable for the 2026 MRE.
AYA GOLD & SILVER INC., BOUMADINE POLYMETALLIC PROJECT 93
Figure 12‑14 Field duplicate performance between 2018 and 2026 (A = Au and B = Ag)
AYA GOLD & SILVER INC., BOUMADINE POLYMETALLIC PROJECT 94
12.5.7Coarse reject duplicates
Coarse reject duplicate samples are intended to assess the repeatability of the laboratory analyses while also providing a measure of the consistency of the crushing and sample splitting procedures. As the duplicate samples originate from the same sample, they can also be used to identify potential issues associated with sample preparation prior to analysis.
Coarse reject duplicate samples (recorded as DUP by Aya) were routinely included within the QA/QC program between 2018 and 2024 to assess the repeatability of the sample preparation and analytical procedures. These duplicate samples were generated from the crushed reject following primary crushing and were submitted to the laboratory as blind samples. The DUP samples represent an average insertion rate of approximately 0.30% (1,154 total samples).
In 2025, Aya introduced a second coarse reject duplicate sample type, recorded as DUP_REJECT. These samples comprised crushed coarse reject material randomly selected from approximately one month's sample preparation and were submitted to the laboratory as blind samples, though this has not continued into 2026. DUP_REJECT samples represent an average insertion rate of approximately 0.06% (218 samples in total). As both sample types assess the repeatability of the crushing, splitting and analytical stages of the sampling protocol, SRK has evaluated the two datasets collectively within this section.
SRK reviewed the coarse reject duplicate results for Au and Ag via scatter graphs (Figure 12‑15) and considers that, in general, the duplicate samples are in reasonable agreement (Ag R2=0.73 and 0.43 and Au R2 = 0.63 and 0.19) with their corresponding original sample grades, as demonstrated by the moderate to high statistical correlation and visual inspection of the scatter plots, other than DUP_REJECT for Au which has a R2 of 0.19. This can be explained due to the limited number of duplicate pairs, some of these elevated grades exhibit greater variability within the higher-grade mineralized intervals. In addition a small number of duplicate pairs also comprise one sample reported at, or close to, the analytical detection limit and the corresponding paired sample returning an elevated Au grade (this clearly impacts DUP_REJECT). The coarse reject duplicate graphs are also impacted by zero values in the original value, though this will not impact the R2value. These discrepancies warrant further investigation by Aya to confirm the recorded assay values and ensure that no data transcription or database errors have occurred. The coarse reject duplicate dataset also comprises fewer sample pairs than the field duplicate dataset. Consequently, individual discrepancies or outliers have a proportionally greater influence on the statistical correlation observed for the coarse reject duplicates. Overall, SRK considers the coarse reject duplicate results to demonstrate acceptable sample preparation precision for the purposes of the 2026 MRE.
Given the nature of the polymetallic sulphide mineralization, the level of variability observed is considered reasonable and does not indicate a systematic issue with the sample preparation procedures.
AYA GOLD & SILVER INC., BOUMADINE POLYMETALLIC PROJECT 95
Figure 12‑15 Coarse rejects (DUP and DUP_REJECT) inserted by Aya into the sample stream for Au and Ag.
AYA GOLD & SILVER INC., BOUMADINE POLYMETALLIC PROJECT 96
12.5.8Umpire analysis
Umpire laboratory samples have been submitted to an independent laboratory to assess the analytical accuracy and reproducibility of the primary laboratory results, and to identify any potential analytical bias between laboratories, this was undertaken in 2022, 2023 and 2025. These samples were submitted at a rate of 0.16% (626 total samples).
During the 2022 to 2024 drilling programs, umpire analyses were completed by ALS Seville, Spain. The 2025 Preliminary Economic Assessment notes that, during 2024/2025, Aya commissioned a new ALS laboratory at its Zgounder Mine, Morocco, and subsequent Boumadine umpire samples were submitted to this laboratory for analysis. It should be noted this laboratory only became operational towards the end of 2024.
SRK reviewed the available umpire laboratory results for Au and Ag via scatter plots (Figure 12‑16) and considers that, in general, the Ag (R2=0.96) umpire assays are in good agreement with the corresponding primary Afrilab analytical results, though the Au values (R2=0.57) show a poorer correlation but still within acceptable tolerances for the purposes of the 2026 MRE.
Additional variability is evident at the lower end of the Au grade distribution, where the primary Afrilab analyses commonly report values at the laboratory detection limit of 0.05 g/t Au, whereas the corresponding ALS umpire assays may report lower concentrations, possibly due to the lower reporting limits of the analytical methods employed by ALS. SRK recommends that future umpire analyses are undertaken using analytical methods with reporting limits comparable to those used by the primary laboratory wherever practicable, as differences in analytical detection limits can adversely influence the statistical correlation between the primary and umpire datasets.
In addition, the umpire duplicate dataset comprises fewer sample pairs than the field duplicate dataset and is further affected by the presence of zero values. Consequently, individual discrepancies and outliers have a proportionally greater influence on the overall statistical correlation observed for the umpire dataset. SRK recommends that Aya continues its routine umpire sampling program throughout future drilling campaigns and considers submitting representative samples from the 2024 drilling program. Aya could also consider increasing the amount of umpire samples sent to ALS.
Overall, SRK considers the umpire reject duplicate results appear to show no bias associated with the primary assay laboratory.
AYA GOLD & SILVER INC., BOUMADINE POLYMETALLIC PROJECT 97
Figure 12‑16 Umpire duplicate samples sent to ALS by Aya for Au and Ag
AYA GOLD & SILVER INC., BOUMADINE POLYMETALLIC PROJECT 98
12.6SRK Comments
SRK considers the Company's QA/QC program implemented throughout the modern exploration programs to be appropriate for the purposes of geological modelling and MRE. The routine insertion of CRMs, blank samples, field duplicates, coarse reject duplicates and umpire laboratory samples provides a comprehensive framework for monitoring analytical accuracy, precision and contamination. The CRM suite provides appropriate grade coverage for the principal analytes of economic interest (Au, Ag, Cu, Pb and Zn), and SRK's review indicates that the vast majority of CRM results fall within the expected control limits. Although a limited number of CRM failures were identified, these are primarily associated with low-grade standards containing analyte concentrations close to the analytical reporting limits and historical CRM sample ID assignment issues which were rectified by Aya.
SRK recommends that OREAS 100A, OREAS 354 and OREAS 994 are no longer included in the sample stream, as these CRMs do not have certified values for the applicable aqua regia or fire assay methods employed by Afrilab. Consequently, results for analytes without certification for the applicable analytical method are not directly comparable with the analytical methods employed by Afrilab. In some cases, certified values are available for alternative analytical methods, including four-acid digestion or classical wet chemistry, typically for CRMs containing elevated base metal concentrations. Although SRK assigned a lower level of confidence to comparisons based on these alternative certified values, no material issues were identified in the performance of these CRMs. Other CRMs certified for the applicable aqua regia digestion method provide appropriate coverage of the grade ranges encountered within the Project mineralization and, therefore, the absence of directly comparable certified values for OREAS 100A, OREAS 354 and OREAS 994 is not considered material to the outcome of the QA/QC review.
A small number of apparent sample swaps or mislabelling issues remain within the QA/QC database, resulting either from the mislabelling of original drill core samples or from samples being incorrectly assigned to other QA/QC sample types, including potentially other CRMs. This includes apparent misassignments between OREAS 234B and OREAS 236. SRK also identified two anomalous Zn CRM results reporting concentrations of 123% and 1,299%, which are considered likely to represent transcription or database errors. SRK recommends that Aya investigate these outstanding discrepancies and correct the QA/QC database where appropriate.
SRK also notes that drill core from the 2018 to 2021 drilling programs was relogged and resampled accompanied with QA/QC samples by Aya during 2023. Consequently, the QA/QC data associated with these drillholes generally reflects the 2023 resampling program, rather than the original drilling dates, and this should be considered when interpreting temporal trends within the QA/QC dataset.
The blank sample review indicates that contamination during sample preparation and laboratory analysis is generally well controlled. Field and coarse reject duplicate results demonstrate acceptable analytical precision for the style of polymetallic mineralization encountered at the Project, although a small number of database issues were identified, including zero assay values and missing Au duplicate results, which SRK recommends Aya investigate and correct prior to the next MRE update. SRK recommends that Aya incorporate routine pulp duplicate samples into future QA/QC programs to provide an additional assessment of pulverization performance and sample homogeneity.
Overall, no serious QAQC issues are evident from these results. The QAQC analyses presented are adequate and the data is of a sufficient quality to support the subsequent geological modelling, grade and tonnage estimates presented in this report, though there is opportunity for improvement.
AYA GOLD & SILVER INC., BOUMADINE POLYMETALLIC PROJECT 99
13.0MINERAL PROCESSING AND METALLURGICAL TESTING
13.1Introduction
Several testwork programs have been carried out at different laboratories for the Boumadine Project, with the first pilot test program carried out between 1986-1991 and the latest lab test program completed in 2024. Tested materials have included hist
orical tailings, fresh rock, and produced pyrite concentrate samples. A summary of both the historical and recent test programs is provided in Table 13-1.
Table 13-1 Summary of Testwork Programs
| | | | | | | | | | | | | | | | | | | | | | | | | | | | | | | | | | | |
| Testwork Program | Mineralogy | Comminution | Gravity | Flotation | Direct Cyanidation/CIL | Chlorination | Roast – CIL/Cyanidation | POX – CIL/Cyanidation | BIOX – CIL/Cyanidation | Albion – CIL/Cyanidation | MACH Reactor - Cyanidation |
| SODIM / BRPM SODECAT 1986-1991 (Pilot-scale) | | | | P | | | | | | | |
| URSTM 2011 (tailings sample) | | | | | P | | | | | | |
| Nicromet 2013 (tailings sample) | | | | | | P | | | | | |
| CINF 2017 (tailings sample) | | | | | P | | P | P | | | |
| SGS Lakefield 2018 (tailings and fresh rock samples) | | P | | P | P | | P | P | | | |
| SGS Lakefield 2019 (fresh rock sample) | P | | | P | P | | | P | | P | |
| SGS Lakefield 2022 (composited fresh rock sample) | P | P | P | P | P | | P | | P | P | |
| AFRILAB 2023 Sample Campaign (fresh rock) | P | | | | | | | | | | |
| SGS Lakefield 2023-2024 (composited fresh rock and pyrite concentrate samples) | P | | P | P | | | P | P | | | |
| Mintek 2024 (pyrite concentrate sample) | | | | | P | | | | | | P |
| BGRIMM 2025 (bulk pyrite concentrate sample) | P | | | | | | P | | | | |
Details of the historical testwork (1986-2017) can be found in the published Technical Report and Preliminary Economic Assessment on the Boumadine Project issued on 24 May 2019. Since the results have not been used in the development of the process design criteria, they will not be further discussed in this report. Details of the testwork done by Mintek (2024) have also not been provided since the results were not used toward the development of the process plant design and contained confidential information.
The metallurgical sampling locations for the material tested in the recent programs (2021-present) are shown by disks in the cross-sectional model renderings shown in Figure 13-1.
AYA GOLD & SILVER INC., BOUMADINE POLYMETALLIC PROJECT 100
Figure 13-1 Metallurgical Sampling Locations
AYA GOLD & SILVER INC., BOUMADINE POLYMETALLIC PROJECT 101
13.1.1SGS Lakefield Testwork Program – 2018
In 2018, SGS Lakefield conducted a metallurgical test program on fresh rock and tailings samples from the Boumadine Project. The fresh rock sample (Sample #1) was screened at 10 mesh and any oversize was crushed to pass 10 mesh. It was then homogenized and rotary split into the required test charges. A total of nine tailings samples (Sample #2, 10350, 10351, 10352, 10353, 10358, 10359, 10360 and 10361) were received, which were also homogenized (individually) and split the required test charges.
The testwork program included:
•Head analysis.
•Grindability testing (for fresh rock sample only).
•Flotation testing.
•Cyanidation testing.
•Roast-CIL testing.
•POX-CIL testing.
13.1.1.1Head Analysis
Representative aliquots of each sample were submitted for chemical analysis including whole rock analysis, ICP scanning, fire assay for Au and Ag, LECO for total sulphur and sulphides, XRF for Pb, Zn, and Cu by, and comprehensive analysis for other elements by ICP-MS and fire assay / ICP. The results for elements of interest are shown in Table 13-2.
Table 13-2 Head Analysis of Fresh Rock and Tailings Samples
| | | | | | | | | | | | | | | | | | | | | | | | | | | | | | | | | | | |
| Element | Units | Sample ID |
| Sample #1 | Sample #2 | 10350 | 10351 | 10352 | 10353 | 10358 | 10359 | 10360 | 10361 |
| S.G. | - | 4.04 | 3.4 | 2.31 | 2.41 | 2.31 | 3.1 | - | - | - | - |
| Fire Assay |
| Au | g/t | 4.29 | 3.20 | 1.79 | 1.34 | 1.58 | 2.16 | 1.75 | 2.10 | 3.26 | 2.52 |
| Ag | g/t | - | - | - | - | - | - | 120 | 165 | 201 | 136 |
| LECO |
| S | % | 37.0 | 27.8 | 12.4 | 14.9 | 13.0 | 23.3 | 14.4 | 24.1 | 22.8 | 28.7 |
| S= | % | 36.1 | 24.5 | 0.40 | 5.21 | 0.53 | 20.0 | - | - | - | - |
| XRF |
| Pb | % | 0.41 | 0.30 | 0.31 | 0.23 | 0.33 | 0.64 | 0.35 | 0.55 | 0.31 | 0.30 |
| Zn | % | 1.34 | 0.098 | 0.77 | 1.00 | 0.68 | 1.03 | 0.60 | 1.19 | 0.21 | 1.12 |
| Cu | % | 0.18 | 0.012 | 0.028 | 0.045 | 0.043 | 0.17 | 0.044 | 0.12 | 0.016 | 0.051 |
13.1.1.2Grindability Testwork
The fresh rock sample was submitted for the Bond ball mill grindability test performed at 100 mesh of grind. The Bond ball mill work index (BWi) was determined to be 10.7 kWh/t, falling in the moderately soft range of SGS’s database.
13.1.1.3Flotation Testwork
Rougher Kinetic Flotation Testing
AYA GOLD & SILVER INC., BOUMADINE POLYMETALLIC PROJECT 102
Open circuit batch rougher kinetic flotation tests were conducted on the Sample #1 (fresh rock) and Sample #2 (tailings).
The fresh material sample responded reasonably well to conventional lead / zinc / pyrite flotation process. Open circuit batch rougher flotation tests on the fresh rock sample resulted in 69.7% recovery of lead to a lead rougher concentrate at a grade of 7.8% Pb, and 16.7% of the gold also reported to the lead concentrate. The zinc rougher concentrate graded 36.8% Zn with 81.9% recovery at low mass pull (3.3%). The pyrite rougher circuit recovered 92% of the sulfur with high mass pull of 68.6%. The pyrite rougher concentrate sulphur grade was 50.7% and recovered 79.5% of the gold.
For the tailings sample, it was discovered that the pH of the pulped sample was very low following grinding. The quantity of lime required to raise the pH to 8.5 for flotation was very high and weight loss was observed during flotation. For the second test on Sample #2 material, the sample was washed, ground, filtered and washed again prior to flotation. The filtrate and wash solutions were analyzed and showed a high concentration of iron, indicating the presence of soluble salts which were contributing to the low pH and high lime consumption. A bulk sulphide flotation was performed on the washed tailings, producing a pyrite rougher concentrate recovering 99.6% of the sulphides and 91.3% of the gold at grades of 49.3% S and 6.1 g/t Au.
Cleaner Flotation Testing
Open circuit batch cleaner flotation tests were performed on Sample #1. The first test attempted to produce lead, zinc, and pyrite concentrates. A lead 4th cleaner concentrate grading 33.1% Pb was produced with 56.7% Pb recovery. The zinc 3rd cleaner concentrate assayed 51% Zn with 78% Zn recovery. The pyrite rougher concentrate contained 49.8% S and 3.4 g/t Au with recovery rates of 92.4% S and 73% Au. The pyrite rougher tails assayed 0.2 g/t Au. Most of the gold losses were in the lead circuit.
A second test was performed without lead flotation. A zinc concentrate was produced grading 46.4% Zn, but with only 47.6% recovery. The pyrite rougher concentrate assayed 49.8% S and 5.28 g/t Au, with 97.5% S recovery and 87.5% Au recovery. The gold loss to the zinc circuit was 11%, and the pyrite rougher tails assayed 0.22 g/t Au. 85.2% of the contained lead reported to the pyrite concentrate.
A third test was performed to produce pyrite concentrate for downstream testing (roast / CIL). A lead rougher stage was included to reduce the amount of lead in the pyrite concentrate. A zinc concentrate grading 54.2% Zn was produced with 79.5% Zn recovery. The pyrite concentrate graded 51% S and 5.18 g/t Au with sulphur recovery at 93.9% and gold recovery at 80.9%. The major gold loss was to the lead rougher concentrate at 15.5%. The pyrite concentrate was submitted for a roast / CIL test.
13.1.1.4Cyanidation Testwork
Five cyanide bottle roll tests were completed on tailings samples (Sample #2, 10350, 10351, 10352 and 10353) and two tests on pyrite concentrate samples after fine grinding to <10 microns (μm).
The tailings samples were washed before leaching. Lime and NaCN consumptions were high and further weight losses occurred during the leaching period. The normalized recoveries (based on residue and direct head grades) ranged from 25-69%.
The lime and NaCN consumptions for the pyrite concentrate samples were also high, and the overall normalized recoveries were 38-41%.
Silver recoveries were higher with the overall normalized recoveries ranging between 47-98% for the tailings samples and 59-73% for the pyrite concentrate samples.
13.1.1.5Roast-CIL Testwork
Four roasting tests were completed – two on the obtained flotation concentrate and two on the tailings composite samples. The tests were conducted as two-stage roasts, in a static muffle furnace for a total of
AYA GOLD & SILVER INC., BOUMADINE POLYMETALLIC PROJECT 103
four hours (two hours per stage). The sample was stirred every 15 minutes during the second stage. All sulphide sulphur was oxidized during roasting.
Each calcine was subsequently subjected to a standard cyanidation test as CIL, with 2 g/L NaCN, 10 g/L carbon for 24 hours. The RST-2 calcine (CN-9 feed) was ground in an attrition mill to <10 μm prior to cyanidation. The CIL testing results are listed in Table 13-3.
Gold extraction from the calcines ranged from 45% to 85%, whereas silver recovery ranged from 5% to 72%. The poor recovery from the fully oxidized calcine could have been due to the presence of 0.15% to 0.25% lead in the pyrite concentrates, which was known to cause problems in the roasting process.
13.1.1.6POX-CIL Testwork
Seven pressure oxidation (POX) tests were completed on the obtained flotation concentrate and tailings composite samples. The POX tests were carried out in standard Parr 2 L titanium autoclaves. The pulp density in the POX tests was dictated by the sulphide sulphur grade in the POX feed and the need to create autothermal heating conditions. The POX feed was pre-acidulated to pH 1.5 for 30 minutes by addition of sulphuric acid. After POX, the pulp was filtered, and the solids were washed. POX residues were sub-sampled for analysis and the remaining residue forwarded for CIL. POX-4 through POX-7 tests evaluated the effect of Hot Curing (HC) and Lime Boiling (LB) on subsequent lime consumption and silver recovery during CIL. The POX-CIL results are summarized in Table 13-4.
Gold recovery from the flotation concentration after POX 1 pressure oxidation (POX CIL1) was high, at 97.4%. However, lime consumption was extremely high at 321 kg/t (POX feed basis). Silver recovery was low at 49%. The results are related to the chemistry in the pressure oxidation process, with high sulphide feeds tending to produce significant amounts of basic iron sulphate and silver jarosite. The sulphate ion in basic iron sulphate does not react with limestone and can only be neutralized with lime. Therefore, copious amounts of lime were consumed during neutralization of the POX residue prior to and during cyanidation. In addition, it is well known that silver jarosite is insoluble in cyanide solution. These are well known phenomena in processing of refractory gold sulphide concentrates by pressure oxidation.
The consumption of lime by the POX 4 residue was reduced significantly to 16.8 kg/t in the POX CIL 4 test, by employing a Hot Cure stage after pressure oxidation. Silver recovery in this test, however, dropped from 49% in POX CIL 1 to just 1.2%, indicating that more silver jarosite formed during hot curing.
In the final test on the flotation concentrate, POX CIL 6, the autoclave slurry was first subjected to Hot Curing, followed by solid-liquid separation and washing of the residue. The washed solids were then subjected to a Lime Boil stage, which is designed to breakdown the silver jarosite complex. Excess lime is added to the slurry (generally 100 to 200% stoichiometric excess of the sulphate in the solids), which is then held near boiling temperature for several hours. The overall lime requirement was 60 kg/t, and recovery of both gold and silver were high after lime boiling, at approximately 98%.
AYA GOLD & SILVER INC., BOUMADINE POLYMETALLIC PROJECT 104
Table 13-3 Roast-CIL Results
| | | | | | | | | | | | | | | | | | | | | | | | | | | | | | | | | | | |
| Test ID | Feed | Temperature °C | Sulphide S % | Reagent Addition kg/t | Reagent Consumption kg/t | CIL Recovery % |
| Stage 1 | Stage 2 | Stage 1 | Stage 2 | NaCN | CaO | NaCN | CaO | Au | Ag |
| RST-1 | F7 Pyrite Con | 400 | 700 | 49.6 | <0.05 | 2.82 | 1.16 | 1.02 | 1.16 | 62.5 | 9.1 |
| RST-2 | 240g F7 Pyrite Con +10g Pb Con | 400 | 700 | | | 4.17 | 4.29 | 3.91 | 4.27 | 84.8 | 72.5 |
| RST-3 | Oxidized Tailings Comp | 650 | 800 | 8.62 | <0.05 | 2.62 | 1.19 | 1.02 | 1.18 | 68.7 | 7.0 |
| RST-4 | Non-Oxidized Black Tailings Comp | 650 | 800 | 24.3 | <0.05 | 3.39 | 1.54 | 1.54 | 1.52 | 44.8 | 4.7 |
Table 13-4 POX-CIL Results
| | | | | | | | | | | | | | | | | | | | | | | | | | | | | | | | |
| Test ID | Feed | Product to CIL | Lime Boil CaO addition | Reagents (kg/t of POX feed) | CIL Recovery % |
| Added | Consumed |
| kg/t LB feed | kg/t POX feed | NaCN | CaO | NaCN | CaO | Au | Ag |
| POX CIL 1 | F7 Pb Ro Con & F7 Pyrite Con | POX 1 residue | - | - | 7.24 | 320.8 | 3.55 | 320.8 | 97.4 | 49.2 |
| POX CIL 2 | Oxidized Tailings Comp | POX 2 residue | - | - | 1.96 | 93.2 | 1.00 | 93.2 | 87.7 | 12.1 |
| POX CIL 3 | Non-Oxidized Tailings Comp | POX 3 residue | - | - | 2.21 | 73.7 | 0.61 | 73.6 | 95.4 | 3.5 |
| POX CIL 4 | F7 Pb Ro Conc & F7 Pyrite Conc | POX 4 HC residue | - | - | 6.56 | 16.8 | 4.45 | 16.8 | 97.6 | 1.2 |
| POX CIL 5 | Non-Oxidized Tailings Comp | POX 5 HC residue | - | - | 1.49 | 2.4 | 0.37 | 2.2 | 43.7 | 65.7 |
| POX CIL 6 | F7 Pb Ro Conc & F7 Pyrite Conc | POX 6 HC-LB residue | 263 | 59.2 | 2.11 | 0.6 | 0.90 | 0.6 | 98.2 | 97.6 |
| POX CIL 7 | Non-Oxidized Tailings Comp | POX 7 HC-LB residue | 40.1 | 23.8 | 1.39 | 0.4 | 0.25 | 0.3 | 71.6 | 81.4 |
AYA GOLD & SILVER INC., BOUMADINE POLYMETALLIC PROJECT 105
13.1.2SGS Lakefield Testwork Program - 2019
In 2019, further metallurgical testwork was carried out on the fresh rock sample that was used in previous 2018 program. The sample was stored in the freezer and therefore was considered with the same characteristics to samples tested in the previous program.
Sequential flotation was carried out on the ground sample to produce a pyrite concentrate for gold recovery testwork, including baseline cyanidation, POX, and Albion Process™. The Albion Process™, developed by Xstrata Pty Ltd. (Glencore Technology Pty Limited) is a combination of fine grinding and exothermic oxidative leaching without the need for pressure treatment or external heating.
Open circuit batch rougher flotation tests resulted in a lead rougher concentrate with a grade of 10.4% Pb at a recovery of 67.0%, along with 12.9% of the gold and 43.7% of the silver, which also reported to the lead concentrate of grades of 19.8 g/t and 6,906 g/t, respectively. The zinc rougher concentrate graded 51.1% Zn at 68.8% recovery with a low mass pull (1.9%). The pyrite rougher circuit recovered 93.9% of the sulphur to the concentrate, with a high mass pull of 70%.
A full chemical head analysis and a semi-quantitative XRD analysis were conducted on the pyrite concentrate. The concentrate had a sulphur grade of 51.0% with 4.96 g/t Au and 310 g/t Ag, and the concentrate sample was found to be composed of 94% pyrite with just over 5% quartz and less than 1% each of arsenopyrite and chalcopyrite.
A bottle roll cyanidation test was conducted on the pyrite concentrate to serve as a baseline for comparing the gold recoveries after processing the pyrite concentrate by either the Albion or POX processes. The concentrate was first attrition-ground (250 g at 50% solids for 30 minutes), resulting in a product D80 of 4.47 µm (determined via Malvern analysis). The CIL conditions were 5.0 g/L NaCN with oxygen sparging at 40% solids with 15 g/L carbon for 24 hours.
The Albion Process™ testing at SGS Lakefield is accredited by Glencore Technology. The attrition-ground solids were pulped to 10%, heated to 95 °C and the slurry was first acidified using sulphuric acid to a pH of 4.5 until the pH started to fall naturally. Oxygen was sparged into the pulp at ~1 L/min and alkali addition in the form of 20% solids limestone slurry (CaCO3) was added via a pH controller to control the pH at 5.5. The test ran for a period of ~52 hours with constant monitoring of pH, ORP and limestone additions were recorded. Hot water was added to the pulp throughout the leach to make up for any evaporative losses. The residue from Albion leaching was then subjected to CIL, under the same conditions as for the baseline test.
With the relatively low level of sulphide oxidation obtained in the first Albion leach test (Neutral Albion-1R), a repeat test was carried out. In the repeat Albion test (Neutral Albion-1R), the pyrite concentrates leach residence time was increased from 52 to 72 hours and the oxygen sparging rate was increased from 1 L/min to 1.7 L/min. Initial acid addition to kick-start oxidation was 2 kg/t lower than in the first test at 21 kg/t H2SO4. Alkali addition of 1,209 kg/t CaCO3 was almost three times the amount used in the first test (440 kg/t).
Three identical POX tests were conducted, and the products were combined for downstream testing (hot cure, lime boil and CIL). The pulp was pre-acidulated for 30 minutes at pH 1.5 with sulphuric acid in 2 L titanium autoclave vessels. After 30 minutes, the autoclave was sealed, pressure tested and heated to target temperature. The tests were run at 225 °C for 60 minutes, with 690 kPa (~100 psi) of oxygen over pressure applied. The three POX pulps were combined and heated to 95°C for four hours in a 4 L Pyrex vessel with a lid and overhead mechanical agitation (Hot Curing process, to re-dissolve basic iron sulphate to ferric sulphate in solution). The washed hot cure residue was pulped to 10% solids and boiled at 95°C for six hours at a reagent addition of 35.8 kg/t POX feed (Lime Boiling process, to break down the silver jarosite complex). After six hours, the pulp was forwarded for CIL testing.
The CIL testing results of the three gold recovery processes are summarized in Table 13-5. The baseline test had high addition and consumption rates for NaCN and demonstrated good silver recovery at 84%, but poor recovery of 17%. CIL on the Albion leached product (NA-1, obtained from 52 hours Albion leaching) resulted in
AYA GOLD & SILVER INC., BOUMADINE POLYMETALLIC PROJECT 106
slightly higher gold recovery to 45% with similar silver extraction (85%) as the baseline. The repeated Albion test (NA-2, 72 hours) resulted in CIL leaching recovery of 81% for gold and 92.3% for silver. It was anticipated that with further optimization of the Albion conditions, further sulphide oxidation can likely be achieved and gold extraction from the residue increased even further. Pressure Oxidation of the pyrite concentrate, followed by hot curing and lime boiling, provided the best extraction of the three processes – with extractions of 98% and 96%, respectively.
Table 13-5 CIL Results Summary
| | | | | | | | | | | | | | | | | | | | | | | | | | |
| Test | Reagents (kg/t of CIL feed) | Recovery % | CIL Residue g/t |
| Added | Consumed |
| NaCN | CaO | NaCN | CaO | Au | Ag | Au | Ag |
| CIL-1 Baseline | 24.9 | 1.83 | 22.3 | 1.60 | 17.3 | 83.9 | 4.07 | 48 |
| CIL-2 Neutral Albion-1 | 3.85 | 11.7 | 3.52 | 11.6 | 45.4 | 84.8 | 1.65 | 29.4 |
| CIL-4 Neutral Albion-1R | 5.46 | 6.79 | 5.11 | 6.79 | 81.0 | 92.3 | 0.37 | 8.6 |
CIL-3 POX-HC-LB* | 2.23 | 3.98 | 1.52 | 3.98 | 98.2 | 96.6 | 0.41 | 47.6 |
*35.8 kg/t CaO added during LB prior to CIL-3.
13.1.3SGS Lakefield Testwork Program - 2022
The 2022 test program by SGS Lakefield was carried out on a composite of 75 samples received from the Boumadine deposit (called the Main Composite). The samples were crushed, blended and split to portions for chemical and mineralogy analysis, comminution testing (BWi), and metallurgical testing including:
•Gravity separation.
•Flotation (open circuit and locked cycle).
•Direct CIL cyanidation of pyrite flotation concentrate.
•BIOX-CIL.
•Albion Leach™-CIL.
•Roast-CIL.
13.1.3.1Head Analysis
The chemical analysis included gold and silver by fire assay, total organic carbon, total carbon, sulphide sulphur, mercury, lead, zinc, and a multi-element ICP scan. The results for the elements of significant interest are shown in Table 13-6.
Table 13-6 Composite Sample Head Analysis
| | | | | | | | | | | | | | | | | | | | | | | |
| Element | Au g/t | Ag g/t | As g/t | Cu % | S= % | Pb % | Zn % |
| Assay | 3.33 | 113 | 834 | 1.94 | 26.5 | 1.00 | 2.25 |
13.1.3.2Mineralogy
X-Ray Diffraction
The XRD results provided the overall mineral composition of the composite sample as summarized in Table 13-7. Slightly more than 40% of the sample weight were sulphides with the most common being pyrite.
AYA GOLD & SILVER INC., BOUMADINE POLYMETALLIC PROJECT 107
Table 13-7 Composite Sample Mineralogy
| | | | | |
| Mineral | % Weight |
| Quartz | 34.6 |
| Pyrite | 32.6 |
| Muscovite | 17.1 |
| Chlorite | 3.3 |
| Sphalerite | 3.2 |
| Gypsum | 2.9 |
| Arsenopyrite | 2.8 |
| Biotite | 1.7 |
| Galena | 0.9 |
| Chalcopyrite | 0.9 |
| Total | 100 |
TIMA-X
A portion of the sample was stage-crushed, targeting a P80 of 75 µm but obtaining a true P80 of 220 µm. The sample was screened into +53 µm and -53 µm fractions. The modal mineralogy, liberation and association characteristics of sulphides, and gold and silver deportment of the samples were characterized by Tescan Integrated Mineral Analyzer (TIMA-X) technology using the High-Resolution Mapping method. The results for both size fractions were combined to represent the composite sample.
Modal Mineralogy
The sulphides in the composite sample were found to consist of mainly of pyrite (55.5%), sphalerite (4.1%), arsenopyrite (3.2%), galena (1.4%), and trace amounts of chalcopyrite (0.4%), pyrrhotite (0.1%), and tetrahedrite (0.06%). The remainder of the sample was found to be composed of quartz (21.7%), micas/chlorite/clays (10.6%), and trace amounts (<1% each) of other minerals.
A discrepancy was observed between the quartz and pyrite grades obtained by the XRD and TIMA analyses, which was attributed to potential gravity settling during sample preparation.
Sulphide Liberation and Association
At the grind size P80 of 220 µm, the liberation and mineral association of the key minerals of interest were as follows:
•A high amount of the contained pyrite was found to be free and liberated (approximately 94%). The increase of pyrite liberation from the +53 µm to -53 µm size fraction was minimal at 2%.
•Approximately 77% of the contained arsenopyrite was free and liberated. The increase of arsenopyrite liberation between the +53 μm to -53 μm size fractions was significant at 24%.
•Approximately 78% of the contained sphalerite was free and liberated. The increase of sphalerite liberation between the +53 μm to -53 μm size fractions was significant at 47%.
•Approximately 65% of the contained galena was free and liberated. The increase of galena liberation between the +53 μm to -53 μm size fractions was significant at 60%.
•The remainder of the arsenopyrite, sphalerite and galena occurred as complex particles and middlings with pyrite and quartz / feldspars.
Based on individual particle liberation and grade, mineralogically limited grade-recovery analyses were carried out to indicate theoretical maximum achievable grade by recovery of the sulphide minerals. The analysis projected:
AYA GOLD & SILVER INC., BOUMADINE POLYMETALLIC PROJECT 108
•Galena grades between 100% and 58% for recoveries of between 54% and 87%.
•Sphalerite grades between >99% and 63% for recoveries of between 69% and 96%.
•Arsenopyrite grades between >99% and 72% for recoveries of between 56% and 96%.
Gold and Silver Mineralogy
69% of the contained gold in the composite sample was determined to be native gold and 30% was electrum. The gold grains were generally very fine (<15 µm) with 78% of the gold grains below <3 µm, accounting for 23% of the gold by mass. The gold minerals were poorly liberated, with pure, free and liberated grains accounting for only 12.4% of the total. Non-liberated grains occurred as middlings with pyrite (45.8%), and sphalerite (1.8%), and complex particles (40.0%). These phenomena suggested that achieving high gold concentrations by physical means would be unrealistic, and that leaching extraction would need to follow a high degree of pyrite oxidation.
Silver was found to be widely distributed as native silver (20%) with the remainder occurring as acanthine, electrum, tetrahedrite, polybasite, freibergite, jalpaite, native gold, and others. Only 1.6% of the silver minerals were free, pure and liberated, with the remaining non-liberated particles occurring as middlings with pyrite (25.8%) and quartz / feldspars (4.1%), and predominantly as complex particles (67.4%).
13.1.3.3Comminution Testing
The Main Composite sample was submitted for the Bond ball mill grindability test performed at a 150 mesh of grind. The measured Bond ball mill work index (BWi) was 15.4 kWh/t, falling in the moderately hard range when compared to SGS’s database.
13.1.3.4Gravity Separation Testing
1.8 kg of the Main Composite sample was used for the test feed. The feed was ground in a laboratory rod mill to a P80 of 78 μm. The mill discharge was passed through a Knelson MD-3 Concentrator, collecting a concentrate and producing tailings. The Knelson concentrate was further upgraded on a Mozley mineral separator. The final concentrate represented 0.1% of the feed mass and graded 312 g/t Au and 747 g/t Ag. The combined Knelson and Mozley tailings assayed 1.55 g/t Au and 117 g/t Ag. The recovery to the final Mozley concentrate was 19% Au and 0.7% Ag. The results indicated that gravity separation would add little value to the flowsheet.
13.1.3.5Flotation Testwork
Open circuit rougher and cleaner tests were completed on the Main Composite sample, attempting to produce a saleable lead / gold / silver concentrate and a pyrite concentrate with the maximum amount of gold and silver, along with a zinc concentrate that would be floated prior to pyrite flotation. Locked cycle testing was also completed to determine the effect of recirculating middling products, to test the robustness of the conditions and to produce a pyrite concentrate for downstream testing.
Rougher Flotation Tests
The baseline lead-zinc-pyrite kinetic test was completed at a primary grind P80 of 58 μm. The reagents and grind size were varied in the subsequent tests. These test conditions produced a lead-gold-silver concentrate grading 9.39% Pb, 3.47% Zn, 1.60 % As, 30.8% S, 12.4 g/t Au, and 678 g/t Ag in the baseline test. The concentrate recovered 87% of lead, 32.8% of gold, and 53.9% of Ag. However, 14.8% of the Zn and 13% of the As also reported to the lead rougher concentrate.
Further tests were conducted with the objective of increasing the grade of the lead-gold-silver concentrate and a pyrite concentrate containing the remainder of the gold and silver. The tests investigated different reagent schemes and grind sizes. The main objective of these tests was to reduce the amount of zinc reporting to the
AYA GOLD & SILVER INC., BOUMADINE POLYMETALLIC PROJECT 109
lead concentrate. Various zinc / sulphide depressants, in addition to ZnSO4 and NaCN, were tested, such as sodium sulphide, sodium sulphite, and sodium metabisulphite. None of these alternatives significantly reduced the level of zinc in the rougher concentrate. The zinc recovered to the lead concentrates ranged from14% to 25%. The combined lead + pyrite concentrates all achieved recoveries of greater than 90% gold and 85-87% silver.
Two flotation tests were performed at finer grind sizes of P80 of 37 μm. The finer grind did not appear to have any effect on overall grades or recoveries, although reagent additions also differed from the coarser ground tests.
Bulk Sulphide Flotation Test
A single bulk sulphide flotation test was conducted a neutral pH, producing a concentrate with 1.53% Pb, 3.52% Zn, 1.79% As, 44.1% S, 5.16 g/t Au and 185 g/t Ag. The recovery of all elements was very high (>96%), but the concentrate mass pull was also very high at 58.7%.
Cleaner Flotation Tests
Four open circuit batch cleaner flotation tests were performed on the Main Composite sample, trialling various circuit arrangements, grind sizes and flotation reagents conditions. The results showed that adding sodium cyanide to the lead flotation circuit helped to depress sphalerite and pyrite flotation, decreasing the amount of zinc in the lead concentrate by 50%. Implementing a zinc regrind helped improve the zinc concentrate grade slightly but the recovery increased more significantly from 59.7% to 74.8%. Implementing a finer lead grind produced a higher-grade concentrate with lower zinc content but reduced overall recovery. These trials were able to achieve sufficient lead recovery and zinc grade but had high grades of gold and silver in the lead concentrate, lead grades below the saleable target, and low zinc recovery. The results suggested that to achieve concentrate grades of 50% or more for both lead and zinc, low recoveries would be expected.
Locked Cycle Flotation
A locked cycle test was completed with the goals of assessing overall metallurgical performance with the incorporation of internal recycles and producing concentrate for downstream testing. The test was completed over six cycles with 2 kg of feed per cycle. Products were recirculated in a typical counter-current manner. The lead and zinc first cleaner tailings were advanced to the next circuit roughing stage. The tested flowsheet, including the recirculation of middling streams, is shown in Figure 13-2.
Figure 13-2 Locked Cycle Test Flowsheet
The conditions for the locked cycle test were based on the results from the batch tests, with minor adjustments in the reagent dosages. The primary grind P80 target was 58 μm, lead regrind D80 was 18 μm, and zinc regrind D80 was 17 μm. The test conditions are summarized in Table 13-8.
The test generally exhibited satisfactory stability except for zinc, where the stability was lower than the other elements, suggesting that steady state may not have been achieved in the zinc circuit. The results of the locked cycle tests based on the out-products from the final 3 cycles are presented in Table 13-9.
AYA GOLD & SILVER INC., BOUMADINE POLYMETALLIC PROJECT 110
Table 13-8 Locked Cycle Test Conditions
| | | | | | | | | | | | | | | | | | | | | | | |
| Pb Circuit | Reagents Dosed (g/t) | Time (min) | |
| Lime | Zn(SO4).7H2O | NaCN | Aero3418A | MIBC | Grind | Cond. |
| Grind | - | 300 | 100 | 5 | - | 70 | |
| Pb Rougher 1 | - | - | - | - | 10 | | 1 |
| Pb Rougher 2 | - | 15 | 5 | 5 | 5 | | 1 |
| Pb Rougher 3 | - | 15 | 5 | 5 | 5 | | 1 |
| Pb Regrind | - | 30 | 10 | - | - | 15 | |
Pb 1st Cleaner | - | - | - | 5 | 5 | | 1 |
Pb 1st Cl Scav | - | - | - | 2.5 | 5 | | 1 |
Pb 2nd Cleaner | - | - | - | - | 5 | | 1 |
Pb 3rd Cleaner | - | - | - | - | 5 | | 1 |
| Total | 0 | 360 | 120 | 22.5 | 40 | | 7 |
Zn Circuit (Pb Ro + 1st Cl Sc Tails) | Reagents Dosed (g/t) | Time (min) | |
| Lime | Cu(SO4).5H2O (10% w/w) | SIPX
(1% w/w) | MIBC | Grind | Cond. | Froth |
| Zn Conditioner 1 | 1,400 | - | - | - | | 3 | |
| Zn Conditioner 2 | - | 225 | - | - | | 3 | |
| 265 | - | - | - | | 2 | |
| Zn Rougher 1 | - | - | 10 | 10 | | 1 | 1 |
| Zn Rougher 2 | 165 | - | 10 | 7.5 | | 1 | 2 |
| Zn Regrind | 250 | - | 5 | - | 5 | | |
Zn 1st Cleaner | 60 | - | - | 7.5 | | 1 | 2 |
Zn 1st Cl Scav | - | - | 5 | 7.5 | | 1 | 1 |
Zn 2nd Cleaner | 50 | - | - | 7.5 | | 1 | 1.5 |
Zn 3rd Cleaner | 140 | - | 2.5 | 5 | | 1 | 1.5 |
| Total | 930 | 225 | 32.5 | 45 | | 11 | 9 |
Sulphide Circuit (Zn Ro + Zn 1st Cl Tails) | Reagents Dosed (g/t) | Time (min) | pH | Eh |
| PAX | MIBC | H2SO4 | Cond. | Froth | | |
| Sulphide Conditioner | - | - | 1,000 | 1 | | 8.0 | 100 |
| Sulphide Rougher 1 | 100 | 10 | - | 1 | 2 | 8.2 | 75 |
| Sulphide Rougher 2 | 100 | 7.5 | - | 1 | 4 | 8.4 | 50 |
| Sulphide Rougher 3 | 100 | 10 | - | 1 | 8 | 8.5 | 50 |
AYA GOLD & SILVER INC., BOUMADINE POLYMETALLIC PROJECT 111
Table 13-9 Locked Cycle Test Results Summary
| | | | | | | | | | | | | | | | | | | | | | | | | | | | | | | | | | | | | | | | | | | | | | | |
| Product | Weight % | Assays | % Distribution |
Cu
% | Pb
% | Zn
% | As
% | S
% | Au
g/t | Ag
g/t | Cu | Pb | Zn | As | S | Au | Ag |
| Pb Conc | 3.0 | 4.81 | 26.7 | 4.35 | 1.67 | 35.0 | 26.6 | 1,923 | 75.3 | 84.5 | 7.1 | 4.7 | 4.1 | 26.5 | 53.1 |
| Zn Conc | 2.3 | 0.37 | 0.48 | 58.1 | 0.27 | 32.9 | 1.22 | 166 | 4.3 | 1.2 | 72.0 | 0.6 | 2.9 | 0.9 | 3.5 |
| Pyrite Conc | 54.9 | 0.061 | 0.18 | 0.65 | 1.69 | 42.4 | 3.80 | 78.5 | 17.4 | 10.6 | 19.5 | 86.8 | 89.9 | 69 | 39.6 |
| Pyrite Tails | 39.9 | 0.015 | 0.089 | 0.063 | 0.21 | 2.02 | 0.27 | 10.5 | 3.0 | 3.7 | 1.4 | 7.9 | 3.1 | 3.6 | 3.8 |
| Head (calc) | 100 | 0.19 | 0.95 | 1.83 | 1.07 | 25.9 | 3.02 | 109 | 100 | 100 | 100 | 100 | 100 | 100 | 100 |
| Head (direct) | - | 0.19 | 1.00 | 2.25 | 0.083 | - | 3.33 | 113 | - | - | - | - | - | - | - |
AYA GOLD & SILVER INC., BOUMADINE POLYMETALLIC PROJECT 112
The following observations were made from the locked cycle test:
The final lead concentrate had a good lead recovery of 84.5%, but low grade of 26.7% Pb. The main diluents were copper and zinc.
•The final zinc concentrate grade was good at 58.1% Zn in 2.3% of the total mass, but the recovery was modest at 72%.
•The pyrite concentrate recovered 69% of the gold, 39.6% of the silver, 89.9% of the S, and 86.8% of the arsenic, in a high mass pull of 54.9%.
•Gold and silver were mainly recovered to the lead concentrate, with 26.5% of the gold and 53.1% of the silver reporting to the lead concentrate.
13.1.3.6Pyrite Concentrate Testing
The pyrite concentrates from cycles the six were combined and blended, then split into small charges for direct CIL, Albion, BIOX, and roasting testwork. The P80 size of the concentrate composite was determined to be 42 µm, and the composition of elements of interest is provided in Table 13-10.
Table 13-10 Pyrite Concentrate Analysis
| | | | | | | | | | | | | | | | | | | | | | | | | | |
| Au
g/t | Ag
g/t | Pb
% | Zn
% | Fe
% | As
% | S
% | S=
% |
| Assay | 3.83 | 76.2 | 0.27 | 0.45 | 35.8 | 1.72 | 42.8 | 41.4 |
Direct CIL Testing
Two cyanidation tests were completed on the pyrite concentrate at two grind sizes: one at the “as received” grind size of P80 42 μm and the other reground to a D80 of 6.3 μm. The other test conditions were held constant across both trials. The results of the tests are summarized in Table 13-11.
Table 13-11 Direct CIL Extraction Results
| | | | | | | | | | | | | | | | | | | | | | | |
| Test No. | P80 µm | Reagent Added
kg/t CN Feed | Reagent Cons.
kg/t of CN Feed | Au Extraction
% | Ag Extraction
% |
| NaCN | CaO | NaCN | CaO |
| CIL 1 | 42 | 20.3 | 4.25 | 4.39 | 3.91 | 9.5 | 36.4 |
| CIL 2 | 6.3 | 28.5 | 15.4 | 14.5 | 15.3 | 22.4 | 80.2 |
Gold extraction was improved with fine grinding but was still very low for both trials. Better extractions were seen for silver, reaching 80% for the finely ground sample. The reagent consumptions were high and increased significantly with fine grinding.
Albion Testing
Glencore recommended Albion leach parameters that were in line with their standard neutral leach protocol. The Albion oxidation test conditions and results are summarized in Table 13-12.
Table 13-12 Pyrite Concentrate Albion Testing Results
| | | | | | | | | | | | | | |
| Test No. | Retention Time h | P80 µm | Limestone Addition kg/t | Sulphide Oxidation % |
| NAL-1 | 96 | 6.3 | 1,647 | 96.3 |
| NAL-2 | 78 | 10 | 1,261 | 74.7 |
AYA GOLD & SILVER INC., BOUMADINE POLYMETALLIC PROJECT 113
Sulphide oxidation was high (96.3%) for the test at the finer grind size P80 of 6.3 μm and longer retention time but dropped significantly to 74.7% when the grind was coarsened to 10 μm and the retention time decreased to 78 hours.
The Albion residues were washed before they were subjected to cyanide leaching testing. The CIL test results are provided in Table 13-13.
Table 13-13 CIL Leaching Results for Albion Residues
| | | | | | | | | | | | | | | | | | | | |
| Sample | Reagent Added kg/t CN Feed | Reagent Cons kg/t of CN Feed | Au Extraction % | Ag Extraction
% |
| NaCN | CaO | NaCN | CaO |
| NAL-1 Residue | 7.9 | 2.5 | 3.2 | 2.4 | 94.4 | 94.8 |
| NAL-2 Residue | 8.2 | 3.3 | 2.3 | 3.3 | 84.9 | 91.3 |
Gold and silver extractions were greatly improved after the Albion pre-treatment. The test at 6.3 μm grind size achieved gold and silver extractions of 94.4% and 94.8%, respectively. The gold extraction decreased significantly with the coarser grind and shorter retention time. Reagent consumptions for both trials were reduced in comparison with the direct CIL tests.
Bacterial Oxidation (BIOX) Testing
The inoculum build up was performed in preparation of the bioleach tests. For each of the tests, the pyrite concentrate sample was slurried with the bacteria, with conditions maintained for optimum bacterial activity (heated to 40°C in an acidic solution, targeting ~10.5% pulp density). After 18, 26, or 35 days, the pulps were filtered, and the filtrate was collected and measured. A filtrate sample was submitted for analysis and the rest was retained. The filter cake was repulped with water, agitated and re-filtered. The filter cake was then washed three times, targeting one displacement volume of water each time a representative subsample of the washed filter cake was submitted for chemical analysis. The remainder of the filter cake was forwarded to cyanidation. The bio-oxidation liquor would have to be neutralized prior to disposal, but no neutralization testwork was conducted at this stage. The results of bio-oxidation are provided in Table 13-14.
Table 13-14 Bio-Oxidation Testing Results
| | | | | | | | |
| Test No. | Days | Sulphide Oxidation % |
| BAT-2 | 18 | 60.6 |
| BAT-3 | 26 | 88.0 |
| BAT-1 | 35 | 92.8 |
Sulphide oxidation improved with increased retention time, ranging from 60.6% for the 18-day test to 92.8% for the 35-day test. It should be noted that a 35-day residence time in a batch test translates to an ~5-day retention in a continuous process.
The results of CIL on the bio-oxidation residue are provided in Table 13-15.
Table 13-15 Bio-Oxidation Residue CIL Results
| | | | | | | | | | | | | | | | | | | | | | | |
| Sample | Test No. | Reagent Added kg/t CN Feed | Reagent Cons. kg/t of CN Feed) | Au Extraction % | Ag Extraction % |
| NaCN | CaO | NaCN | CaO |
| BAT-2 Residue | CIL 4 | 17.7 | 9.0 | 7.9 | 8.8 | 75.2 | 75.5 |
| BAT-3 Residue | CIL6 | 15.3 | 11.4 | 8.8 | 11.2 | 82.2 | 40.1 |
| BAT-1 Residue | CIL 7 | 23.6 | 16.2 | 23.4 | 16.2 | 85.1 | 37.0 |
AYA GOLD & SILVER INC., BOUMADINE POLYMETALLIC PROJECT 114
The CIL gold extractions improved from 75 to 85% with the longer oxidation period (i.e. higher sulphide oxidation), however silver extractions decreased drastically. This result is most likely due to jarosite formation and may be overcome with the inclusion of a lime boil stage.
Reagent consumption in the CIL tests was very high. High cyanide consumption in commercial bacterial leaching plants is generally associated with the formation of elemental sulphur as an intermediate sulphide oxidation product in the BIOX process, and the reaction between cyanide and sulphur to produce thiocyanate ions in solution.
Roast-CIL Testing
Five roasting tests were completed on the pyrite concentrate. The tests were conducted in a static muffle furnace under various roasting conditions (changing the number of stages, temperature and/or aeration). The samples were rabbled every 15 minutes. The results are summarized in Table 13-16.
Table 13-16 Roast Testing Results
| | | | | | | | |
| Test | Roast Conditions | Sulphide Oxidation % |
| RST-1 | 1st stage 400°C and 2nd stage 700°C | 99.9 |
| RST-2 | 1st stage 400°C and 2nd stage 600°C | 97.6 |
| RST-3 | 1st stage 400°C, 2nd stage 600°C with 1L/min oxygen, 3rd stage 600°C with 2L/min oxygen | 99.8 |
| RST-6 | 1-stage 500°C | 89.3 |
| RST-7 | 1-stage 600°C | 95.1 |
The results showed that oxidation improved with more than one roasting stage with higher temperatures. While oxidation was high with aeration, only one trial was conducted so it is difficult to attribute the results to aeration versus the longer retention time and temperature.
The roasted product from each trial was then split in half, with one half left as-is, and the other half reground in a lab attrition mill to a D80 of <10 μm. The calcines were then subjected to standard CIL cyanidation tests. Results of the CIL tests are provided in Table 13-17.
Table 13-17 Roast Residue CIL Results
| | | | | | | | | | | | | | | | | | | | | | | |
| Sample | P80 µm | Reagent Added kg/t CN Feed | Reagent Cons. kg/t of CN Feed | Au Extraction % | Ag Extraction % |
| NaCN | CaO | NaCN | CaO |
| RST 1 Calcine | 46 | 21.9 | 12.0 | 6.5 | 12.0 | 61.1 | 19.9 |
| 7.4 | 24.0 | 6.9 | 4.8 | 6.6 | 71.1 | 44.9 |
| RST 2 Calcine | 41.5 | 24.1 | - | 13.3 | - | 55.6 | 65.9 |
| 6.7 | 31.4 | 12.2 | 12.7 | 12.2 | 65.9 | 60.3 |
| RST 3 Calcine | 44.3 | 27.3 | 8.6 | 10.3 | 8.6 | 59.3 | 32.5 |
| 7.5 | 27.3 | 5.9 | 5.1 | 5.5 | 66.7 | 51.6 |
| RST 6 Calcine | 51.3 | 29.1 | 34.7 | 13.6 | 34.7 | 52.5 | 51.8 |
| 8.1 | 37.2 | 14.6 | 22.5 | 14.6 | 63.9 | 61.8 |
| RST 7 Calcine | 36.5 | 30.5 | 13.5 | 13.9 | 13.5 | 56.4 | 29.6 |
| 5.9 | 26.8 | 9.3 | 11.8 | 9.1 | 66.7 | 50.4 |
Gold extraction from the calcines was poor, ranging from 55.6% to 71.1%, whereas silver extraction ranged from 19.9% to 60.3%. SGS stated that they were uncertain why gold and silver extractions were so poor, even after near complete oxidation of the sulphides. The formation of an impervious molten phase during the roasting process was suggested as a possibility.
AYA GOLD & SILVER INC., BOUMADINE POLYMETALLIC PROJECT 115
13.1.4SGS Testwork Program – 2023-2024
In 2024, more testing was conducted by SGS on the Main Composite and the pyrite concentrate composite produced during lock-cycle testing obtained from the previous 2022 program. The main objective of the 2024 program was to investigate methods of separating the arsenopyrite from the pyrite in the sulphide concentrate prior to oxidative treatment. The idea was that improving the gold grade and Au:S ratio would enhance the economics of sulphide oxidation by separating the higher gold grade / lower sulphide grade arsenopyrite from the pyrite in the pyrite concentrate. By treating the two streams separately, favorable conditions for each could be discerned to produce a more optimized and economic process. Several methods were tested, including gravity separation and Jameson Cell flotation.
After none of the tested methods proved suitable, the 2024 program was then re-focused on the pre-oxidation of the concentrate prior to cyanide leaching. A locked cycle test was completed on the Main Composite to produce a lead concentrate for mineralogy and a pyrite concentrate for pressure oxidation and roasting. The oxidative tests were performed to verify the recoveries achieved in previous programs between 2018-2022.
13.1.4.1Mineralogy Testing
The pyrite concentrate from the 2022 locked cycle tests had been submitted for chemical analysis at that time but was submitted for bulk mineralogy analysis as part of the 2024 testwork. The main sulphide in the sample was pyrite with trace pyrrhotite, followed by minor arsenopyrite, and sphalerite. Quartz and muscovite were the main silicates. The liberation of Fe-sulphides (pyrite and pyrrhotite) was very good at 98%, and that of arsenopyrite was 87%. Approximately 7% of the arsenopyrite was associated with Fe-sulphides. The P80 of Fe-sulphides was 41 μm; that of arsenopyrite was 38 μm.
Eighty-three gold grains were identified, ranging in size from <3 to10 μm. The gold minerals were associated mainly with pyrite and arsenopyrite and they occurred as poorly exposed attachments (47%) and locked inclusions (53%) in the sulphides. This indicated that very fine regrinding would be required to liberate or expose the gold minerals associated with the sulphides. The submicroscopic gold would not be amenable to cyanidation, while the poorly exposed gold attachments would be theoretically amenable to cyanidation.
D-SIMS analysis of pyrite yielded an average gold concentration of 1.62 ppm, and of arsenopyrite 13.5 ppm. The total amount of gold (both microscopic and submicroscopic) associated with Fe-sulphides accounted for 63%, arsenopyrite 14%, and both Fe-sulphides and arsenopyrite 18%. More than 95% of the total microscopic and submicroscopic gold was associated with Fe-sulphides and arsenopyrite. Therefore, recovery of the sulphides will also yield the maximum recovery of gold.
A total of 474 silver grains were identified, including acanthite (argentite), native silver, Ag-Cu-Sb sulphides / sulfosalts, and hessite. The silver was not liberated and mainly associated with iron sulphides (83.6%), arsenopyrite (3.5%), complex particles (10.9%), and with iron sulphides and arsenopyrite (1.8%). Approximately 17% of the silver minerals occurred as inclusions while the remainder (83%) were variably exposed. Silver minerals were fine and ranged in size from <3 to 15 µm.
13.1.4.2Gravity Separation Testing
Two 91 g aliquots of the pyrite concentrate were used to determine the potential for upgrading the gold and reducing the arsenic grade using a Mozley Mineral Separator table. One of the aliquots was ground in a lab attrition mill to a D80 grind size of 7 µm while the other was tested without a regrind. A Mozley concentrate and three Mozley middling samples, along with the Mozley tailings, were collected, filtered, dried, and assayed for Au, Ag, and As. The gold and arsenic recovery were calculated, and their relationship was plotted. It was observed that gold followed the arsenopyrite, indicating no separation of arsenic was achieved.
AYA GOLD & SILVER INC., BOUMADINE POLYMETALLIC PROJECT 116
13.1.4.3Flotation Testing
Open Circuit Batch Cleaner Flotation
A 2 kg test charge of the Main Composite was ground in a laboratory rod mill at 60% solids for 70 minutes obtaining a P80 particle size of 58 µm. The mill discharge was subjected to lead rougher flotation followed by zinc rougher flotation before producing a pyrite rougher concentrate from the zinc rougher tailings, using conditions established in the 2022 testwork campaign. The pyrite rougher concentrate was reground to 37 µm in a laboratory rod mill with ceramic media. The reground concentrate was cleaned in three stages and with a first cleaner scavenger. The flowsheet of the open circuit batch cleaner flotation test is presented in Figure 13-3.
Figure 13-3 Cleaner Flotation Flowsheet for Separating Arsenopyrite / Pyrite
Similar to the gravity separation tests, the Au:S ratio was not improved. While the pyrite 3rd cleaner concentrate gold grade increased from 1.41 g/t Au to 4.34 g/t Au, the sulphur grade increased even more, from 9.8% to 52.9%. Significant gold losses were observed in the cleaning stages.
Jameson Cell Dilution Test
A bench flotation test was performed to evaluate the potential of a Jameson flotation cell to upgrade gold in a cleaner application. This test followed the bench dilution test procedures supplied by Glencore Technologies in which dilute flotation conditions are used to simulate the effects of wash water on the system. A sequential test was performed to remove the lead and zinc first, then the tailings were used to evaluate the pyrite cleaner circuit.
The results indicated no benefit to dilution cleaning of the pyrite concentrate, but there was a slight improvement comparing to cleaner flotation.
Arsenopyrite-Pyrite Separation Testing
A 4 kg test charge of the Main Composite was ground to a P80 of 58 µm in a laboratory rod mill. The mill discharge was subjected to sequential lead, zinc and pyrite rougher flotation to produce enough pyrite concentrate for several tests that would investigate separating arsenopyrite from the pyrite. The obtained pyrite concentrate was split into four equal aliquots for the testwork.
Various reagent combinations were examined during the tests. The most promising results were observed using a simple combination of lime, copper sulphate and xanthate at a high pH, with 80% of the arsenic reporting to the concentrate. However, there was no significant improvement in the gold grades in the concentrate in these tests, and there was a direct correlation between gold and sulphur recoveries with R2 values very close to 1.
AYA GOLD & SILVER INC., BOUMADINE POLYMETALLIC PROJECT 117
Locked Cycle Test
A single 6-cycle locked cycle test was completed to produce pyrite concentrate for POX and roasting tests, using the same flowsheet as the 2022 locked cycle test. The same test conditions from the 2022 locked-cycle test were used, including residence times and reagent additions (all conditions are shown in Table 13-7). The only variance was lime addition, which was added to the zinc circuit as required to maintain the target pH. The results are summarized in Table 13-18.
AYA GOLD & SILVER INC., BOUMADINE POLYMETALLIC PROJECT 118
Table 13-18 Locked Cycle Test Results Summary
| | | | | | | | | | | | | | | | | | | | | | | | | | | | | | | | | | | | | | | | | |
| Product | Weight % | Assays | % Distribution |
| Cu % | Pb % | Zn % | S % | Au g/t | Ag g/t | Cu | Pb | Zn | S | Au | Ag |
| Pb Conc | 2.1 | 6.02 | 32.5 | 4.36 | 30.3 | 32.0 | 2,244 | 71.4 | 79.4 | 4.9 | 2.4 | 21.0 | 47.7 |
| Zn Conc | 2.6 | 0.41 | 0.80 | 56.6 | 32.6 | 1.35 | 220 | 6.0 | 2.4 | 77.4 | 3.2 | 1.1 | 5.7 |
| Pyrite Conc | 52.1 | 0.07 | 0.22 | 0.59 | 46.2 | 4.61 | 83.5 | 20.2 | 13.3 | 16.2 | 90.0 | 73.7 | 43.2 |
| Pyrite Tails | 43.2 | 0.01 | 0.1 | 0.07 | 2.73 | 0.31 | 7.78 | 2.4 | 4.9 | 1.5 | 4.4 | 4.1 | 3.3 |
| Head (calc) | 100.0 | 0.18 | 0.88 | 1.91 | 26.8 | 3.25 | 101 | 100.0 | 100.0 | 100.0 | 100.0 | 100.0 | 100.0 |
| Head (direct) | - | 0.19 | 1.00 | 2.25 | 26.5* | 3.33 | 113 | - | - | - | - | - | - |
AYA GOLD & SILVER INC., BOUMADINE POLYMETALLIC PROJECT 119
The results were similar to results from the previous 2022 program by SGS (shown in Table 13-8), further validating the test conditions. The gold, silver and sulphur grades and recoveries were slightly higher, and the gold and sulphur ratios in the pyrite concentrates were essentially the same (0.09 and 0.1, respectively).
With a significant silver grade, the lead concentrate from the third cleaner was submitted for silver mineralogy. The analysis found that the silver was fine-grained with most particles in tetrahedrite form, ranging widely from 0.6 to 31% w/w Ag.
13.1.4.4Pyrite Oxidative Treatment Testing
To verify the previous test results, one roast test and one POX test were conducted on the locked-cycle pyrite concentrate samples.
Roast-CIL Testing
A total of 500 g of concentrate was roasted in two 250 g batches as a two-stage roasting process, in a static muffle furnace. Each stage was two hours, and the sample was rabbled every 15 minutes. The first stage was conducted at 400°C and the second was at 700°C. Neither stage was aerated. Both batches were able to achieve sulphide oxidation of 99.9%.
After the roast, the two calcines were blended and split in half. One half was left as-is and the other half was reground in a lab attrition mill to a D80 particle size of 4 µm. The calcines were then subjected to a standard cyanidation / CIL test. The results are summarized in Table 13-19.
Table 13-19 Roast Residue CIL Results
| | | | | | | | | | | | | | | | | | | | | | | | | | |
| Sample | P80 µ | Test No. | Reagent Added kg/t CN Feed | Reagent Cons. kg/t of CN Feed | Au Extraction % | Ag Extraction % |
| NaCN | CaO | NaCN | CaO |
| Roast Calcine | 49 | CIL 2 | 5.84 | 5.97 | 0.62 | 5.97 | 73.0 | 11.3 |
| 4 | CIL 3 | 7.6 | 5.39 | 2.81 | 5.39 | 80.4 | 30.2 |
Gold recovery was 80% from the finely ground calcine by CIL and 73% from the as-received calcine. Silver recoveries were lower at 11.3% and 30.2% for the coarse and fine sizes, respectively. The comparative test from the previous program achieved a gold recovery of 71.1% and silver recovery of 44.9% after grinding to 7.4 µm (shown in Table 13-16).
It was also observed that the addition and consumption of NaCN and CaO for the program were significantly lower than the previous program (results shown in Table 13.2.16). There was no explanation on this discrepancy in the SGS report and requires further investigation. The lesser quantity of reagent added and consumed could have led to the significant drop of silver recoveries observed in the 2024 test program.
POX-HC-LB-CIL Testing
Due to the high sulphide content in the feed, the POX test was conducted at 8% w/w pulp density in DI water to simulate autothermal heating conditions in the autoclave. The pulp was pre-acidulated for 30 minutes at a pH of 1.5, and then it was sealed and heated to the target temperature of 225°C. The test was run for 690 kPa of oxygen over-pressure applied.
After the pressure oxidation test, the pulp was subjected to hot curing to re-dissolve the basic iron sulphate to reduce the lime consumption in the subsequent CIL step. The hot curing process involved heating the pulp to 95°C for four hours in the autoclave. An 80% weight loss was observed when the iron sulphates were re-dissolved, upgrading the gold and silver grades to 19.5 g/t and 430 kg/t, respectively. 96.5% of the sulphur was oxidized during the POX step.
AYA GOLD & SILVER INC., BOUMADINE POLYMETALLIC PROJECT 120
After the hot cure, lime boiling was conducted to break down the silver jarosite formed during POX, since it is refractory to cyanidation. The washed hot cure residue was pulped to 10% w/w solids and boiled at 95°C for 6 hours with 294 kg/t feed of CaO added, relative to the lime boil feed (46 kg/t based on the POX feed). The lime addition rate was based on the estimated sulphate concentration of the hot cure residue. Following the lime boil, the pulp was sent to CIL testing.
CIL testing of the POX-HC-LB pulp resulted in extractions of 96.9% Au and 93.4% Ag. These results compared well with the previous test program results, through which 98.2% of the contained gold and 96.6% of the contained silver were extracted (results shown in Table 13-4).
13.1.5AFRILAB 2023 Sample Campaign
The African Laboratory for Mining and Environment (AFRILAB) assayed 117 samples to determine the total sulfur content in each. Silver, zinc, lead, and iron content were determined by XRF analysis on drill cores logged by the exploration team. The results of the 2023 Sample Campaign were used to produce a sulphur content model based on elemental compositions and mineralogical associations. The multi-linear regression analysis indicated a strong correlation (R² = 0.98) between the calculated values and the actual laboratory test results, demonstrating the development of a valid relationship between the metal elements' content and the total sulfur content. The equation and graph representing this correlation are shown in Equation 13.2.1 and Figure 13-4, respectively.
 Figure 13-4 Correlation Between Analyzed and Calculated Sulphur Content
AYA GOLD & SILVER INC., BOUMADINE POLYMETALLIC PROJECT 121
13.1.6BGRIMM 2025 Testwork Program
In 2025 BGRIMM was contracted to perform further testwork on SGS produced samples with the primary tasks included conducting fundamental test analyses of the sample and performing experimental studies on processes such as roasting and cyanidation for gold leaching of the pyrite concentrate. The objective was to determine the optimal process conditions and parameters for the main flowsheet, thereby achieving the highest leaching recovery rates for gold and silver under the best process conditions.
SGS prepared the BGRIMM sample utilising the test conditions identified in the 2022 and 2023 locked cycle tests. It should be noted the bulk flotation conditions were open circuit resulting in slightly lower gold and silver in the pyrite concentrate than would be expected.
Table 13-20 SGS Bulk Flotation Results
| | | | | | | | | | | | | | | | | | | | | | | |
| Product | Assays, %, g/t |
| Pb | Zn | Fe | As | S= | Au | Ag |
| Pb Ro Conc | 9.57 | 5.33 | 27.4 | 2.68 | 33.6 | 15.5 | 711 |
| Zn Ro Conc | 0.56 | 29.1 | 10.8 | 0.95 | 30 | 2.17 | 128 |
| Py Ro Conc | 0.28 | 0.23 | 40.9 | 1.8 | 44.4 | 4.1 | 46.6 |
| Pyrite Rougher Tails | 0.06 | 0.07 | 2.54 | 0.091 | 1.16 | 0.19 | 7.9 |
| Head (calc.) | 0.88 | 1.86 | 19.2 | 0.97 | 21.1 | 2.9 | 81 |
| Head (direct) | 0.88 | 2.45 | 19.7 | 1.03 | 22.5 | 4.11 | 96 |
13.1.6.1Feed Sample Properties
BGRIMM received 60 kg of the bulk pyrite concentrate, measuring a d(0.9) particle size of 77.53 µm, true density of 4491.2 kg/m3, and elemental analysis provided in Table 13-21.
Table 13-21 Elemental Analysis Results of Pyrite Concentrate (%)
| | | | | | | | | | | | | | | | | | | | | | | | | | | | | | | | |
| Element | Au(g/t) | Ag(g/t) | As | Fe | S | C | Si | Al | Mg | Sb |
| Content | 3.96 | 80.10 | 1.86 | 37.95 | 45.64 | 0.044 | 3.24 | 0.65 | 0.067 | 0.021 |
| Element | Pb | Ca | Cd | Bi | Ti | Bi | Zn | Mn | Cu | Sn |
| Content | 0.22 | 0.082 | 0.021 | 0.007 | 0.017 | 0.007 | 0.24 | 0.0086 | 0.063 | 0.011 |
X-ray diffraction analysis indicated the received sampled primarily contains pyrite as the dominant mineral phase with a minor presence of a mica mineral phase, while chemical phase analysis of gold indicated that the majority of gold is encapsulated with ~15% of the gold exposed.
13.1.6.2Roasting Condition Testing
Single Stage Roasting Condition Test
To investigate the roasting behavior of this pyrite concentrate and determine the optimal single-stage roasting temperature, single-stage roasting temperature experiments were conducted at temperatures ranging from 500 - 950℃ under a strongly oxidizing atmosphere to ensure complete reaction at each temperature.
The primary objective of roasting under a strongly oxidizing atmosphere is to remove sulfur (S). Experimental results indicate that as the roasting temperature increases, the calcine yield gradually declines, the arsenic (As) removal rate initially decreases and then rises, while the sulfur (S) removal rate generally exhibits an upward trend.
As the temperature increases, the Pb volatilization rate rises. When the roasting temperature exceeds 650℃, the Pb volatilization rate from the material accelerates significantly. Pb vapor tends to cause clogging and
AYA GOLD & SILVER INC., BOUMADINE POLYMETALLIC PROJECT 122
corrosion of equipment pipelines. Moreover, Pb volatilization may entrain fine gold particles into the flue gas, resulting in gold losses. Therefore, the roasting temperature should be maintained below 650℃.
Each roasting product was grinded and further subjected to 48 h leach tests at 33% w/w pulp density and 6 kg/t NaCN with the results indicated in Figure 13-5.
Figure 13-5 Au and Ag Leach Rates at Different Roasting Temperatures
As the temperature gradually increases, the Au leaching rate first rises and then declines, reaching a maximum of ~56% at approximately 630℃. In contrast, the Ag leaching rate decreases progressively with increasing temperature, peaking at ~48% at 500℃. Based on this evaluation, the optimal single stage roasting temperature for this pyrite concentrate is determined to be 630℃.
Two Stage Roasting Condition Test
Building on the single stage roasting test, a two-stage roasting temperature condition tests were conducted under varying first stage calcination temperatures (450-630 ⁰C), with the first stage using a weakly oxidizing atmosphere and the second stage a strongly oxidizing atmosphere. Each roasting step was performed for 2 hours.
The experimental results indicate that when the second-stage calcination temperature is fixed at 630℃, variations in the first-stage calcination temperature have minimal impact on calcine yield, desulfurization rate, and deleading rate. The calcine yield remains stable between 70%~71%, while the desulfurization rate consistently stays around 99.5%. However, the first-stage calcination temperature significantly affects arsenic (As) removal efficiency. The arsenic removal rate initially increases and then decreases with rising temperature, reaching a maximum of 86.34% at a calcination temperature of 580℃.
AYA GOLD & SILVER INC., BOUMADINE POLYMETALLIC PROJECT 123
Leaching was performed on the two stage roasted product at the same conditions used for the single stage roast products. The experimental results demonstrate that when the first stage calcination temperature is set at 530℃, the leaching rate of gold (Au) reaches its highest value of ~63%, while the silver (Ag) leaching rate under these conditions is ~46%. After comprehensive evaluation, the calcination method for this concentrate was determined to be a two-stage process at 530-630℃.
Roasting Time Condition Test
Under the optimal two stage roasting temperature conditions, the roasting time for each stage was set in 30 min increments from 30 min to 3 hours. According to the test results, as the roasting duration increases, the calcine yield gradually decreases, while the removal rates of As and S generally show an upward trend. When the roasting time exceeds 2hours, the sulfur content in the calcine essentially ceases to decrease. When the roasting time exceeds 2.5hours, the arsenic removal rate no longer shows significant improvement.
Utilizing the same leaching conditions the test results indicated, as the roasting time increases, the leaching rates of gold and silver gradually rise. When the total time of the two stage roasting exceeds 2.5 hours, the leaching rates of Au and Ag from the calcine basically stop increasing. Therefore, the optimal roasting time for each stage is determined to be 2.5 hours.
Sodium Roasting Exploratory Test
"Sodium roasting" is an important technology in mineral processing and metallurgical pretreatment. Its core idea is: at high temperatures (usually in the range of 500-1000℃), sodium salts are added to mineral raw materials, causing them to chemically react with the target components or impurities in the raw materials. This changes the chemical form or physical properties of the target components, making them easier for subsequent leaching, separation, or purification. "Sodium roasting" also plays a certain role in the oxidative pretreatment of some refractory gold ores (encapsulated in sulfides, arsenides, or silicates).
Three samplers were roasting, a no additive control sample, one with sodium carbonate, and one with sodium hydroxide at the two stage roasting conditions already determined. The results indicate that the addition of sodium salts leads to an increase in calcine yield but a decrease in the removal rates of harmful elements.
Leaching of the products indicate that soda roasting does not improve the gold leaching rate but significantly enhances the silver leaching. However, the high content of harmful elements in the iron concentrate after soda roasting compromises its quality. Consequently, the addition of sodium salts for roasting is not recommended.
Hydrated Lime Roasting Exploratory Test
Addition of 6 g of Ca(OH)2 with 100 g pyrite concentrate sample and utilizing the optimum roasting, acid-, and cyanide leaching conditions resulted in reduction of sulfur and arsenic removal rate as well as a reduction of ~12% gold extraction rate and ~14% silver extraction rate. Roasting with hydrated lime is not recommended at this stage.
13.1.6.3Cyanidation Pre-Treatment Testing
A large quantity of calcine was produced under optimal roasting conditions (530 ⁰C for 2.5 hours, and 630 ⁰C for 2.5 hours) for subsequent experiments achieving an average calcine yield rate of 69.7%.
Leach vs CIL Testing
Test conditions were grinding to P90 30µm, 33%w/w solids, pH 11, 6kg/t NaCN at 48 hour leaching, with and without 20 g/L activated carbon.
The results show either leaching method is suitable for this material, with similar extraction raters for with and without activated carbon addition.
AYA GOLD & SILVER INC., BOUMADINE POLYMETALLIC PROJECT 124
Grind Sensitivity Testing
The same leaching conditions were used but the grind size was varied from P90 0.3-4µm. The results indicated that the material had to be ground to below 1µm to see some improvement in gold recovery with no difference in silver recovery. The energy requirements and material handling would be cost prohibitive to explore further at industrial scale.
Cyanidation Pre-Treatment Testing
Utilizing the established leaching conditions in the leach vs CIL testing, four pre-treatments methods were tested to establish the effect on the final leach rates, namely:
1.Roasting – Cyanidation
2.Roasting – Water Quenching – Cyanidation
3.Roasting – Acid Leaching – Cyanidation
4.Roasting – Water Quenching – Acid Leaching – Cyanidation
Roasting conditions were the established optimum, and leaching conditions were pH of 1, liquid-to-solid ration of 4, at 90 ⁰C for 4 hours. Results are shown in Table 13-22.
Table 13-22 Cyanidation Pre-Treatment Evaluation
| | | | | | | | | | | | | | | | | | | | | | | | | | |
No
| Calcine Yield(%) | Acid Leaching Residue Rate(%) | Gold Grade(g/t) | Gold Leaching Rate
(%) | Silver Grade(g/t) | Silver Leaching Rate
(%) |
| Raw Material | Cyanidation Residue | Raw Material | Cyanidation Residue |
| 1 | 69.73 | - | 3.96 | 1.98 | 65.14 | 80.10 | 58.10 | 49.42 |
| 2 | 69.73 | - | 3.96 | 1.88 | 66.90 | 80.10 | 59.60 | 48.12 |
| 3 | 69.73 | 95.34 | 3.96 | 1.82 | 69.45 | 80.10 | 43.00 | 64.31 |
| 4 | 69.73 | 94.08 | 3.96 | 1.72 | 71.51 | 80.10 | 43.90 | 64.05 |
Water quenching improves gold recovery by ~1% and acid leaching improves gold and silver recovery by ~5% and ~15% respectively. It is recommended to adopt the roasting-water quenching-acid leaching-cyanidation process for the pretreatment of pyrite concentrate.
13.1.6.4Acid Leaching Condition Testing
Liquid-to-Solid Ratio Testing
The liquid-to-solid ratio during acid leaching is one of the critical factors governing the effectiveness of both acid leaching and subsequent cyanidation leaching processes. If the liquid-to-solid ratio is too low, the fluidity of the acid solution becomes poor, potentially leading to insufficient contact between the acid and the slurry, incomplete reactions, and low impurity removal efficiency. Conversely, if the liquid-to-solid ratio is too high, excessive acid solution may be used, increasing the costs associated with subsequent filtration and waste acid treatment. Therefore, it is necessary to determine the optimal acid leaching liquid-to-solid ratio experimentally.
Test conditions for leaching were pH 1 with sulfuric acid, 90 ⁰C, 4 hour acid leach time with varying L/S ratios (4:1, 5:1, 6:1, and 7:1), followed by the established cyanide leaching conditions. Based on the test results a L/S ratio of 6:1 is recommended for acid leaching.
Temperature Condition Testing
AYA GOLD & SILVER INC., BOUMADINE POLYMETALLIC PROJECT 125
Maintaining the previous acid leaching (with L/S ratio of 6:1) and cyanidation leaching test conditions and varying the acid leach temperature from 60 – 90 ⁰C in 10 ⁰C increments, indicated that the gold and silver leach extraction gradually increase with increasing acid leaching temperature. By increase the temperature from 60 to 90 ⁰C the gold and silver leach rate increased by ~2% respectively.
Leach Time Testing
Maintaining the previous acid leaching (with 90 ⁰C Temperature) and cyanidation leaching test conditions and varying acid leach time from 1 to 5 hours in 1 hours increments, indicated that the gold and silver leach extraction increase by ~2% respectively from 1 to 3 hours with no further improvement beyond that.
13.1.6.5Cyanidation Condition Testing
A Bulk sample at the optimum roasting and acid leaching conditions were prepared.
Grind Optimization Testing
Cyanidation leach conditions were set at pH 11 with lime, 6 kg/t NaCN, 33%w/w pulp density, 48 hour leach time and varying the grind from unground (P90 80µm) to P90 38, 22, 17, and 15 µm. The gold extraction increased by ~3% between unground to P90 38µm with no further improvement in the finer grinds and the grind had no effect on the silver extraction rate.
Cyanide Dosing Optimization Testing
Cyanidation leach conditions were set at previous conditions (with P90 at 38 µm) and varying the cyanide dosage rate between 1 to 5 kg/t in 1kg/t increments. Gold extraction was found to improve by ~2% from 1 to 3 kg/t NaCN with no further improvement at higher dosages and silver had a marginal increase in extraction rate from 1 to 2 kg/t NaCN with no increase beyond that.
Leach Time Optimization Testing
Cyanidation leach conditions were set at previous conditions (with 3 kg/t NaCN dosage rate) and varying the leach time from 12 to 48 hours in 12 hour increments. The optimum leach time was determined as 36 hours with ~72% gold dissolution and ~64% silver dissolution.
13.1.6.6Verification Testing
Four tests were performed at the selected optimum conditions, and the repeatability of the results were confirmed.
From the results of the fluidized bed roasting test, in the small-scale fluidized bed roaster, the average calcine yield is 69.27%, the average removal rate of Pb is 11.83%, the average removal rate of S is 99.60%, and the average removal rate of As is 84.08%. The calcine yield and the removal rates of harmful elements are close to those of the muffle furnace roasting results.
From the cyanidation results, after the calcine roasted in the fluidized bed roaster undergoes water quenching, acid leaching, grinding and cyanidation, the average cyanide leaching rate of gold is 72.11% and that of silver is 63.48%, which are consistent with the results of muffle furnace roasting.
13.1.7Hazen 2025 Testwork Program
In 2025 Hazen Research Inc. was contracted to perform roast leach extraction testwork to recover gold and silver from pyrite flotation concentrate with a summary below extracted from the ongoing testwork campaign.
Hazen has trialed varying temperatures, roasting gas compositions, additives, and additional grinding prior to leaching. The testwork campaign is still ongoing with gold recoveries ranging from 53 to 80% and silver recoveries ranging from 25 to 86%, preliminary observations as follow:
AYA GOLD & SILVER INC., BOUMADINE POLYMETALLIC PROJECT 126
Reducing roast with nitrogen feed gas did not improve metal recoveries.
6% Lime addition improved silver recovery by 23.5%.
Increasing roasting temperature (600 to 800 ⁰C) reduced gold and silver recoveries by ~50% and ~40% respectively. Sintering of the material is expected to be the cause of the sharp decrease in recoveries with 600 to 650 ⁰C was chosen for follow on tests.
Sodium hydroxide shows no improvement over lime with plugging observed and agglomerates formed in the calcine product.
Crushing of the calcine (12 minutes in a ring and puck mill) prior to leaching provided inconsistent results with questionable PSD measurements of the material.
Gold and silver balances were overall poor, 77 to 125% and 69 to 111% respectively, likely due to the "nugget" effect.
13.2Results Interpretation and Conclusions
This section describes how the results presented in Section 13.2 have been interpreted and used in the development of the process design criteria. At the time that the process design criteria were being developed, only preliminary results from the SGS 2022 and SGS 2024 locked-cycle testing campaigns were available, so these results were used with the intention that future testwork results would be confirmatory. The criteria developed from these results are outlined in Table 17-1 in Chapter 17. Orway Mineral Consultants, a subsidiary of Lycopodium, provided the design for the comminution circuit.
13.2.1Mineralogy / Metallurgy
The head grades used in the process plant design were the calculated head grades from the 2022 locked cycle tests flotation tests conducted by SGS (detailed in Section 13.2.4). The selection of these grades allows for complete metallurgical accounting and direct alignment with reagents consumed during testwork and the recoveries observed.
13.2.2Comminution Design
OMC used its testwork database to infer missing data and to recommend further testwork for subsequent studies. While both BWi values from testwork fell outside the database range for other similar resources in the area, the average BWi fell at the 81st percentile of the range, aligning well with OMC’s typical strategy of designing to the 85th percentile hardness. As such, the average of both test results was used in the comminution circuit design (13.1 kWh/t). The remainder of the comminution circuit design criteria were estimated from OMC’s database.
13.2.3Flotation Circuit Design
The conditions tested during the 2022 and 2024 SGS locked cycle testing campaigns were used as the basis for the concentrate recovery circuit design, since the testing incorporated recycles at steady state and produced concentrates of acceptable grade and recovery (detailed in Section 13.1.3.5 and Section 13.1.4.3 respectively). Using locked cycle data provides a higher design certainty since it more closely represents plant operation by the incorporation of recycles and since it validates the process conditions at steady state.
The design criteria derived from the 2022 and 2024 locked cycle testing includes:
•General circuit design (i.e. orientation, number of stages, implementation of regrinding).
AYA GOLD & SILVER INC., BOUMADINE POLYMETALLIC PROJECT 127
•Reagent addition.
•Concentrate mass pulls, grades and recoveries.
•Residence times.
The flotation recoveries for the various metals were applied to the head grades from the mine plan to estimate annual concentrate productions. The lead, zinc and sulphur grades from the locked-cycle tests were used to determine the production rates of lead, zinc and pyrite concentrates, respectively. The gold and silver grades of each concentrate was then calculated using the recovery of the metals to each concentrate, based on the locked-cycle tests.
13.2.4Pyrite Concentrate Production
The correlation developed between the total sulphur and metals’ content in the drill core samples (Equation 13.2.1, described in Section 13.1.5) was used to develop a model to estimate the life of mine pyrite concentrate produced, assuming constant concentrate grades and recoveries based on SGS locked cycle testing (2022 and 2024). This model was applied to the project financial model to estimate pyrite concentrate production based on the mine plan. The details of the financial model are further discussed in Chapter 22.
13.2.5Pyrite Concentrate Treatment
Throughout recent testwork campaigns, several methods of oxidizing and leaching the pyrite concentrate were trialled to achieve the highest recoveries of gold and silver (while minimizing costs associated with reagent consumption, energy required, and residence time). Leaching tests to date have shown that the material is highly refractory and resistant to direct cyanidation for gold and silver recovery. A comparison of tested methods is provided in Table 13-23 (including only testwork conducted on fresh material, excluding the historic tailings).
AYA GOLD & SILVER INC., BOUMADINE POLYMETALLIC PROJECT 128
Table 13-23 Comparison of Pyrite Treatment Methods
| | | | | | | | | | | | | | | | | | | | | | | | | | | | | |
| Treatment Process | Testwork Campaign | Process Conditions | Sulphide Oxidation % | Au Extraction1 % | Ag Extraction1 % | NaCN Added kg/t feed | Lime Added kg/t feed | NaCN Consumed kg/t feed | Lime Consumed kg/t feed |
| Direct Cyanidation (CIL) | SGS 2018 | 30 h pre-aeration, 40% pulp density, 48-h leach | N/A | 19 | 58 | 12.3 | 31.3 | 9.96 | 31.3 |
| 30 h pre-aeration, 40% pulp density, 48-h leach | N/A | 32 | 70 | 12.1 | 29.8 | 7.99 | 29.7 |
| SGS 2019 | D80 4.47 µm, 40% pulp density | N/A | 17.3 | 83.9 | 24.9 | 1.83 | 22.3 | 1.60 |
| SGS 2022 | D80 42 µm, 4-h pre-aeration (pH 10.51, 20 ppm DO, 250 g/t PbNO3), 72-h leach at pH 10.5-11 | N/A | 9.5 | 36.4 | 20.3 | 4.25 | 4.39 | 3.91 |
D80 6.3 µm, 4-h pre-aeration (pH 10.51, 20 ppm DO, 250 g/t PbNO3), 72-h leach at pH 10.5-11 | N/A | 22.4 | 80.2 | 28.5 | 15.4 | 14.5 | 15.3 |
| Mintek 2024 | 24-h leach, 25% solids, 20 g/L CN, DO>10.5, then 8-h CIL | N/A | 29 | 40 | - | - | 2.11 | 39.1 |
| POX-CIL | SGS 2018 | 5.6% pulp density, pre-acidulation (pH 1.25), 225°C, 690 kPa, 120 min | 99 | 97.4 | 49.2 | 7.24 | 320.8 | 3.55 | 320.8 |
| 5.6% pulp density, pre-acidulation (pH 1.39), 225°C, 690 kPa, 60 min, hot cure | 99 | 97.6 | 1.2 | 6.56 | 16.8 | 4.45 | 16.8 |
| 5.6% pulp density, pre-acidulation (pH 1.30), 225°C, 690 kPa, 60 min, hot cure and lime boil | - | 98.2 | 97.6 | 2.11 | 0.6 + 59.2 kg/t for lime boil | 0.90 | 0.6 + 59.2 kg/t for lime boil |
| SGS 2019 | 5.5% pulp density, 30-min pre-acidulation (pH 1.50), 225°C, 690 kPa, 60 min, hot cure and lime boil | 99.8 | 98.2 | 96.6 | 2.23 | 3.98 | 1.52 | 3.98 + 35.8 kg/t for lime boil |
| SGS 2024 | 8% pulp density, 30-min pre-acidulation (pH 1.50), 225°C, 690 kPa, 60 min, hot cure and lime boil | 96.5 | 96.9 | 93.4 | 2.52 | 0 + 46.1 for lime boil | 0.58 | 0 + 46.1 for lime boil |
| Albion-CIL | SGS 2019 | 52-h, 95°C, 10% pulp density, pre-acidulation (pH 4.5), O2 sparge 1 L/min, limestone addition to maintain pH 5.5, 23 kg/t H2SO4 and 440 kg/t CaCO3 | 28% | 45.4 | 84.8 | 3.85 | 11.7 | 3.52 | 11.6 |
72-h, 95°C, 10% pulp density, pre-acidulation (pH 4.5), O2 sparge 1.7 L/min, limestone addition to maintain pH 5.5, 21 kg/t H2SO4 and 1,209 kg/t CaCO3 | 68% | 81.0 | 92.3 | 5.46 | 6.79 | 5.11 | 6.79 |
| SGS 2022 | 96-h, 95°C, D80 6.3 µm, 10% pulp density, limestone addition to maintain pH 5.5 | 96.3 | 94.4 | 94.4 | 7.92 | 2.48 | 3.22 | 2.40 |
72-h, 95°C, D80 10 µm, 10% pulp density, limestone addition to maintain pH 5.5 | 74.7 | 84.9 | 91.3 | 8.25 | 3.32 | 2.29 | 3.27 |
AYA GOLD & SILVER INC., BOUMADINE POLYMETALLIC PROJECT 129
| | | | | | | | | | | | | | | | | | | | | | | | | | | | | |
| Treatment Process | Testwork Campaign | Process Conditions | Sulphide Oxidation % | Au Extraction1 % | Ag Extraction1 % | NaCN Added kg/t feed | Lime Added kg/t feed | NaCN Consumed kg/t feed | Lime Consumed kg/t feed |
| Roast-CIL | SGS 2018 | Two-stage roast, 2 hours per roast, at 400°C and 700°C | 49.6 | 62.5 | 9.1 | 2.82 | 1.16 | 1.02 | 1.16 |
| Two-stage roast, 2 hours per roast, at 400°C and 700°C, ground to <10 µm before CIL | - | 84.8 | 72.5 | 4.17 | 4.29 | 3.91 | 4.27 |
| SGS 2022 | Two-stage roast, 2 hours per roast, at 400°C and 700°C | 99.9 | 61.1 | 19.9 | 21.9 | 12.0 | 6.54 | 12.0 |
| Two-stage roast, 2 hours per roast, at 400°C and 700°C. Pre-CIL re-grind to 7.4 µm | 99.9 | 71.1 | 44.9 | 24.0 | 6.88 | 4.83 | 6.63 |
| Two-stage roast, 2 hours per roast, at 400°C and 600°C | 97.6 | 55.6 | 51.3 | 24.1 | N/A | 13.3 | N/A |
| Two-stage roast, 2 hours per roast, at 400°C and 600°C. Pre-CIL re-grind to 6.7 µm | 97.6 | 65.9 | 60.3 | 31.4 | 12.2 | 12.7 | 12.2 |
Three-stage roast, 2 hours per roast, at 400°C and 600°C (stage 2 and 3). Aeration during 2nd and 3rd stage (1 L/min and 2 L/min) | 99.8 | 59.3 | 32.5 | 27.3 | 8.56 | 10.3 | 8.56 |
Three-stage roast, 2 hours per roast, at 400°C and 600°C (stage 2 and 3). Aeration during 2nd and 3rd stage (1 L/min and 2 L/min). Pre-CIL re-grind to 7.5 µm | 99.8 | 66.7 | 51.6 | 27.3 | 5.93 | 5.10 | 5.54 |
| One-stage roast, 2 hours, at 500°C | 89.3 | 52.5 | 51.8 | 29.1 | 34.7 | 13.6 | 34.7 |
| One-stage roast, 2 hours, at 500°C. Pre-CIL re-grind to 8.1 µm | 89.3 | 63.9 | 61.8 | 37.2 | 14.6 | 22.5 | 14.6 |
| One-stage roast, 2 hours, at 600°C | 95.1 | 56.4 | 29.6 | 30.5 | 13.5 | 13.9 | 13.5 |
| One-stage roast, 2 hours, at 600°C. Pre-CIL re-grind to 5.9 µm | 95.1 | 66.7 | 50.4 | 26.8 | 9.3 | 11.8 | 9.1 |
| SGS 2024 | Two-stage roast, 2 hours per roast, at 400°C and 700°C | 99.9 | 73.0 | 11.3 | 5.84 | 5.97 | 0.62 | 5.97 |
| Two-stage roast, 2 hours per roast, at 400°C and 700°C. Pre-CIL re-grind to 4 µm | 99.9 | 80.4 | 30.2 | 7.6 | 5.39 | 2.81 | 5.39 |
| BGRIMM 2025 | Roasting: Mild oxidative roasting (530 ⁰C, 2.5-h), Intensive oxidative roasting (630 ⁰C, 2.5-h); Water Quenching; Acid Leaching: pH 1, 90 ⁰C, L/S 6:1, 3-h; Cyanide Leaching: P90 38 µm, 3 kg/t NaCN, 36-h, 33% pulp density | 99.6 | 72.0 | 62.9 | 3 | N/A | N/A | 8.75 g/L (Acid Leach)
3.28 kg/t (NaCN Leach) |
Hazen 2025 | Best 3 Tests: Roast at 600 ⁰C with 6% Lime and Air with 10%SO2 gas, crushed, leached, recrushed and releached. | N/A | 77.5 | 84.0 | N/A | N/A | 25.7 | 9.1 |
Average Tests: Roast at 600 ⁰C with 6% Lime and Air with 10%SO2 gas, crushed, leached, (excluding: recrushed and releached) | N/A | 54.4 | 71.8 | N/A | N/A | 8.4 | 14.1 |
AYA GOLD & SILVER INC., BOUMADINE POLYMETALLIC PROJECT 130
| | | | | | | | | | | | | | | | | | | | | | | | | | | | | |
| Treatment Process | Testwork Campaign | Process Conditions | Sulphide Oxidation % | Au Extraction1 % | Ag Extraction1 % | NaCN Added kg/t feed | Lime Added kg/t feed | NaCN Consumed kg/t feed | Lime Consumed kg/t feed |
| BIOX-CIL | SGS 2022 | 24-h stabilization, 18-day residence, 10.5% pulp density, 40°C, air sparge, pH 1.6 | 60.6 | 75.2 | 75.5 | 17.7 | 9.01 | 7.91 | 8.77 |
| 24-h stabilization, 26-day residence, 10.5% pulp density, 40°C, air sparge, pH 1.6 | 88.0 | 82.2 | 40.1 | 15.3 | 11.4 | 8.75 | 11.2 |
| 24-h stabilization, 26-day residence, 10.5% pulp density, 40°C, air sparge, pH 1.6 | 92.8 | 85.1 | 37.0 | 23.6 | 16.2 | 23.4 | 16.2 |
| MACH Reactor-CIL | Mintek 2024 | 6-h pre-oxidation, 4-h boosted leach, 72-h bottle roll cyanidation | 16-18 | 40 | 70 | - | - | 36 | 273 |
| 22-h pre-oxidation, 4-h boosted leach, 72-h bottle roll cyanidation | 54 | 60 | 75 | - | - | 32 | 639 |
AYA GOLD & SILVER INC., BOUMADINE POLYMETALLIC PROJECT 131
13.3Future Testwork Recommendations
The following testwork is recommended to progress the design to the next phase:
Sample Requirement:
•Spatial composites to represent different physical locations throughout the deposit
•Samples from different zones and depths for variability testing.
•Sufficient sample sizes to conduct downstream testwork.
•Number of representative samples to be determined by AGS.
•Sufficient sample size to generate representative concentrate samples for off-taker evaluation.
Comminution Testwork:
•Additional tests to determine:
•Crushing work index (CWi)
•SMC parameters: abrasivity (Ai) and impact breakage (A x b)
•BWi (confirmatory)
•Variability of these parameters throughout the deposit and determine correlations to lithology.
•Flotation regrind tests to determine specific energy; engage with vendors for criteria relating to equipment sizing and specifications.
Ore Characterization Testwork:
•Assess material variability by assaying samples from different zones without blending according to mine plan and to create design ranges.
•Particle size distribution of ROM material and of final concentrates in support of dewatering testwork.
•Rheology testwork to determine apparent viscosities at varying shear rates and varying slurry % solids in support of slurry pipe and pump design.
•Physical characteristics impacting material handling, such as feed moisture content, specific gravity, bulk density, and stacking and clumping / compaction properties.
Flotation Testwork:
•Variability testing – open circuit and locked cycle to determine the impacts of feed variance and process upsets on grades and recoveries. Develop relations between open circuit and locked cycle results
•Produce enough of each concentrate to support dewatering testwork and further pyrite concentrate treatment testwork.
Dewatering Testwork:
•Particle settling testwork to determine the flux rate for thickener sizing.
•Flocculant screening tests.
•Filtration testwork to determine:
•Filter type
•Optimum feed pulp density
•Achievable cake moisture levels
AYA GOLD & SILVER INC., BOUMADINE POLYMETALLIC PROJECT 132
•Transport moisture limit targets
•Filter cycle times
•If any filter aids are required.
Pyrite Concentrate Treatment Testwork:
•Continue development of pyrite oxidation option.
•Assess variability of pyrite concentrate via spatial composites and variability testing.
•Generate sufficient pyrite concentrate for off-taker evaluation.
Water Analysis:
•Surface water quality analysis.
•Ground water quality analysis.
AYA GOLD & SILVER INC., BOUMADINE POLYMETALLIC PROJECT 133
14.0MINERAL RESOURCE ESTIMATES
14.1Introduction
This section describes the 2026 MRE methodology and summarises the key assumptions adopted by SRK during preparation. The resource database provided by Aya to support the MRE was independently reviewed and verified by SRK. SRK considers that the 2026 MRE reported herein provides a reasonable representation of the in situ Ag, Au, Cu, Zn and Pb mineralization based on the current level of geological understanding and the available drilling, sampling and analytical data.
SRK also estimated arsenic (As) and iron (Fe) for mine planning and technical study purposes. However, owing to the lower level of data support for As and the potential for these elements to be associated with multiple mineral assemblages (specifically Fe), SRK has not assigned a Mineral Resource classification to the As and Fe estimates.
A total of 940 drillholes, comprising 356,323.1 m of drilling, are located within the Boumadine Mining Licence. Of these, 855 drillholes, totalling 319,464.8 m, were completed to support Mineral Resource definition and extensions to the known mineralization, which is shown in Figure 14‑1, while the remaining 85 drillholes relate to prospecting within the Mining Licence and did not specifically target the known Boumadine mineralization.
The MRE has been prepared by Guy Dishaw (Principal Consultant, SRK) and James Williams (Senior Resource Geologist) in accordance with the CIM Definition Standards for Mineral Resources and Mineral Reserves (May 2014) and National Instrument 43-101 – Standards of Disclosure for Mineral Projects (May 2016). Guy Dishaw, P.Geo., is a Qualified Person ("QP") for Mineral Resource reporting and completed a site visit to the Project accordance with the requirements of NI 43-101 (Section 12.2.1).
The MRE has been prepared using satellite imagery, core photographs, geological mapping, DD, MP drilling, RC drilling, structural measurements, weathering interpretations, historical as-built depletion solids and associated mine plans, Aya's previous mineralization models, and other supporting geological datasets available.
Leapfrog Geo was used to construct the geological and mineralization models (estimation domains) and prepare the assay data for geostatistical analysis. Maptek Vulcan (Vulcan) was used to construct the block model, estimate metal grades and density values, and incorporate historical underground depletion. Supervisor software was used to assess spatial grade continuity through geostatistical analysis, whilst a combination of Leapfrog, Datamine and Vulcan was used to independently validate the MRE where appropriate. Vulcan was subsequently used to report the Mineral Resource Statement presented in Section 14.2.
Aya developed a Net Smelter Return (NSR) and mining cut-off value calculation for both open pit and underground reporting for the Project, which was independently reviewed by SRK and adopted for reporting the 2026 MRE (Section 14.15). The NSR calculation was used as the basis for the conceptualized open pit optimization, which was undertaken by Aya using Whittle. The open pit optimization was reviewed by SRK. In addition, the NSR values were used to generate underground reporting shells defining potentially mineable mineralization by underground mining methods (small isolated volumes removed).
14.2Mineral Resource Estimation Procedure
The MRE methodology adopted for the Boumadine deposit broadly comprised the following steps:
•compilation, review and validation of the geological, drilling, sampling and analytical databases;
AYA GOLD & SILVER INC., BOUMADINE POLYMETALLIC PROJECT 134
•review of geological mapping, satellite/hyperspectral imagery, geophysical dataset, structural mapping and oriented core data to characterise the geological controls on the orientation, continuity and geometry of the mineralization;
•construction of weathering and oxidation (redox) model;
•construction of geological and estimation domain wireframes (mineralization wireframes), guided by geological mapping, structural measurements from oriented drill core, historical mine plans and as-built depletion surveys, together with Aya’s previous geological interpretations;
•conditioning of the assay database, compositing, metal accumulation (grade × thickness) calculations and assessment of high-grade outliers;
•geostatistical analysis and variogram modelling using the metal accumulation data;
•construction of three-dimensional block models using parent block dimensions of 5 m × 15 m × 15 m within the mineralized zones and 90 m × 90 m × 90 m for the surrounding waste;
•interpolation of Ag, Au, Cu, Pb, Zn and true thickness (TT) using Ordinary Kriging (OK), whilst Fe and As were estimated using Inverse Distance Weighting (IDW2). All analytes were estimated using the metal accumulation other than TT;
•estimation of density using single drillhole composites representing the across-strike mineralized intersection, with factoring applied within the transitional weathering domain. Density values were based on measured density data supplemented by density values derived from regression analysis undertaken by SRK;
•visual and statistical validation of the block model against the input composite data, including comparison of estimated metal accumulation values, density composites and back-calculated grades against the corresponding input data
•classification of the block model into the Indicated and Inferred Mineral Resource categories based on data quality, geological continuity and drillhole spacing;
•assessment of the reasonable prospects for eventual economic extraction (RPEEE) through the determination of appropriate reporting cut-off values and the generation of a conceptualised optimized open pit shells and underground reporting shapes;
•reporting of the Mineral Resources in accordance with the definitions, terminology and guidelines of the CIM Definition Standards for Mineral Resources and Mineral Reserves (May 2014);
•comparison of the current Mineral Resource Statement (2026 MRS) with the previous MRS prepared by Aya.
14.3Database Construction, Validation and Comments
Electronic data files were provided to SRK by Aya in the form of ASCII exports and a master Microsoft Excel workbook generated from the Company's Geotic drillhole database on 16 April 2026. The database was last updated with assays issued from Afrilabs on the 28 February 2026. The drillhole data were imported into Leapfrog Geo, where a series of validation checks was undertaken to identify potential errors, including duplicate records, overlapping intervals, missing data, invalid coordinates and other database inconsistencies.
The database supplied by Aya comprised the following information:
•drillhole collar information, including coordinates, elevation, total depth and drilling dates;
•downhole survey data;
AYA GOLD & SILVER INC., BOUMADINE POLYMETALLIC PROJECT 135
•lithological logging;
•geotechnical logging, including core recovery and Rock Quality Designation (RQD);
•weathering logging;
•alteration logging;
•mineralization logging;
•structural measurements collected from oriented drill core;
•density measurements; and
•sample intervals and analytical results for all recorded analytes, including Ag, Au, As, Cu, Fe, Pb and Zn.
Aya informed SRK that, where reassaying and relogging were completed for the post-2018 drillholes, the reassay and relogging data were used in place of the original assay and logging data within the Project database.
SRK did not undertake a complete audit of the original exploration records against the electronic database. However, as discussed in Section 10, SRK independently verified selected drillhole collars during the site visit, reviewed representative drill core, geological logging, sampling procedures, orientated core measurements as well as completed high level geological mapping of the mineralization exposed at surface and in the artisanal working. In addition to this SRK also checked a selection of 2025 and 2026 Afrilabs assay certificates against the database provided by Aya. SRK considers the database to be of sufficient quality to support the 2026 MRE.
A total of 852 DD, 33 RC and 55 MP drillholes, comprising 328,719.4 m, 7,513.1 m and 20,090.6 m of drilling, respectively, were available for the 2026 MRE (Table 14‑1 and Figure 14‑1), these drillholes were all located within the Boumadine Mining Licence. The database contains 329,586 Ag (g/t), 329,586 Au (g/t), 329,586 Cu (%), 329,586 Pb (%) and 329,586 Zn (%) assay records.
The historical drillholes, 2017 Maya drillholes and specific tailings-related drilling were excluded from this total. The exclusion of this data is consistent with the methodology adopted in previous MRE completed for the Boumadine Project.
Table 14‑1 Summary of the Aya drillhole database within the Boumadine Mining Licence
| | | | | | | | | | | | | | | | | | | | | | | | | | |
| Year | Number of drillholes | Total number of all drillholes types | Total meters drilled | Total meters drilled (all drillhole types) |
| DD | MP (RC/DD) | RC | DD | MP (RC/DD) | RC |
| 2018 | 42 | | | 42 | 4,591.5 | | | 4,591.5 |
| 2019 | 24 | | | 24 | 3,610.8 | | | 3,610.8 |
| 2020 | 6 | | | 6 | 714.1 | | | 714.1 |
| 2022 | 94 | | | 94 | 21,543.5 | | | 21,543.5 |
| 2023 | 197 | | | 197 | 75,450 | | | 75,450 |
| 2024 | 191 | 14 | 3 | 208 | 91,420.8 | 6,202.1 | 469 | 98,091.9 |
| 2025 | 192 | 41 | 30 | 263 | 92,709.8 | 13,888.5 | 7,044.1 | 113,642.4 |
| 2026 | 106 | | | 106 | 38,679 | | | 38,679 |
| Grand Total | 852 | 55 | 33 | 940 | 328,719.4 | 20,090.6 | 7,513.1 | 356,323.1 |
AYA GOLD & SILVER INC., BOUMADINE POLYMETALLIC PROJECT 136
Figure 14‑1 Plan view of drillhole traces (coloured grey) and collars used in the 2026 MRE( coloured by Year) in relation to the Boumadine Mining Licence (black) and resource definition drilling area (red)
14.4Exploratory Data Analysis
SRK reviewed the distributions of Ag, Au, Cu, Pb and Zn grades relative to the logged lithology and observed that elevated metal grades are predominantly associated with the massive sulphide (MS; >70% logged visible sulphide content), semi-massive sulphide (SMS; <70% logged ~>30% sulphide content) and gossan (A3)
AYA GOLD & SILVER INC., BOUMADINE POLYMETALLIC PROJECT 137
lithologies (Figure 14‑2). However, significant mineralization also occurs within other logged lithologies, reflecting the complex distribution of sulphide mineralization and local inconsistencies in the geological logging.
To provide a consistent guide for mineralization wireframing, SRK generated a calculated total sulphide variable for each assay interval. The calculation was used only as a geological modelling aid where mineralized intervals had not been logged as MS, SMS or A3, and was not used as a substitute for geological interpretation, it was a guide to be used alongside the assay intervals.
The total sulphide variable was derived using stoichiometric relationships based on the principal sulphide minerals identified during previous mineralogical investigations at Boumadine. Copper, zinc and lead were assumed to occur predominantly as chalcopyrite (CuFeS₂), sphalerite (ZnS) and galena (PbS), respectively. The proportion of pyrite (FeS₂) was subsequently estimated from the remaining Fe after deducting the iron attributed to chalcopyrite and sphalerite. One of the key assumptions is that Fe was not associated with any silicate minerals (primary or alteration) in a large abundance. The individual calculated sulphide percentages were then summed to produce a total sulphide estimate for each sample. The sulphide calculations are noted below.
AYA GOLD & SILVER INC., BOUMADINE POLYMETALLIC PROJECT 138
Figure 14‑2 Box plot showing raw Ag, Au and Zn grades with Aya lithological logging codes (A= Ag g/t, B= Au g/t and C = Zn %)
AYA GOLD & SILVER INC., BOUMADINE POLYMETALLIC PROJECT 139
14.5Topography and Collars Adjustments
The geological, weathering and mineralization domain models described in the following sections were constructed beneath a topographic surface wireframe (Figure 14‑3) that exhibits moderate local relief. The northern part of the deposit is characterised by a series of north–south-trending ridges, which have similar trends to the mineralized structures, whereas the central and southern portions of the deposit occur within a broader river valley and generally display more subdued topography. In the far southern part of the Mining Licence, the relief becomes more pronounced, similar to that in the north.
Aya acquired the topographic surface from an open-source satellite-based digital elevation model (DEM) with a reported spatial resolution of 5 m, in addition to this Aya applied a vertical correction of 59.3 m.
SRK visually reviewed the surface drillhole collar positions relative to the topographic surface and noted an overall reasonable correlation between the surveyed collar elevations and the digital terrain model (DTM). However, several localized discrepancies were identified, with some drillhole collars differing from the topographic surface. SRK considers these discrepancies typically reflect limitations of the existing topographic dataset rather than inaccuracies in the surveyed collar positions.
To provide a consistent basis for geological modelling, surface drillholes without surveyed collar coordinates (i.e. where both the Survey and Survey Type fields were blank or noted as planned in the database) were projected vertically onto the topographic surface. Surface drillholes with surveyed collar coordinates were retained at their recorded locations, with the exception of BOU-DD24-455, which is a daughter hole, the underground drillholes and channel samples were retained at their original surveyed coordinates. All historical and 2017 surface drillholes were projected onto the topographic surface, irrespective of their recorded collar elevations, owing to the lower confidence associated with the historical topographic data.
SRK considers the resulting topographic surface and to be sufficiently accurate for the purposes of the 2026 MRE and considers the available collar survey data to be appropriate for the current level of study. However, Aya plan to undertake a high-resolution pre-mining drone survey, once this has been acquired this should be used in future MRE to improve the accuracy of the surface topography for subsequent FS work.
AYA GOLD & SILVER INC., BOUMADINE POLYMETALLIC PROJECT 140
Figure 14‑3 Boumadine topographic wireframe in plan view coloured by elevation and drillhole collars (coloured by year)
14.6Geological Modelling and Domaining
The Boumadine geological modelling is primarily based on the Aya drilling database, and is also supported by historical underground mine plans (includes geological mapping information), surficial geological mapping, as-built depletion surveys, satellite imagery, structural measurements and Aya's previous mineralization models. The maps (surface and underground) have been georeferenced and have been integrated into the lithological and mineralization models.
Boumadine is interpreted as being formed within a shallow submarine volcanic environment developed in an extensional basin or graben setting. Mineralization generally comprises 1 to 5 m-wide (although locally thicker) MS and or SMS veins and lenses that dip approximately 70° towards the northeast, with dip azimuths ranging from 050° to 060°. The MS and SMS veins is generally surrounded by a 1 to 10 m (locally up to 20 m) thick halo of 10 to 30% disseminated pyrite.
AYA GOLD & SILVER INC., BOUMADINE POLYMETALLIC PROJECT 141
14.7Lithological Model
No three-dimensional lithological models were constructed by SRK for the 2026 MRE. This also includes the overburden, which is interpreted to be restricted to the valley floors, where it has limited lateral extent and thicknesses.
As noted in Section 7.2, the distinction between the felsic and mafic tuffs is an important component of the geological interpretation and appears to influence the distribution and intensity of mineralization; however, this distinction is locally difficult to recognize or is absent from the historical drillhole logging and therefore based on this SRK recommends that Aya should investigate whether whole rock geochemistry will help with the identification and standardisation of the lithologies encountered in the drilling.
For future MRE updates, SRK recommends that a three-dimensional (3D) lithological model is developed, subject to the availability of sufficient and consistent geological data. Such a model would improve the geological understanding of the deposit, support mine planning and geotechnical assessments, and provide a stronger geological framework for future MRE.
14.8Weathering Model
SRK reviewed the weathering logging during the site visit and subsequently undertook a desktop review of this data using the 2024 to 2026 drill core photographs in Imago. Based on this review, SRK considers the interpreted base of oxidation (top of fresh rock, coded as SU in the Aya weathering logging scheme) to be reasonably reliable, with the majority of weathered intervals are logged as TR (transitional). However, the distinction between oxide and transitional material could not be reliably established because only a limited number of intervals were logged as fully oxidised (OX), and in several cases these occurred at depth rather than within the near-surface weathering profile, suggesting that they may instead represent localized fault-related oxidation. Furthermore, on several occasions the logged TR and SU contacts did not correspond with SRK's visual assessment of the drill core or surrounding drillholes. In particular, SRK identified several instances where overburden had been incorrectly logged as weathered bedrock, or where TR was logged for entire drillhole or large lengths of core, though the adjacent holes only had a few meters of TR logged. These observations were communicated to Aya during the QP site visit, and Aya agreed to review and update the affected intervals within the geological database and implement consistent weathering logging procedures for future drilling programs.
SRK was only able to model two weathering domains: oxide (logged as TR in the drillhole file) and fresh (logged as SU in the drillhole file). Where discrepancies were identified, the weathering interpretation was guided by direct observations of the drill core photographs in conjunction with the surrounding drillholes.
The weathering surfaces were constructed in Leapfrog Geo based on the interpreted weathering logging (Figure 14‑4). The base of oxidation was modelled across the entire area (not split by the three areas) as a deposit offset surface constrained, with the topographic surface used as a reference. SRK considers the resulting surface to provide a reasonable representation of the oxidation profile for the purposes of the 2026 MRE.
SRK recommends that future surface drilling programs include some total sulphur (S%) analysis and, where practicable, this would also help expand the current S% database which contains 92 values currently. These data would provide an independent means of validating and refining the interpreted oxidation profile and improve the definition of the transition between oxide and fresh sulphide mineralization in the locations where this data is recorded.
Only a few mineralized samples occur within the weathered zone compared with the fresh sulphide domain, making it difficult to assess the extent to which weathering has modified the primary metal distribution other than assessing surface grab samples (not used in this MRE). Previous reports indicate that supergene
AYA GOLD & SILVER INC., BOUMADINE POLYMETALLIC PROJECT 142
weathering has preferentially leached mobile elements such as Zn, Mn, Ni, Co and Cd, whereas Ag, Au and Pb are interpreted to have remained relatively immobile. Consequently, the metal distribution within the weathered profile may differ locally from that observed in the underlying fresh sulphide mineralization, though further work is required to resolve this aspect.
Figure 14‑4 Cross section (30m slice) through weathering model, with drillholes coloured by logged weathering codes (TR = blue, and SU = green) and drillhole collars coloured by year (section X= 317165 and Y = 3474300)
14.9Mineralization Model
SRK modelled the mineralization for the three areas (north, central and south - Figure 14‑5.) of the deposit. Modelling the mineralization by area allowed the interpretation to better reflect local geological controls and provided greater flexibility during geological modelling and grade estimation.
AYA GOLD & SILVER INC., BOUMADINE POLYMETALLIC PROJECT 143
The mineralization domains comprise discrete massive to semi-massive sulphide veins. SRK did not model a separate lower-grade disseminated mineralization halo. Where disseminated mineralization exceeded the modelling cut-off value and demonstrated sufficient geological continuity, these intervals were incorporated into the domain wireframes.
As noted above, the orientations and geometries of the individual mineralization wireframes were guided by a combination of satellite imagery, surface and underground geological mapping, historical as-built depletion surveys, drillhole geology, structural logging data, logged mineralization style (including massive and semi-massive sulphides), assay data, Aya previous wireframes and SRK’s interpreted total sulphide content. Mineralization wireframes were typically modelled where mineralized intervals could be correlated across multiple drillhole sections. An iterative modelling approach was adopted; whereby massive to semi-massive mineralized cores were initially interpreted before progressively reducing the modelling thresholds to capture the broader extent of the mineralized structures. SRK also considered the NSR thresholds used for Mineral Resource reporting (previous and current) during the modelling process to ensure that potentially economically relevant mineralization was appropriately represented. These thresholds were used as modelling guides rather than strict cut-offs, allowing the interpreted wireframes to maintain geological continuity through locally lower-grade intervals were supported by the geological interpretation. In most cases, the interpreted vein contacts correspond to relatively sharp changes in grade and sulphide abundance; however, locally more gradational contacts were observed, typically reflecting a progressive decrease in sulphide abundance away from the massive to semi-massive sulphide mineralization.
SRK notes that drilling locally intersected numerous thin, discrete mineralized structures that could not be confidently correlated between drillholes or modelled owing to insufficient geological support. The geological interpretation is also subject to several limitations, including uncertainty in correlating isolated high-grade intersections; the absence of structural measurements from oriented drill core in some areas; uncertainty associated with some historical drillhole surveys; the positional accuracy of historical underground mapping; locally wide drillhole spacing relative to the dimensions of the mineralized structures; and the effects of faulting on mineralization continuity. Where supported by the available geological evidence, SRK considered the interpreted faulting when defining the extents and continuity of the mineralization wireframes. Additional infill drilling is recommended to improve geological confidence and further constrain and refine the wireframe interpretations in these areas.
The interpreted mineralization wireframes were reviewed with Aya, who provided geological feedback based on their knowledge of the deposit. This review resulted in several minor refinements to the wireframe interpretations, including the addition of a small number of discrete mineralized wireframes. In total, SRK modelled 158 mineralized domains across the Project (Figure 14‑5 and Figure 14‑6), comprising 57 domains in the southern area, 58 in the central area and 43 in the northern area.
As part of the model validation process, SRK compared the orientations of the interpreted mineralization wireframes against available structural measurements and geological mapping to assess whether the modelled geometries were consistent with the observed structural framework (Figure 14‑7). Only structural measurements assigned confidence ratings of 2, 3 and 4 are presented. SRK notes that some of the structural measurements represent subsidiary veinlets associated with the broader mineralized sulphide structures rather than the principal mineralized structures themselves. As noted by Gaboury, these subsidiary veinlets can exhibit variable orientations. Consequently, some variation between the measured structural orientations and the orientations of the modelled mineralization wireframes is expected.
The mineralization remains open at depth and along strike in several areas. To the north, further extension of the interpreted mineralization is constrained by the northern boundary of the Mining Licence. Drilling completed to date has identified mineralization over an approximate strike length of 5.8 km and, locally, to depths exceeding 1,000 m below surface, although mineralization does not extend to these depths throughout the deposit.
AYA GOLD & SILVER INC., BOUMADINE POLYMETALLIC PROJECT 144

Figure 14‑5 Plan view showing location of the North, Central and Suther Wireframes as modelled by SRK in relation to the Boumadine Mining Licence
AYA GOLD & SILVER INC., BOUMADINE POLYMETALLIC PROJECT 145
Figure 14‑6 Boumadine modelled wireframes in (light brown) in relation to the drillhole traces (grey)
AYA GOLD & SILVER INC., BOUMADINE POLYMETALLIC PROJECT 146

Figure 14‑7 Comparison of MS and SMS structural measurements (A, C and E) with the average orientations of the modelled vein wireframes (B, D and F) for the northern (A and B), central (C and D) and southern (E and F) areas of the Boumadine deposit.14.9.1Estimation domains
To support grade interpolation, the mineralization wireframes were grouped into estimation domains based on their natural structural associations (dip and dip direction) within the northern, central and southern areas of the Boumadine mineralization framework. The northern area was subdivided into seven groups (N1 to N7), the central area into eight groups (C1 to C8), and the southern area into nine groups (S1 to S9). The resulting estimation domains and their respective group assignments are listed in Table 14‑2, and are illustrated on stereonets in Figure 14‑7.
AYA GOLD & SILVER INC., BOUMADINE POLYMETALLIC PROJECT 147
Table 14‑2 Final estimation domains
| | | | | | | | | | | | | | | | | | | | | | | | | | | | | | | | | | | |
| Area | Group | Wireframe Name | Estimation Domain Code | Area | Group | Wireframe Name | Estimation Domain Code | Area | Group | Wireframe Name | Estimation Domain Code |
| Central | C1 | C_Main | 2091 | Central | C5 | C1_West2 | 2502 | South | S1 | S_East_1a | 1031 |
| Central | C1 | C1_East12 | 2012 | Central | C5 | C1_West38 | 2538 | South | S1 | S_East_2 | 1040 |
| Central | C1 | C1_East18 | 2018 | Central | C5 | C1_West7 | 2507 | South | S1 | S_East_2a | 1041 |
| Central | C1 | C1_East19 | 2019 | Central | C6 | C1_East14 | 2614 | South | S1 | S_East_3 | 1003 |
| Central | C1 | C1_East2 | 2002 | Central | C7 | C1_West29 | 2729 | South | S1 | S_East_3a | 1033 |
| Central | C1 | C1_East20 | 2020 | Central | C8 | C_NS2 | 2802 | South | S1 | S_East_4 | 1004 |
| Central | C1 | C1_East26 | 2026 | North | N1 | N_NE_1 | 3001 | South | S1 | S_East_5 | 1005 |
| Central | C1 | C1_East4 | 2004 | North | N1 | N_NE_10 | 3010 | South | S1 | S_East_6 | 1006 |
| Central | C1 | C1_East5 | 2005 | North | N1 | N_NE_11 | 3011 | South | S1 | S_East_7 | 1007 |
| Central | C1 | C1_East6 | 2006 | North | N1 | N_NE_2 | 3002 | South | S1 | S_Main | 1090 |
| Central | C1 | C1_East9 | 2009 | North | N1 | N_NE_3 | 3003 | South | S1 | S_Main_a | 1091 |
| Central | C1 | C1_West1 | 2101 | North | N1 | N_NE_4 | 3004 | South | S1 | S_Main_b | 1092 |
| Central | C1 | C1_West13 | 2113 | North | N1 | N_NE_5 | 3005 | South | S1 | S_Target_1 | 1061 |
| Central | C1 | C1_West15 | 2115 | North | N1 | N_NE_7 | 3007 | South | S1 | S_Target_2 | 1062 |
| Central | C1 | C1_West17 | 2117 | North | N1 | N_NE_8 | 3008 | South | S1 | S_Target_3 | 1063 |
| Central | C1 | C1_West18 | 2118 | North | N1 | N_NE_9 | 3009 | South | S1 | S_West_1 | 1050 |
| Central | C1 | C1_West20 | 2120 | North | N2 | 3_Imarirren | 3191 | South | S1 | S_West_1a | 1051 |
| Central | C1 | C1_West22 | 2122 | North | N2 | 3_Imarirren East | 3192 | South | S1 | S_West_1b | 1052 |
| Central | C1 | C1_West27 | 2127 | North | N2 | 3_Imarirren West | 3193 | South | S1 | S_West_1d | 1053 |
| Central | C1 | C1_West3 | 2103 | North | N2 | 3_NS 0 | 3100 | South | S1 | S_West_2 | 1054 |
| Central | C1 | C1_West30 | 2130 | North | N2 | 3_NS 1 | 3101 | South | S1 | S_West_2a | 1055 |
| Central | C1 | C1_West31 | 2131 | North | N2 | 3_NS 2 | 3102 | South | S1 | S_West_2b | 1056 |
| Central | C1 | C1_West32 | 2132 | North | N2 | 3_NS 21 | 3121 | South | S2 | S_N30_1 | 1201 |
| Central | C1 | C1_West4 | 2104 | North | N2 | 3_NS 22 | 3222 | South | S2 | S_N30_2 | 1202 |
| Central | C1 | C1_West6 | 2106 | North | N2 | 3_NS 23 | 3223 | South | S2 | S_N30_3 | 1203 |
| Central | C2 | C1_East13 | 2213 | North | N2 | 3_NS 24 | 3224 | South | S2 | S_N30_8 | 1208 |
| Central | C2 | C1_East15 | 2215 | North | N2 | 3_NS 25 | 3225 | South | S2 | S_N30_9 | 1209 |
| Central | C2 | C1_East16 | 2216 | North | N2 | 3_NS 26 | 3226 | South | S3 | S_East_1d | 1331 |
| Central | C2 | C1_East22 | 2222 | North | N2 | 3_NS 3 | 3103 | South | S3 | S_East_2d | 1341 |
| Central | C2 | C1_East23 | 2223 | North | N2 | 3_NS 4 | 3204 | South | S3 | S_N30_10b | 1310 |
| Central | C2 | C1_East3 | 2203 | North | N2 | 3_NS 5 | 3205 | South | S3 | S_N30_11b | 1311 |
| Central | C2 | C1_East7 | 2207 | North | N2 | 3_NS 6 | 3206 | South | S3 | S_N30_12b | 1312 |
| Central | C2 | C1_West19 | 2219 | North | N2 | 3_NS 7 | 3207 | South | S3 | S_N30_13b | 1313 |
| Central | C2 | C1_West21 | 2221 | North | N2 | 3_NS_27 | 3227 | South | S3 | S_N30_14b | 1314 |
| Central | C2 | C1_West24 | 2224 | North | N2 | 3_NS_30 | 3230 | South | S3 | S_N30_4d | 1304 |
| Central | C2 | C1_West25 | 2225 | North | N2 | 3_Tizi West | 3292 | South | S3 | S_N30_5b | 1305 |
| Central | C2 | C1_West35 | 2235 | North | N2 | 3_Tizi West 01 | 3293 | South | S3 | S_N30_6b | 1306 |
| Central | C2 | C1_West36 | 2236 | North | N2 | 3_Tizi_West_3 | 3294 | South | S4 | S_East_3d | 1403 |
| Central | C3 | C1_East11 | 2311 | North | N2 | 4_Tizi Main | 3291 | South | S4 | S_East_4b | 1404 |
| Central | C3 | C1_East27 | 2327 | North | N3 | 3_Tizi East | 3301 | South | S4 | S_East_7b | 1407 |
| Central | C3 | C1_West_14 | 2314 | North | N3 | 3_Tizi East 0 | 3295 | South | S4 | S_Main_d | 1094 |
| Central | C3 | C1_West9 | 2309 | North | N3 | N_NE_6 | 3006 | South | S5 | S_SW_1 | 1501 |
| Central | C4 | C_NS1 | 2400 | North | N4 | 1_West2 | 3402 | South | S5 | S_SW_2 | 1502 |
| Central | C4 | C1_East1 | 2401 | North | N4 | 3_NS 10 | 3410 | South | S5 | S_SW_3 | 1503 |
| Central | C4 | C1_East10 | 2410 | North | N4 | 3_NS 9 | 3409 | South | S5 | S_SW_4 | 1504 |
| Central | C4 | C1_East17 | 2417 | North | N4 | 3_NS_11 | 3411 | South | S6 | S_East_14 | 1614 |
AYA GOLD & SILVER INC., BOUMADINE POLYMETALLIC PROJECT 148
| | | | | | | | | | | | | | | | | | | | | | | | | | | | | | | | | | | |
| Area | Group | Wireframe Name | Estimation Domain Code | Area | Group | Wireframe Name | Estimation Domain Code | Area | Group | Wireframe Name | Estimation Domain Code |
| Central | C4 | C1_East24 | 2424 | North | N5 | 3_NS 8 | 3508 | South | S6 | S_East_1b | 1631 |
| Central | C4 | C1_East25 | 2425 | North | N6 | 1_Main | 3600 | South | S6 | S_East_1c | 1632 |
| Central | C4 | C1_West11 | 2411 | North | N7 | 4_EW_1 | 4003 | South | S6 | S_Main_c | 1093 |
| Central | C4 | C1_West5 | 2405 | South | S1 | S_East_1 | 1030 | South | S6 | S_West_1c | 1601 |
| Central | C4 | C1_West8 | 2408 | South | S1 | S_East_11 | 1011 | South | S7 | S_EW_2 | 4002 |
| Central | C5 | C1_West10 | 2510 | South | S1 | S_East_12 | 1012 | South | S8 | S_SW_5 | 1505 |
| | | | South | S1 | S_East_13 | 1013 | South | S9 | S_EW_1 | 4001 |
14.10Data Conditioning and Post-domaining Statistical Analysis
14.10.1Grade estimation methodology
The interpreted mineralization at Boumadine comprises a series of narrow vein-like bodies displaying strike continuity significantly greater than their true thickness. Where mineralized domains are substantially thinner than the parent block dimensions, without careful selection of estimation parameters conventional 3D grade estimation can result in irregular block grade distributions, localized bias, and may give the impression of greater selectivity and predictability of grade in the across-strike dimension than is realistic.
For this reason, SRK adopted a two-dimensional estimation methodology, which estimates true thickness (TT) and metal accumulation independently before calculating block grades. SRK considers this approach to be more appropriate for the style of mineralization encountered at Boumadine, as it simplifies estimation decisions, reduces artefacts associated with estimating thin volumes in 3D, and allows for greater consideration towards accurately defining the distribution of mineralization in the plane of greatest continuity.
SRK used statistics to confirm the suitability of the domain models for use in grade estimation. Assayed Au, Ag, Cu, Pb and Zn grades were considered in this analysis.
14.10.2Data conditioning and top cutting of outliers
Prior to geostatistical analysis, SRK reviewed the grade distributions to determine whether top-cutting was required to reduce the influence of isolated high-grade outliers on the estimation. This was undertaken on the raw assay data, prior to calculation of metal accumulation and TT values.
As over 70% of the raw assay samples in the drillhole database are consistent 1 m intervals, and 90% are between 0.8 and 1.2 m SRK decided that consequently no compositing was required prior to this initial capping assessment.
Separate histograms and log probability plots were generated for mineralized groups; the groups were defined according to their interpreted mineralogical composition. SRK identified three categories: high-pyrite (≥25% Fe), low-pyrite (<25% Fe), and polymetallic veins (relative low Fe but elevated Ag, Zn and Pb). Review of the histograms and log probability plots identified a small number of significant high-grade outliers, which were subsequently capped. Examples of these outliers are presented in Figure 14‑8 and Figure 14‑9. Consequently, SRK applied the initial top-cuts listed in Table 14.3. SRK notes that the capping thresholds were intentionally conservative, as a second phase of top-cut optimization was envisaged following statistical and visual validation of the initial estimation results, as discussed below.
Following completion of the initial capping assessment, mineralized drill intersections were converted into full intercept composites. For each mineralized intercept, SRK calculated the TT of the interpreted vein, together with the corresponding average capped grade for each analyte (Ag, Au, As, Cu, Fe, Pb and Zn). Metal accumulation values were then calculated as the product of TT and average grade and assigned to a single
AYA GOLD & SILVER INC., BOUMADINE POLYMETALLIC PROJECT 149
point located at the centre of each interpreted intercept. These metal accumulation and TT values formed the primary estimation variables used throughout the subsequent geostatistical analysis and interpolation.
Following the initial estimation, and during SRK's initial validation phase, additional top cuts based on accumulated grades (grade × true thickness) were applied to individual estimation domains where high-grade samples were observed to unduly influence adjacent blocks, resulting in local smearing of higher grades. These additional top cuts were selected through a review of domain-specific histograms and visual assessment of the estimation results. The selected top cuts are listed in Table 14‑3, an example of the top cut selected for the metal accumulation is presented in Figure 14‑10.
Table 14‑3 Selected top cuts on raw assay data
| | | | | | | | | | | | | | | | | | | | | | | | | | | | | | | | | | | |
| Zone | Group | Cap Level (g/t or %) | Cumulative Metal Cut (%) |
| Au | Ag | Pb | Zn | Cu | Au | Ag | Pb | Zn | Cu |
| South | EW Polymetallic | NA | 1,500 | NA | NA | NA | - | - | - | - | - |
| Main High Pyrite | NA | 4,775 | NA | 28 | NA | - | 4 | - | 1 | - |
| Main High Pyrite + AgPbZn | 3 | 700 | 7 | 15 | NA | 4 | 1 | 1 | 1 | - |
| Main Low Pyrite | 10 | 850 | NA | 15 | NA | 3 | 1 | - | 1 | - |
| N30 Polymetallic | 34 | 2,565 | 26 | 15 | NA | 4 | 3 | 1 | 0 | - |
| Secondary High Pyrite | 26 | 545 | NA | 25 | NA | 2 | 2 | - | 1 | - |
| Central | Main High Pyrite | 75 | 1,085 | 12 | NA | NA | 3 | 1 | 0 | - | - |
| Main Low Pyrite | NA | 110 | 10 | 17 | NA | - | 2 | 7 | 2 | - |
| NE High Pyrite | NA | 515 | 7 | 20 | NA | - | 2 | 4 | 4 | - |
| NS High Pyrite | 20 | 290 | 8 | 20 | NA | 8 | 1 | 6 | 2 | - |
| NS Low Pyrite | NA | NA | 9 | 7 | NA | - | - | 1 | 3 | - |
| North | EW Polymetallic | NA | NA | NA | NA | NA | - | - | - | - | - |
| Imarien High Pyrite | NA | NA | NA | NA | NA | - | - | - | - | - |
| Main | 2 | 68 | NA | NA | NA | 2 | 2 | - | - | - |
| NE High Pyrite | NA | 205 | NA | 9 | NA | - | 8 | - | 2 | - |
| NS High Pyrite | 8 | 419 | NA | 9 | NA | 3 | 2 | - | 2 | - |
| NS Low Pyrite | 6 | 165 | NA | 9 | NA | 4 | 7 | - | 1 | - |
| Tizi High Pyrite | 20 | 1,750 | NA | NA | NA | 3 | 15 | - | - | - |
AYA GOLD & SILVER INC., BOUMADINE POLYMETALLIC PROJECT 150
Figure 14‑8 Histogram of raw Ag g.t sample data for group XX in south
AYA GOLD & SILVER INC., BOUMADINE POLYMETALLIC PROJECT 151
Figure 14‑9 Histogram of raw Zn % sample data for group XX in central area
Table 14‑4 Selected top cuts on metal accumulation data (grade x thickness) from SRK’s visual validation
| | | | | | | | | | | | | | | | | | | | | | | |
| Domain | AU | AG | PB | ZN | CU | Fe | TT |
| 1052 | 0 | 0 | 0 | 0 | 0.65 | NA | 3 |
| 1091 | 8 | 2225 | 10 | 15 | 1.35 | NA | 5.5 |
| 1632 | 11 | 265 | 2.5 | NA | 0.45 | NA | 7 |
| 2091 | 70 | 1000 | 11.5 | 35.5 | 3.15 | 250 | 11 |
| 2104 | 19.5 | 645 | 6.75 | 18 | 1 | NA | 7.35 |
| 2405 | 1.25 | 105 | 5 | 5 | NA | 140 | 4 |
| 3101 | 11.75 | 265.5 | 4.15 | 6.25 | 0.95 | NA | 5.5 |
AYA GOLD & SILVER INC., BOUMADINE POLYMETALLIC PROJECT 152
| | | | | | | | | | | | | | | | | | | | | | | |
| 3103 | 10 | 250 | NA | 2.5 | 1.2 | NA | 6.25 |
| 3291 | 12.5 | 545 | 10 | 16.75 | 0.87 | 120 | 9 |
| 3292 | 6 | NA | 2.5 | NA | 0.25 | NA | 5.65 |
| 3301 | 5.5 | 1335 | 5 | NA | 1.5 | NA | 6 |
| 1004 | NA | NA | NA | NA | NA | 30 | NA |
| 1007 | NA | NA | NA | NA | NA | 25 | NA |
| 1056 | NA | NA | NA | NA | NA | 100 | NA |
| 1090 | NA | NA | NA | NA | NA | 180 | NA |
| 1202 | NA | NA | NA | NA | NA | 50 | NA |
| 1305 | NA | NA | NA | NA | NA | 100 | NA |
| 1311 | NA | NA | NA | NA | NA | 80 | NA |
| 2510 | NA | NA | NA | NA | NA | 175 | NA |
| 3011 | NA | NA | NA | NA | NA | 40 | NA |
| 3121 | NA | NA | NA | NA | NA | 100 | NA |
| 3294 | NA | NA | NA | NA | NA | 80 | NA |
| 3295 | NA | NA | NA | NA | NA | 200 | NA |
| 3301 | NA | NA | NA | NA | NA | 90 | NA |
 Figure 14‑10 Histogram of raw Ag metal accumulation data for domain 1091 in South
AYA GOLD & SILVER INC., BOUMADINE POLYMETALLIC PROJECT 153
Figure 14‑11 Histogram of raw Au metal accumulation data for domain 2091 in Central
14.10.3Statistics
A comparison of the uncapped and capped accumulated metal values for Ag, Au, Cu, Fe, Pb and Zn for each estimation domain is presented in Appendix B. SRK notes that the uncapped accumulated metal values incorporate the top-cuts applied to the raw, uncomposited drillhole assay database, as described in 14.10.2.
The distribution of accumulated metal values for most domains approaches a log-normal distribution, examples of which are presented in Figure 14‑12 for Cu and Figure 14‑13 for Ag. Some domains exhibit more complex distributions owing to limited sample support due to the accumulation approach; however, they generally remain consistent with a positively skewed (approximately log-normal) distribution, though in a few cases a normal gaussian distribution is observed.
The coefficient of variation (CoV) for the modelled domains typically ranges between 0.8 and 1.4. The CoV generally decreases where the limited additional top-cuts have been applied to the accumulated metal values. Overall, top-cutting has a minimal effect on the mean accumulated metal grades within most domains. The greatest impact is observed in domains with limited sample support or exceptionally high accumulated Ag values compared to the rest of the domain samples, such as Domains 4001 and 3301. In SRK's opinion, domains with high CoV’s typically require additional drilling to increase the sample support of these domains.
AYA GOLD & SILVER INC., BOUMADINE POLYMETALLIC PROJECT 154
Figure 14‑12 Example capped metal accumulation histogram for Au in domain 2091
AYA GOLD & SILVER INC., BOUMADINE POLYMETALLIC PROJECT 155
Figure 14‑13 Example capped metal accumulation histogram for Ag in domain 2091
14.10.4Geostatistical analysis
Experimental variography was undertaken using calculated metal accumulation values (grade × true thickness) for each structural vein group, as defined by the orientation of the interpreted mineralization wireframes in Section 14.9.1.
Log-transformed directional experimental variograms were generated to investigate the principal directions of spatial continuity for Ag, Au, Cu, Pb, Zn and true thickness. The variograms typically have only a few hundred sample pairs, due to the accumulation approach adopted, but has resulted in variograms of moderate to high quality. The principal direction of continuity was clearly identified and corresponds closely with the interpreted plunge of mineralized shoots. Exponential models were fitted to the experimental variograms.
Owing to the limited number of closely spaced downhole sample pairs, the nugget effect was primarily evaluated using omnidirectional variograms together with the shortest lag distances available in the directional variograms.
AYA GOLD & SILVER INC., BOUMADINE POLYMETALLIC PROJECT 156
Variography was only possible for structural groups N1, N2 Imarirren, N2 Tizi, C1, C2, C4, S1, S2, S3, S4, S5 and S6, owing to the greater quantity of supporting data and the higher confidence in the geological interpretation of these groups. The remaining groups (N3, N4, N5, N6, N7, C3, C5, C6, C7, C8, S7, S8 and S9) contained insufficient data to support meaningful variogram modelling. For these groups, variogram parameters were adopted from the most appropriate analogue group, based on similarities in orientation and geological interpretation. Specifically, the plunge orientation used during estimation was fixed using the corresponding analogue variogram model, whilst the search orientation and variogram geometry were locally adjusted based on the average orientation of the corresponding group of modelled veins using Vulcan LVA function, as discussed in Section 14.10.9.
For the grade continuity analysis, North Group 2 was subdivided into the Tizi and Imarirren vein packages, despite both belonging to the same structural group. This subdivision was undertaken because the two vein packages are spatially distinct and separated by sufficient distance to warrant independent variogram analyses.
The modelled variogram parameters are denoted in Table 14‑6, with example images presented in Figure 14‑14 to Figure 14‑16.
Figure 14‑14 Directional variograms for Pb (grade x thickness) for group C1 (central): (A) downhole variogram; (B) major-axis variogram; (C) semi-major-axis variogram; (D) minor-axis variogram and (E) omnidirectional variogram
AYA GOLD & SILVER INC., BOUMADINE POLYMETALLIC PROJECT 157
Figure 14‑15 Directional variograms for true thickness (TT) for group N2_Tizzi (north): (A) downhole variogram; (B) major-axis variogram; (C) semi-major-axis variogram; (D) minor-axis variogram and (E) omnidirectional variogram
AYA GOLD & SILVER INC., BOUMADINE POLYMETALLIC PROJECT 158
Figure 14‑16 Directional variograms for Zn (grade x thickness) for group S2 (south): (A) downhole variogram; (B) major-axis variogram; (C) semi-major-axis variogram; (D) minor-axis variogram and (E) omnidirectional variogram
Table 14‑5 SRK modelled variogram parameters
| | | | | | | | | | | | | | | | | | | | | | | | | | | | | | | | | | | |
| Group | Element | Nugget | Number of structures | Major angle (Vulcan input) ° | Semi Major angle (Vulcan input) ° | Minor angle (Vulcan input) ° | Sill | Total Sill | Major Range (m) | Semi Major Range (m) | Minor Range (m) |
| C1 | Ag | 30% | 1 | 123.9 | -22.5 | 62.8 | 70% | 100% | 275 | 125 | 50 |
| C1 | Au | 20% | 1 | 128.5 | -13.6 | 64.2 | 80% | 100% | 250 | 125 | 50 |
| C1 | Cu | 25% | 1 | 128.5 | -13.6 | 64.2 | 75% | 100% | 110 | 80 | 50 |
| C1 | Pb | 25% | 1 | 128.5 | -13.6 | 64.2 | 75% | 100% | 251 | 150 | 50 |
| C1 | TT | 25% | 1 | 128.5 | -13.6 | 64.2 | 75% | 100% | 225 | 130 | 50 |
| C1 | Zn | 25% | 1 | 128.5 | -13.6 | 64.2 | 75% | 100% | 370 | 210 | 50 |
| C2 | Ag | 25% | 1 | 129.6 | -22.5 | 45.9 | 75% | 100% | 200 | 295 | 50 |
| C2 | Au | 25% | 1 | 117.3 | -32.8 | 40.1 | 75% | 100% | 200 | 295 | 50 |
| C2 | Cu | 25% | 1 | 129.6 | -22.5 | 45.9 | 75% | 100% | 200 | 265 | 50 |
| C2 | Pb | 25% | 1 | 117.3 | -32.8 | 40.1 | 75% | 100% | 200 | 295 | 50 |
| C2 | TT | 25% | 1 | 129.6 | -22.5 | 45.9 | 75% | 100% | 200 | 250 | 50 |
| C2 | Zn | 25% | 1 | 129.6 | -22.5 | 45.9 | 75% | 100% | 200 | 295 | 50 |
| C4 | Ag | 25% | 1 | 141.7 | -24.2 | 51 | 75% | 100% | 205 | 115 | 50 |
AYA GOLD & SILVER INC., BOUMADINE POLYMETALLIC PROJECT 159
| | | | | | | | | | | | | | | | | | | | | | | | | | | | | | | | | | | |
| Group | Element | Nugget | Number of structures | Major angle (Vulcan input) ° | Semi Major angle (Vulcan input) ° | Minor angle (Vulcan input) ° | Sill | Total Sill | Major Range (m) | Semi Major Range (m) | Minor Range (m) |
| C4 | Au | 20% | 1 | 148.2 | -16.3 | 53.3 | 80% | 100% | 130 | 110 | 50 |
| C4 | Cu | 20% | 1 | 120.7 | -42.1 | 39.3 | 80% | 100% | 150 | 105 | 50 |
| C4 | Pb | 10% | 1 | 148.2 | -16.3 | 53.3 | 90% | 100% | 260 | 135 | 50 |
| C4 | TT | 10% | 1 | 125.6 | -38.9 | 42.6 | 90% | 100% | 105 | 135 | 50 |
| C4 | Zn | 10% | 1 | 148.2 | -16.3 | 53.3 | 90% | 100% | 285 | 135 | 50 |
| N1 | Ag | 25% | 1 | 247.5 | 21.5 | 13.1 | 75% | 100% | 135 | 190 | 20 |
| N1 | Au | 25% | 1 | 203.6 | 6.3 | 24.2 | 75% | 100% | 165 | 85 | 20 |
| N1 | Cu | 25% | 1 | 203.6 | 6.3 | 24.2 | 75% | 100% | 180 | 70 | 20 |
| N1 | Pb | 25% | 1 | 203.6 | 6.3 | 24.2 | 75% | 100% | 190 | 105 | 20 |
| N1 | TT | 25% | 1 | 203.6 | 6.3 | 24.2 | 75% | 100% | 205 | 125 | 20 |
| N1 | Zn | 25% | 1 | 208.3 | 8.3 | 23.7 | 75% | 100% | 175 | 165 | 20 |
| N2 Immarien | Ag | 25% | 1 | 358.1 | 24.1 | 106.5 | 75% | 100% | 190 | 155 | 20 |
| N2 Immarien | Au | 25% | 1 | 356.5 | 28.9 | 107.2 | 75% | 100% | 195 | 180 | 20 |
| N2 Immarien | Cu | 25% | 1 | 354.7 | 33.6 | 108.1 | 75% | 100% | 150 | 150 | 20 |
| N2 Immarien | Pb | 25% | 1 | 354.7 | 33.6 | 108.1 | 75% | 100% | 225 | 220 | 20 |
| N2 Immarien | TT | 25% | 1 | 359.6 | 19.3 | 105.9 | 75% | 100% | 225 | 160 | 20 |
| N2 Immarien | Zn | 25% | 1 | 354.7 | 33.6 | 108.1 | 75% | 100% | 280 | 140 | 20 |
| N2_Tizi | Ag | 20% | 1 | 1.5 | 28.9 | 107.2 | 80% | 100% | 180 | 150 | 20 |
| N2_Tizi | Au | 20% | 1 | 1.5 | 28.9 | 107.2 | 80% | 100% | 195 | 180 | 20 |
| N2_Tizi | Cu | 20% | 1 | 314.3 | 72 | 147.1 | 80% | 100% | 135 | 125 | 20 |
| N2_Tizi | Pb | 20% | 1 | 1.5 | 28.9 | 107.2 | 80% | 100% | 330 | 180 | 20 |
| N2_Tizi | TT | 20% | 1 | 1.5 | 28.9 | 107.2 | 80% | 100% | 185 | 150 | 20 |
| N2_Tizi | Zn | 20% | 1 | 1.5 | 28.9 | 107.2 | 80% | 100% | 345 | 155 | 20 |
| S1 | Ag | 30% | 1 | 329.6 | -24.6 | -79 | 70% | 100% | 165 | 125 | 50 |
| S1 | Au | 20% | 1 | 329.6 | -24.6 | -79 | 80% | 100% | 145 | 85 | 50 |
| S1 | Cu | 20% | 1 | 329.6 | -24.6 | -79 | 80% | 100% | 205 | 180 | 50 |
| S1 | Pb | 20% | 1 | 329.6 | -24.6 | -79 | 80% | 100% | 190 | 150 | 50 |
| S1 | TT | 30% | 1 | 329.6 | -24.6 | -79 | 70% | 100% | 230 | 95 | 50 |
| S1 | Zn | 20% | 1 | 329.6 | -24.6 | -79 | 80% | 100% | 265 | 175 | 50 |
| S2 | Ag | 15% | 1 | 114.3 | -69.4 | 13.5 | 85% | 100% | 120 | 120 | 50 |
| S2 | Au | 25% | 1 | 114.3 | -69.4 | 13.5 | 75% | 100% | 115 | 110 | 50 |
| S2 | Cu | 20% | 1 | 114.3 | -69.4 | 13.5 | 80% | 100% | 115 | 110 | 50 |
| S2 | Pb | 15% | 1 | 114.3 | -69.4 | 13.5 | 85% | 100% | 130 | 110 | 50 |
| S2 | TT | 15% | 1 | 114.3 | -69.4 | 13.5 | 85% | 100% | 120 | 95 | 50 |
| S2 | Zn | 15% | 1 | 114.3 | -69.4 | 13.5 | 85% | 100% | 120 | 95 | 50 |
AYA GOLD & SILVER INC., BOUMADINE POLYMETALLIC PROJECT 160
| | | | | | | | | | | | | | | | | | | | | | | | | | | | | | | | | | | |
| Group | Element | Nugget | Number of structures | Major angle (Vulcan input) ° | Semi Major angle (Vulcan input) ° | Minor angle (Vulcan input) ° | Sill | Total Sill | Major Range (m) | Semi Major Range (m) | Minor Range (m) |
| S3 | Ag | 25% | 1 | 72.8 | -41.6 | -18.9 | 75% | 100% | 145 | 105 | 50 |
| S3 | Au | 25% | 1 | 79.2 | -43.1 | -14.5 | 75% | 100% | 195 | 135 | 50 |
| S3 | Cu | 30% | 1 | 79.2 | -43.1 | -14.5 | 70% | 100% | 170 | 120 | 50 |
| S3 | Pb | 25% | 1 | 79.2 | -43.1 | -14.5 | 75% | 100% | 150 | 105 | 50 |
| S3 | TT | 25% | 1 | 79.2 | -43.1 | -14.5 | 75% | 100% | 110 | 105 | 50 |
| S3 | Zn | 25% | 1 | 79.2 | -43.1 | -14.5 | 75% | 100% | 110 | 105 | 50 |
| S4 | Ag | 20% | 1 | 354.8 | -35.4 | -45.3 | 80% | 100% | 350 | 175 | 50 |
| S4 | Au | 20% | 1 | 340 | -20.3 | -52.3 | 80% | 100% | 310 | 175 | 50 |
| S4 | Cu | 20% | 1 | 340 | -20.3 | -52.3 | 80% | 100% | 350 | 175 | 50 |
| S4 | Pb | 20% | 1 | 340 | -20.3 | -52.3 | 80% | 100% | 350 | 175 | 50 |
| S4 | TT | 20% | 1 | 340 | -20.3 | -52.3 | 80% | 100% | 165 | 130 | 50 |
| S4 | Zn | 20% | 1 | 340 | -20.3 | -52.3 | 80% | 100% | 305 | 175 | 50 |
| S5 | Ag | 20% | 1 | 316.5 | -28.9 | - 107.2 | 80% | 100% | 190 | 160 | 50 |
| S5 | Au | 20% | 1 | 316.5 | -28.9 | - 107.2 | 80% | 100% | 160 | 140 | 50 |
| S5 | Cu | 20% | 1 | 169.1 | -56.8 | 118.2 | 80% | 100% | 130 | 140 | 50 |
| S5 | Pb | 20% | 1 | 316.5 | -28.9 | - 107.2 | 80% | 100% | 190 | 140 | 50 |
| S5 | TT | 20% | 1 | 316.5 | -28.9 | - 107.2 | 80% | 100% | 185 | 140 | 50 |
| S5 | Zn | 20% | 1 | 316.5 | -28.9 | - 107.2 | 80% | 100% | 235 | 185 | 50 |
| S6 | Ag | 20% | 1 | 63.7 | -54.7 | 7.1 | 80% | 100% | 200 | 140 | 50 |
| S6 | Au | 20% | 1 | 330.7 | -29.5 | -78.5 | 80% | 100% | 255 | 240 | 50 |
| S6 | Cu | 20% | 1 | 115.2 | -35.4 | 45.3 | 80% | 100% | 280 | 220 | 50 |
| S6 | Pb | 20% | 1 | 72.1 | -53.8 | 13.9 | 80% | 100% | 350 | 175 | 50 |
| S6 | TT | 20% | 1 | 77.1 | -53.8 | 13.9 | 80% | 100% | 320 | 400 | 50 |
| S6 | Zn | 25% | 1 | 72.1 | -53.8 | 13.9 | 75% | 100% | 205 | 145 | 50 |
14.10.5Boundary Analysis
Based on previous structural studies, two principal fault sets are recognized to overprint the northwest-southeast-trending mineralized corridor. Northeast-striking (approximately 020°–200°) faults are interpreted to have controlled Au enrichment and a subsequent Zn mineralizing event, whereas younger east-northeast-striking (approximately 070°–250°) faults are associated with Ag-Pb mineralization cross-cut the earlier structural framework.
Based on this, SRK decided to apply soft boundaries to 16 domains in the southern area and 10 domains in the northern area. For the selected domains, a soft-boundary search distance of 30 m × 30 m × 10 m was applied along the major, semi-major and minor axes for all search passes (Table 14‑6), which allows for any close spaced drilling to influence the block estimates in this region. These domains correspond to cross-cutting vein sets that have similar orientations to these two later fault sets. Where drillhole spacing is sufficient, SRK also observed elevated metal grades associated with these intersecting structures, indicating continuity of mineralization across the domain boundaries and supporting the use of soft boundaries for grade estimation.
Hard boundaries were applied between all remaining mineralized domains and between mineralization and waste, where the boundary analysis indicated distinct grade populations. A comparable structural relationship is described in Section 7 and 9.6.
AYA GOLD & SILVER INC., BOUMADINE POLYMETALLIC PROJECT 161
Table 14‑6 Selected domains with soft boundaries applied
| | | | | | | | | | | |
| Domain with Soft boundary conditions applied |
| 1091 | 1090 | 3291 | 3010 |
| 1501 | 1201 | 3001 | 3011 |
| 1502 | 1202 | 3002 | |
| 1503 | 1203 | 3003 | |
| 1504 | 1040 | 3004 | |
| 1505 | 1003 | 3005 | |
| 1041 | 1004 | 3009 | |
| 1502 | 1007 | 3191 | |
14.10.6Quantitative Kriging Neighbourhood Analysis (QKNA)
Quantitative Kriging Neighbourhood Analysis (QKNA) was undertaken using Supervisor to support the estimation parameters selected by SRK. The analysis was used to optimize and support the selection of the parent block dimensions, the number of discretization points per block, and the minimum and maximum number of samples used during estimation. Supervisor evaluates these parameters by testing the sensitivity of the kriging efficiency and slope of regression to the parameters.
QKNA was undertaken on the capped Au accumulated metal data (grade × true thickness) for four of the most well informed domains (1091, 2091, 3191 and 3291). The output from Supervisor was used to support the selection of the estimation parameters and parent block dimensions. Based on the QKNA results (Figure 14‑17), a parent block size of 5 m × 15 m × 15 m (X, Y and Z), a minimum of three samples, a maximum of seven samples, a search ellipsoid of 200 m × 150 m × 50 m were selected alongside a discretization of 2 x 2 x 2, though discretization was shown not to be sensitive in this Supervisor analysis.
SRK reviewed the QKNA results in conjunction with the resulting block grade estimates and visual and statistical validation prior to finalising the estimation parameters adopted for the 2026 MRE.
AYA GOLD & SILVER INC., BOUMADINE POLYMETALLIC PROJECT 162

Figure 14‑17 Example of QKNA results for block sizes (A) and number of samples used in the search (B) for domain 1091 (south)
AYA GOLD & SILVER INC., BOUMADINE POLYMETALLIC PROJECT 163
14.10.7Block Model and Estimation
A 3D un-rotated block model was generated within Vulcan and sub-blocked by the interpreted mineralization domains, weathering model and the topographic surface.
The block model geometry (extents) and block sizes are presented in Table 14‑7.
Table 14‑7 Boumadine block model framework
| | | | | | | | | | | |
| Description | Easting (X) | North (Y) | Elevation (Z) |
| Block Model Origin (Lower left corner) | 314500 | 3473000 | 0 |
| Mineralization Parent Block Dimension | 5 | 15 | 15 |
| Waste Parent Block Dimension | 90 | 90 | 90 |
| Minium Sub-Block Dimension | 1 | 3 | 3 |
| Rotation | None applied |
The parent block dimensions were selected to reflect the average drillhole spacing along strike and down dip, thereby appropriately representing the expected grade variability while maintaining an acceptable degree of smoothing during estimation. The across-strike 5 m block dimension was selected as most modelled domains are less than 5 m wide. However, given that the estimation approach utilized accumulated metal values (grade × true thickness) and a single point for each drillhole, the across-strike block dimension is not considered to be a sensitive parameter. The parent block dimensions within the mineralized domains are approximately one-third of the nominal 50 m infill drillhole spacing, which currently covers just under half of the modelled mineralization wireframes. The block model parameters selected by SRK were supported by the QKNA conducted in Supervisor, as noted above.
SRK recommends that a change-of-support (parent block size) study be undertaken during the next phase of the Project. This should be completed following additional, closer-spaced (infill drilling - which is ongoing currently) to provide more reliable variogram models and to optimize the parent block dimensions and sample selection criteria for future MRE’s.
14.10.8Grade interpolation
Resource estimation was completed within an area encompassing all modelled mineralized domains.
•Metal accumulation (grade × true thickness) and TT were estimated independently within each mineralized domain using OK. Whilst As and Fe was estimated using the same parameters as the other elements using IDW² instead of OK.
•Top-cuts were applied as described in Section 14.10.2.
•Hard boundary conditions were applied during estimation, except for 16 domains in the southern area and 10 domains in the northern area, where soft boundary conditions were employed using a search distance of 30 m × 30 m × 10 m, as described in Section 14.10.5.
•Sub-blocks were assigned the estimated grade of their parent block.
•Sample selection criteria were developed through a combination of visual assessment supported by QKNA undertaken in Supervisor.
•Search ellipsoids were orientated locally to the geometry of each mineralized domain using Vulcan's Local Varying Anisotropy (LVA) functionality (also commonly referred to as dynamic anisotropy). Final block grades were calculated by dividing the accumulation estimate by the TT estimate for each element, in each block.
AYA GOLD & SILVER INC., BOUMADINE POLYMETALLIC PROJECT 164
14.10.9Estimation Parameters
The selection of the search radii were guided by modelled continuity from the variograms, the typical sample spacing and the QKNA assessment undertaken in Supervisor. The search neighbourhood and sample selection parameters were further refined through a series of initial estimation runs, which were visually reviewed to optimize the estimation parameters. This resulted in the adoption of octant-based sample selection during grade estimation. In some domains, the minimum and maximum sample selection criteria were adjusted to account for limited sample support and to ensure that all domains could be estimated.
The search neighbourhood comprised two successive search passes using the following parameters:
•Pass 1: 200 m x 150 m x 50 m, with a minimum of three and maximum of seven samples, and a maximum of two samples per octant.
•Pass 2: 500 m x 500 m x 500 m, with a minimum of two and maximum of five samples, and a maximum of two samples per octant.
LVA was employed for the estimation of all domains. Three-dimensional surfaces representing the centre of each mineralized vein were constructed and used to calculate the local dip and dip direction throughout the block model. These locally varying orientations were referenced during each estimation pass to align the search ellipsoid with the geometry of each mineralization domain (Figure 14‑18). The same local orientations were also applied to the variogram models; however, the plunge was fixed based on the geostatistical assessment (Table 14‑8).
AYA GOLD & SILVER INC., BOUMADINE POLYMETALLIC PROJECT 165

Figure 14‑18 Vertical section (looking north) of a modelled domains (red and green) with local search ellipses shown (blue) to demonstrate application of LVATable 14‑8 Fixed plunge applied to the estimation group
| | | | | | | | | | | |
| Group | Element | Azimuth | Dip |
| C1 | All (including TT | 128.5 | -13.6 |
| C2 | All (including TT | 117.3 | -32.8 |
| C4 | All (including TT | 148.2 | -16.3 |
| N1 | All (including TT | 203.6 | 6.3 |
| N2_Immarien | All (including TT | 354.7 | 33.6 |
| N2_Tizi | All (including TT | 1.5 | 28.9 |
| N6_DirectionOnly | All (including TT | 118.3 | -49 |
| S1 | All (including TT | 329.6 | -24.6 |
| S2 | All (including TT | 114.3 | -69.4 |
| S3 | All (including TT | 79.2 | -43.1 |
| S4 | All (including TT | 340 | -20.3 |
| S5 | All (including TT | 316.5 | -28.9 |
| S6 | All (including TT | 72.1 | -53.8 |
AYA GOLD & SILVER INC., BOUMADINE POLYMETALLIC PROJECT 166
14.10.10Density Estimation
A dry in situ density (density) was estimated into the parent block model using IDW². Prior to estimation, SRK reviewed the available density database labelled as SGDRY, to assess its suitability for MRE. During this review, it was observed that the frequency of measured density values within the weakly mineralized and waste sample intervals was substantially lower than the frequency of density measurements collected from the corresponding MS intervals, as discussed in Section 11.6. Consequently, the measured density database alone was considered insufficient to adequately represent the density distribution throughout the deposit.
To reduce this sampling bias, SRK evaluated the relationship between measured dry in situ density (SGDRY) and the calculated total sulphide content (Section 14.4) within the modelled mineralized domains. A broad positive correlation was observed, whereby dry in situ density generally increased with increasing total sulphide content, although the relationship was non-linear.
Several potentially anomalous density measurements were identified during the review. Thirteen samples (shown in orange in Figure 14‑19) were considered to be erroneous, and their SGDRY values were excluded entirely from the density database. The remaining anomalous measurements (shown in red and blue in Figure 14‑19) were retained within the density database but excluded from the regression analysis. Consequently, only the samples shown in green in Figure 14‑19 were used to derive the regression relationship. Figure 14‑20 illustrates the regression fitted to the retained density data, which was subsequently used to estimate density for samples lacking measured SGDRY values. The regression equation is:
Equation 6:
AYA GOLD & SILVER INC., BOUMADINE POLYMETALLIC PROJECT 167
Figure 14‑19 Coded density database showing the 13 SGDRY samples excluded from the analysis (orange), SGDRY samples retained but excluded from the regression (red and blue) and samples retained for the regressional analysis (green)
AYA GOLD & SILVER INC., BOUMADINE POLYMETALLIC PROJECT 168
 Figure 14‑20 Plot showing regression applied to density database used to determine density when no SGDRY values have been recorded
Based on this relationship, density values were assigned to the coded density database using the following hierarchy:
•Samples identified as "Excluded from regression" (13 samples) were assigned density values calculated using the regression (Figure 14‑20).
•Where measured density values (SGDRY) were available for a given SAMPLEID, the measured values were used directly. Where multiple density measurements existed for the same SAMPLEID, a length-weighted average density was assigned.
•Where no measured density value was available, density was estimated from the calculated total sulphide content using the regression.
Density values were assigned at the assay sample interval (including measured values SGDRY), as the regression relationship was developed using total sulphide values calculated from the assay intervals.
Several drillholes contained neither SGDRY values nor sufficient analytical data to calculate total sulphide content. Consequently, density could not be assigned to these intervals and they remained unpopulated within the coded density database.
A single density composite was subsequently generated for each estimation interval and estimated into the parent block model using IDW². Unlike the grade estimation, density was estimated directly and was not converted to accumulated value (density × true thickness) prior to interpolation.
AYA GOLD & SILVER INC., BOUMADINE POLYMETALLIC PROJECT 169
In total, 1,848.9 m of sample intervals were assigned measured SGDRY values (based on the Aya sampleID), while 4,554.3 m were assigned density values derived from the regression relationship. Of the intervals for which density could be assigned, approximately 29% were therefore based on measured SGDRY values and 71% on regression-derived values. A further 640.0 m of sample intervals (approximately 9% of the total interval length considered) remained unpopulated because neither measured density nor sufficient analytical data were available to derive a density value. The density search neighbourhood utilized the same set of parameters as the grade estimate (search passes, size of ellipse and number of samples).
A fixed waste density of 2.75 t/m³ was assigned to fresh waste and 2.65 t/m³ to transitional (weathered) waste. These values represent the average measured dry in situ density (SGDRY) within the respective waste domains.
Within the transitional mineralized domains, the estimated density was reduced by 10%. This adjustment was applied because only 17 measured density values were available for the transitional mineralized material, which SRK does not consider sufficient to adequately represent the density characteristics of this domain.
Based on the above observations, SRK recommends that Aya expand its density data collection program, as discussed in Section 14.4. Additional density measurements should be collected across the full weathering profile from a representative range of both mineralized and waste intervals, with the current SRK mineralization wireframes used as a guide for sample selection. This may require additional drilling of the upper portions of the deposit. This additional data should also be used to validate and, where appropriate, refine the sulphide-density regression relationship. In addition, SRK recommends that Aya collect density measurements from drillholes that currently contain no density information in order to improve the spatial coverage of the density database and support future MRE.
The long-term objective should be to estimate density from measured dry in situ density values, thereby removing the reliance on regression-derived estimates.
Following density estimation, block tonnages were calculated by multiplying the estimated dry in situ density by the corresponding parent block volume.
14.10.11Proportion of blocks filled in each search pass
On average, approximately 75% of the mineralized blocks were estimated during the first search pass, with the remaining 25% estimated during the second search pass. The relatively high proportion of blocks estimated during the first search pass is considered appropriate given the current drilling density, the quantity of available sample data across much of the deposit, and the optimized search ellipsoid and sample selection parameters adopted for the estimation.
14.11Block Model Validation
14.11.1Introduction
The block model estimates were validated by completing the following checks:
•global validation by comparison of the composite grade statistics for the back calculated drillhole grades (metal accumulation/thickness) versus block grade assay statistics,
•local validation using visual inspections on sections and plans, viewing the 2D composites metal accumulations and back calculate drillhole grades (metal accumulation /thickness) versus block grades, as well as density values and
•local validation by comparison of average composite grades with average block grades (metal accumulations) and density samples along different directions (swath plots).
AYA GOLD & SILVER INC., BOUMADINE POLYMETALLIC PROJECT 170
14.11.2Global statistics
The back calculated mean composite grades (metal accumulation/thickness) were compared to the mean, density weighted, estimated block grades to globally validate the estimates. Appendix C compares Ag, Au, Cu, Pb and Fe and Zn values. SRK did not apply declustering to the composite dataset prior to this comparison. In general, SRK considers that a difference of within ±10% between the mean composite grades and the estimated block grades represents an acceptable level of agreement. For some elements within certain domains, differences greater than ±10% were observed. These differences are primarily associated with domains having limited sample support, clustered drilling, rapid variations in the thickness of the modelled mineralization wireframes, or relatively low mean elemental values, where small absolute differences can result in comparatively large percentage differences.
To assess whether these differences represent estimation bias, the block model was further validated through detailed visual comparison of the estimated block grades against the accumulated metal composites and back calculated mean composite grades (metal accumulation/thickness) on plans, sections and in 3D. This review confirmed that the observed differences do not represent a systematic bias in the estimation process.
SRK considers that the global estimates for Ag, Au, Cu, Pb and Zn provide a reasonable representation of the drillhole grades and that no significant global estimation bias has been introduced. As expected, the strongest correlation between composite and block grades is observed within the well-supported estimation domains, whereas domains with limited sample support and/or clustered drilling exhibit a lower degree of correlation.
14.11.3Visual validation
The metal accumulation and back calculated assay grades (meatal accumulation / thickness), coloured by Ag (g/t), Au (g/t), Cu (%), Pb (%) and Zn (%) grade as well as true thickness (m) and density values, were viewed on sections and plans and compared to the block model. These inspections confirmed that the estimates locally conform to the composites. Figure 14‑21 to Figure 14-30 are examples of the visual validation conducted by SRK coloured by an appropriate legend.
AYA GOLD & SILVER INC., BOUMADINE POLYMETALLIC PROJECT 171

Figure 14‑21 Long section of domain 1031, A = block model vs capped metal accumulation composites (grade x thickness) for Au, B = block model vs back calculated Au g/t grades (metal accumulation /. thickness)
AYA GOLD & SILVER INC., BOUMADINE POLYMETALLIC PROJECT 172
 Figure 14‑22 Long section of domain 1091, A = block model vs capped metal accumulation composites (grade x thickness) for Zn, B = block model vs back calculated Zn % grades (metal accumulation /. thickness)
AYA GOLD & SILVER INC., BOUMADINE POLYMETALLIC PROJECT 173
 Figure 14‑23 Long section of domain 2091, A = block model vs capped metal accumulation composites (grade x thickness) for Ag, B = block model vs back calculated Ag g/t grades (metal accumulation /. thickness)
AYA GOLD & SILVER INC., BOUMADINE POLYMETALLIC PROJECT 174
 Figure 14‑24 Long section of domain 3103, A = block model vs capped metal accumulation composites (grade x thickness) for Pb, B = block model vs back calculated Pb % grades (metal accumulation /. thickness)
AYA GOLD & SILVER INC., BOUMADINE POLYMETALLIC PROJECT 175

Figure 14‑25 Long section of domain 3193, A = block model vs capped metal accumulation composites (grade x thickness) for Cu, B = block model vs back calculated Cu % grades (metal accumulation /. thickness)
AYA GOLD & SILVER INC., BOUMADINE POLYMETALLIC PROJECT 176

Figure 14‑26 Long section of domain 3193, A = block model vs true thickness m
AYA GOLD & SILVER INC., BOUMADINE POLYMETALLIC PROJECT 177

Figure 14‑27 Long section of domain 2091, A = block model vs density composites (tm/3)
AYA GOLD & SILVER INC., BOUMADINE POLYMETALLIC PROJECT 178

Figure 14‑28 Cross section in the Southern area through 317165 X and 3475490 Y (azimuth 340° dip 90°) showing block model vs back calculated Ag g/t (A), Au g/t (B), Cu % (C), Fe % (D), Pb % (E) and Zn % (F) grades (12 m slicing width)
AYA GOLD & SILVER INC., BOUMADINE POLYMETALLIC PROJECT 179

Figure 14‑29 Cross section in the Central area through 316911 X and 3477037 Y (azimuth 340° and dip 90°) showing block model vs back calculated Ag g/t (A), Au g/t (B), Cu % (C), Fe % (D), Pb % (E) and Zn % (F) grades (12 m slicing width)
AYA GOLD & SILVER INC., BOUMADINE POLYMETALLIC PROJECT 180
 Figure 14‑30 North south cross section in the Northern area through 315420. X and 3478310 Y (azimuth 0° and dip 90°) showing block model vs back calculated Ag g/t (A), Au g/t (B), Cu % (C), Fe % (D), Pb % (E) and Zn % (F) grades (20 m slicing width)
AYA GOLD & SILVER INC., BOUMADINE POLYMETALLIC PROJECT 181
14.11.4Swath plots and grade distribution
The block models were also validated by comparing average metal accumulation composite grades and average block grades along different directions (swath plots) and through comparing grade distributions (histograms) of the block model and composite file.
Figure 14‑31 to Figure 14‑34 show examples of swath plots and histograms from some of the best informed domains. The charts show capped metal accumulation composite grades (blue line) against estimated metal accumulation block estimates (grey line), as well nearest neighbour estimate of the metal accumulation (orange line). The numbers of composites used are plotted as blue bars and the model tonnages as red bars on the charts. SRK has not presented the declustered composites in the images below.
Here, and likewise in other domains, the mean composite grades and the mean estimated block grades follow similar trends in all directions. The capped estimates are somewhat smoother than the composite grades, particularly where there are limited samples or very high-grade composites, as demonstrated by the nearest neighbour estimates.
It is SRK’s opinion that the estimate is a reasonable representation of the input composites at the current level of sampling. It should be noted that SRK chose to only cap extremely high grade (raw assays and a metal accumulation values) composites in the domains allowing the representation of the locally higher-grade internal structures.
AYA GOLD & SILVER INC., BOUMADINE POLYMETALLIC PROJECT 182
Figure 14‑31 Mean metal accumulation (Au) composite Grades (blue line) compared to Block Estimate Grades (orange = OK estimate and grey = nearest neighbour estimate) for domain 1031: swaths along easting (upper left), northing (upper right), elevation (lower left)
 Figure 14‑32 Mean metal accumulation (Au) composite Grades (blue line) compared to Block Estimate Grades (orange = OK estimate and grey = nearest neighbour estimate) for domain 1091: swaths along easting (upper left), northing (upper right), elevation (lower left)
AYA GOLD & SILVER INC., BOUMADINE POLYMETALLIC PROJECT 183

Figure 14‑33 Mean metal accumulation (Ag) composite Grades (blue line) compared to Block Estimate Grades (orange = OK estimate and grey = nearest neighbour estimate) for domain 2091: swaths along easting (upper left), northing (upper right), elevation (lower left)
AYA GOLD & SILVER INC., BOUMADINE POLYMETALLIC PROJECT 184

Figure 14‑34 Mean metal accumulation (Zn) composite grades (blue line) compared to block estimate grades (orange = OK estimate and grey = nearest neighbour estimate) for domain 3191: swaths along easting (upper left), northing (upper right), elevation (lower left)
AYA GOLD & SILVER INC., BOUMADINE POLYMETALLIC PROJECT 185

Figure 14‑35 Density composite grades (blue line) compared to block density values (orange = OK estimate) for domain 2091: swaths along easting (upper left), northing (upper right), elevation (lower left)14.11.5Validation summary
SRK is satisfied that the estimates of density, Au, Ag, Cu, Pb and Zn are a reasonable representation of the input composites at the current level of sampling and that no global biases have been introduced.
14.12Mineral Resource Classification
The 2026 MRE for Boumadine has been classified in accordance with the CIM Definition Standards. Mineral Resource classification is inherently a matter of professional judgement and should consider confidence in the geological interpretation, geological and grade continuity, the quality and quantity of the supporting exploration data, and confidence in the estimated tonnage and grades. These factors should be considered collectively to define contiguous areas of similar confidence.
SRK applied these principles through an integrated assessment of the geological interpretation, drilling density, data quality, estimation quality, and grade continuity. Classification wireframes were developed to define contiguous zones of similar confidence rather than assigning classification on a block-by-block basis. Consequently, some isolated blocks that individually satisfy the classification criteria have been excluded from the final classified volumes to maintain coherent classified volumes.
AYA GOLD & SILVER INC., BOUMADINE POLYMETALLIC PROJECT 186
The 2026 MRE is supported by drilling completed by Aya and Maya. Historical drilling programs, principally those completed prior to 2018, were excluded from the geological model and 2026 MRE where drillhole locations or sampling quality could not be adequately verified. Review of the QA/QC data indicates that Aya's drilling, sampling and analytical procedures are appropriate for MRE and do not indicate any significant systematic sampling or analytical bias.
Confidence in the geological interpretation is considered moderate to high within the principal mineralized structures, which are supported by modern drilling, surface and underground mapping, historical artisanal workings, historical BRPM underground development, and locally by oriented core measurements, typically were there are four or more individual drill hole intercepts. Geological continuity is locally disrupted by east-west- and N30°-striking faults, resulting in areas of increased uncertainty in the interpreted mineralized volumes. Confidence decreases towards the peripheral vein systems and at depth, where drilling density is limited and structural controls are not well understood.
Confidence in grade continuity is supported by experimental variography and the ongoing infill drilling program. Variogram models of the principal mineralized domains indicate major-axis continuity of approximately 145 m to 250 m, with approximately 70% to 80% of the total grade variance explained within distances of approximately 40 to 60 m. Historical BRPM underground mapping and sampling provide additional qualitative support for the continuity of the principal massive sulphide veins.
The Mineral Resource has been classified principally on the basis of drillhole spacing, geological continuity, grade continuity, and the quality of the estimation support. SRK reviewed the drillhole spacing for each estimation domain in conjunction with the geological interpretation, variography, and the number of informing composites contributing to each estimate. Areas supported by nominal drillhole spacings of approximately 50 m (across a minimum of 3 drillhole fences), where the geological interpretation is well constrained and blocks are informed by multiple drillhole intersections, have been classified as Indicated Mineral Resources. Furthermore, any areas that initially satisfied the criteria for Indicated Mineral Resources within the transitional (weathered) zone were subsequently downgraded to Inferred Mineral Resources. This reflects the limited density data available within the transitional mineralized material, the lack of metallurgical testwork to demonstrate that the material can be processed using the proposed processing route and uncertainty regarding the depth/extent of artisanal surface mining.
Areas supported by nominal drillhole spacings of up to approximately 100 m, where geological and grade continuity remain reasonable but confidence is lower, have been classified as Inferred Mineral Resources, provided that the estimates are informed by multiple drillhole intersections. Any domains supported by three or less drillhole intercepts (typically along a single fence of drilling), or that do not satisfy the Inferred Mineral Resource classification criteria, have not been classified by SRK.
No Measured Mineral Resources have been classified by SRK.
The Inferred Mineral Resource requires additional infill drilling to improve confidence in the geological interpretation, density model, and local grade estimation before consideration can be given to upgrading the classification or supporting detailed mine planning. The resulting Mineral Resource classification is illustrated in Figure 14‑36.
AYA GOLD & SILVER INC., BOUMADINE POLYMETALLIC PROJECT 187
 Figure 14‑36 View of the block model coloured by Mineral Resource classification (orange=Indicated, green=Inferred and grey = unclassified) in relation to the estimation composites (black)
14.13Mining Depletion
The Boumadine deposit has been exploited primarily by underground mining undertaken by BRPM, SODIM and SODECAT between 1986 and early 1992. Also, older exploitation, focussed on near surface mineralization was completed. Records, including maps of the historical underground workings were captured in a local Mine grid. These maps were transformed from the historical local mine grid into the Project UTM coordinate system by GoldMinds Geoservices Inc., providing the basis for incorporating the historical mining information into this MRE (Figure 14‑37).
As discussed in Section 12.2.3, and 12.3, SRK reviewed the georeferenced plans and considers that they provide an appropriate representation of the overall mining geometry for geological interpretation and depletion purposes. However, location discrepancies remain evident between some of the georeferenced underground workings and the interpreted mineralization wireframes. This is considered to reflect the uncertainty associated with the historical mine surveys and the georeferencing process, rather than inaccuracies in the geological model. In several areas, the mined voids do not coincide with the current geological interpretation. It is known that the historical mining targeted the massive sulphide mineralization, whereas the current SRK mineralization wireframes also include adjacent lower-grade mineralization (semi massive and disseminated sulphides). The offsets between the as-built wireframes and the interpreted mineralization could result in portions of mined material remaining within the MRE if depletion were applied solely using the historical mine voids.
SRK also reviewed recent high-resolution satellite imagery to identify areas of historical artisanal mining at surface, which were incorporated into the depletion model where appropriate using a 5m buffer from surface, this buffer also incorporated the QP’s site visit observations (GPS points).
AYA GOLD & SILVER INC., BOUMADINE POLYMETALLIC PROJECT 188

Figure 14‑37 Underground mining as-builts (stopes = blue and development = black) provided by Aya (location central area)
To ensure that all mineralization believed to have been extracted by underground mining methods was appropriately depleted from the 2026 MRE, SRK constructed additional depletion adjustment wireframes (cookie cutters) in areas where the interpreted mineralized veins and the historical underground workings are (locally) offset (Figure 14‑38). These adjustment solids were designed to fully deplete the mineralized vein targeted by the historical (BRPM, SODIM and SODECAT) underground operations while preserving the overall geological interpretation. The depletion adjustment wireframes were used to trigger local sub-blocking and populate the ugflag field within the block model. This field identifies material interpreted to have been extracted through historical underground mining but which is not necessarily represented within the historical as-built mine void wireframes due to the positional discrepancies discussed above. Aya was informed of the approach and depletion coding prior to finalization of this step.
The following domains have been depleted by SRK:
•1030,1090, 1092, 2004, 2012, 2091, 2104, 2203, 2207, 2314, 3291 and 4002.
AYA GOLD & SILVER INC., BOUMADINE POLYMETALLIC PROJECT 189
 Figure 14‑38 Cross-section looking north at mined as-builts provided by Aya (grey) which is offset from mineralization (mined veins denoted on figure), in relation to SRK depletion adjustment shape (red outline) used to deplete 1030 and 1091
14.14Reconciliation
SRK was provided with limited historical production records, comprising the total tonnes mined only, the grades provided relate to a subset of mining areas specific dates, therefore SRK did not include the grades in the comparison below. No detailed information was provided identifying the specific areas of the deposit mined during individual production periods. Consequently, a direct reconciliation between the historical production records and the depleted MRE for specific areas could not be undertaken. Therefore, SRK compared the total depleted tonnage represented within the block model against the reported historical production (Table 14‑9). In order to check the production tonnage reported by BRPM, Aya provided SRK with the tailings volume, which, using a density of 2.0 t/m3, this equated to 270 Kt, which is only 9 Kt more than the production tonnage reported in Table 14‑9.
As discussed in Section 14.13, there remains a degree of uncertainty regarding the spatial position of the historical underground workings owing to the accuracy of the original mine surveys and the subsequent georeferencing process used to construct the 3D depletion solids. Consequently, it cannot be confirmed that all historical underground mining has been fully represented within the depletion model. In addition, historical artisanal mining at surface has been depleted from the MRE were identified but is not believed to be represented within the reported historical production records, further contributing to differences between the two datasets.
Additional uncertainty arises from the mining methods employed historically. Mining is understood to have been controlled principally using geological mapping, sectional interpretations, underground channel sampling and underground drilling, rather than modern 3D geological and mine planning models. Furthermore, the historical mining is understood to have primarily targeted the massive sulphide mineralization at a relatively high cut-off grade (BRPM reported that the mining cut-off grade was relatively high owing to the marginal economics of the Project at the time), whereas the current SRK mineralization wireframes also include
AYA GOLD & SILVER INC., BOUMADINE POLYMETALLIC PROJECT 190
adjacent lower-grade mineralization (semi massive and disseminated sulphides) considered to exhibit reasonable geological continuity and economic potential. It is also unknown to what extent mining dilution, overbreak and underbreak affected the historical mining operations.
In total, SRK depleted 485 kt from the block model, representing all material contained within the depletion shapes. The difference between the depleted block model tonnage and the reported historical production is approximately 46% (261 Kt compared with 485 Kt). In SRK's opinion, these differences are considered reasonable given the uncertainties associated with the historical mine surveys, depletion methodology, historical mining practices, changes in the geological interpretation (inclusion of lower grade material within the 2026 wireframes), and the limited historical production information available for review.
SRK cautions the reader against making a direct comparison between the historical production records and the depleted tonnage and grades without considering the uncertainties discussed above. Should underground mining recommence at the Project, SRK recommends that future production stopes are surveyed and routinely reconciled against the geological model and production records. Where safe and practicable, SRK also recommends that Aya resurvey the accessible historical underground workings once these have been dewatered as well as the surface artisanal excavations to further improve the accuracy of the depletion model for future MRE’s and mining studies.
Table 14‑9 Comparison of Mines Production Record and Depleted Block Model
| | | | | | | | | | | | | | | | | | | | |
| Mined | Mt | Ag g/t% | Au g/t | Cu % | Pb % | Zn% |
| Production | 261,000 | N/A | N/A | N/A | N/A | N/A |
| SRK Model | 484,503 | 82.64 | 2.89 | 0.13 | 0.57 | 2.46 |
| Difference | 223,503 | N/A |
| % Difference | 46% |
14.15Economic and Technical Input Parameters
Aya developed a Net Smelter Return (NSR) model and cut-off value calculations for both open pit and underground reporting for the Project, which were independently reviewed by SRK. Following several minor amendments, these were adopted for reporting the 2026 Boumadine Mineral Resource Statement. The NSR and associated cut-off values were developed to determine the quantities of material offering "...reasonable prospects for eventual economic extraction", in accordance with CIM requirements, for both open pit and underground mining scenarios.
Aya used reasonable mining and processing assumptions to develop the reporting NSR cut-off values for both open pit and underground Mineral Resource reporting. The NSR reflects the Project location, with a number of input parameters derived from the 2025 Aya PEA, including metallurgical recovery assumptions, mining, processing, treatment charges, penalties, royalites and transportation costs. The NSR cut-off represents the cost of mining, processing and shipping one tonne of mineralized material, including general and administrative (G&A) costs. The parameters used in the NSR calculation are provided in Table 13‑10 to Table 13‑14. The costs in Table 13‑14 have been rounded to a single decimal place.
The metal prices in Table 13‑10 to Table 13‑12 adopted for Mineral Resource reporting are based on the 2025 Aya PEA. In the opinion of the QP, these metal price assumptions are appropriate and consistent with the "reasonable" and "eventual" economic extraction requirements for Mineral Resource reporting.
SRK notes that open pit Mineral Resources take priority over underground Mineral Resources in order to reflect the assumed mining sequence, whereby open pit mining is expected to precede underground mining. Prior to the pit optimization in Whittle software, the block model was regularised to 5 × 5 × 5 m parent blocks. The open pit Mineral Resource Statement was subsequently reported from the in situ sub-block model using a
AYA GOLD & SILVER INC., BOUMADINE POLYMETALLIC PROJECT 191
marginal NSR cut-off of USD 60/t, based on the technical and economic assumptions listed in Table 13‑14, and includes only classified blocks that occur within, or are intersected by, the conceptual open pit shell that have not been depleted.
In conjunction with the open pit reporting, SRK generated grade shells in Leapfrog to define realistic underground mining targets using an underground NSR cut-off of USD 110/t (Table 13‑14). Areas exceeding this threshold and with a mineralized thickness greater than 1.5 m (assumed minimum mining thickness) were delineated. For mineralized zones less than 1.5 m thick, an NSR × thickness criterion was applied, whereby only blocks with values of 165 (110 (NSR) x 1.5 (thickness)) or greater were considered for reporting. Following this, SRK removed small and isolated grade shells, that were considered unlikely to be mined using underground mining methods, before reporting.
The resulting grade shells, were used to constrain the reporting of the underground Mineral Resource (classified material only). No additional cut-off value was applied directly to the block model. Instead, the entire classified mineralized volume enclosed by the mineable grade shells was reported (waste is excluded), as the shells represent the minimum mining selectivity assumed for the proposed underground mining method at Boumadine. The 2025 Aya PEA states that underground mining will be undertaken using the Avoca mining method, a variation of longhole stoping that uses rockfill as backfill.
SRK recommends that future MRE’s incorporate a Mineable Stope Optimizer (MSO) using parameters representative of the proposed underground mining method.
The calculated NSR $/t is as follows:
The calculation is based on metal prices of 2,800 USD/oz Au, 30 USD/oz Ag, 4.6 USD/lb Cu, 1.0 USD/lb Pb and 1.2 USD/lb Zn.
SRK notes the following opportunities to improve the robustness of the NSR calculation in future versions:
•Royalty has been deducted from the NSR formula using a constant 6.75 USD/t based on the 2025 PEA results. While this is not necessarily incorrect, it is less clear than the usual approach, where royalty would be deducted directly from the concentrate streams, so it remains linked to the value drivers. SRK recommends updating the royalty calculation accordingly in future versions.
•Penalties and minimum deductions are currently included in the treatment charge assumptions. SRK recommends that penalties and deductions are modelled separately from treatment charges, using concentrate grades as inputs, so that the calculation remains linked to changes in concentrate grades.
•Freight costs are currently included in operating costs rather than in the NSR calculation. This treatment is acceptable if applied consistently. However, NSR calculations typically include all realization costs, including freight, because these costs are directly linked to the saleable concentrate mass. SRK recommends moving freight costs into the NSR calculation in future versions.
•Concentrate mass calculations use the original plant feed grades for each concentrate stream. Strictly, Pb concentrate should be based on plant feed grades, Zn concentrate should be based on Pb-circuit tailings grades, and pyrite concentrate should be based on Zn-circuit tailings grades. This would affect the calculated mass pull and therefore shipment costs. The difference is expected to be immaterial for Pb
AYA GOLD & SILVER INC., BOUMADINE POLYMETALLIC PROJECT 192
and Zn concentrates but may be more relevant for pyrite concentrate. SRK recommends reviewing this basis in future versions, particularly the Fe feed grade used for the pyrite concentrate calculation.
It should be noted that Aya also reports silver (AgEq) and gold equivalent (AuEq) grades. However, these are based solely on metal prices and metallurgical recoveries and do not incorporate the full range of modifying factors included in the NSR calculation (treatment, payability, freight, penalties, royalties and smelter charges). Consequently, the equivalent grades were not used for optimization or Mineral Resource reporting. The calculation of the equivalents follows the same principal as Aya 2025 PEA, and these have been provided for comparative use only. SRK recommends calculating the equivalent grade using NSR factors. This approach will avoid any inconsistency with the NSR framework already in place, making the process more straightforward.
The calculated Ag equivalent (AgEq) is as follows:
The calculated Au equivalent (AuEq) is as follows:
Table 14‑10 NSR Zinc Concentrate Calculation
| | | | | | | | |
| NSR Zinc Concentrate |
| Description | Unit | Zn Con Zn |
| Commodity price | USD/lb | 1.2 |
| Concentrator recovery | % | 74.7% |
| Concentrate grade | % | 57.4 |
| Payability | % | 85.0% |
| Treatment charge | USD/t dmt | 205.5 |
| Freight cost* | USD/t wmt | 0 |
AYA GOLD & SILVER INC., BOUMADINE POLYMETALLIC PROJECT 193
| | | | | | | | |
| NSR factor | USD/t per % | 14.12 |
*Freight costs are included in the operating costs and set to zero in the NSR calculation |
Table 14‑11 NSR Lead Concentrate Calculation
| | | | | | | | | | | | | | | | | |
| NSR Lead Concentrate |
| Description | Unit | Pb Con Pb | Pb Con Cu | Pb Con Au | Pb Con Ag |
| Commodity price | USD/lb or USD/oz | 1 | 4.6 | 2,800 | 30 |
| Concentrator recovery | % | 82.0% | 73.4% | 23.8% | 50.4% |
| Concentrate grade | % Pb | 29.6 | | | |
| Payability | % | 89.9% | 90.0% | 95.0% | 95.0% |
| Refining charge | USD/oz | | | 30 | 1.5 |
| Treatment charge | USD/t dmt | 122 | | | |
| Freight cost* | USD/t wmt | 0 | | | |
| NSR factor | USD/t per % or g/t | 12.87 | 66.95 | 20.14 | 0.44 |
*Freight costs are included in the operating costs and set to zero in the NSR calculation |
Table 14‑12 NSR Pyrite Concentrate Calculation
| | | | | | | | | | | |
| NSR Pyrite Concentrate |
| Description | Unit | Py Con Au | Py Con Ag |
| Commodity price | USD/oz | 2,800 | 30 |
| Fe recovery | % | 89.0% | |
| Pyrite concentrate Fe grade | % Fe | 38.1 | |
| Payability | % | 78.0% | 78.0% |
| Freight cost* | USD/t wmt | 0 | |
| NSR factor | USD/t per g/t | 50.14 | 0.31 |
*Freight costs are included in the operating costs and set to zero in the NSR calculation |
Table 14‑13 Total NSR by Element
| | | | | | | | | | | | | | | | | | | | |
| Total NSR By Element |
| Description | Unit | Pb | Zn | Au | Ag | Cu |
| Zinc concentrate | USD/t per % or g/t | | 14.12 | | | |
| Lead concentrate | USD/t per % or g/t | 12.87 | | 20.14 | 0.44 | 66.95 |
| Pyrite concentrate | USD/t per % or g/t | | | 50.14 | 0.31 | |
| Total NSR factor | USD/t per % or g/t | 12.87 | 14.12 | 70.27 | 0.75 | 66.95 |
Table 14‑14 Cut-off value calculation
| | | | | | | | |
| Parameters | Unit | USD/t |
| Processing rate per annum | Mtpa | 2.9 |
|
| Cost assumptions | | |
| Government rent (mining tax) | USD/t | 0.3 |
| General and administrative | USD/t | 6 |
|
| Mining - Open pit | | |
| Open pit grade control, drilling and assay | USD/t | 1.1 |
| Mineralised material mining cost | USD/t | 2 |
| Waste mining cost | USD/t | 1.5 |
| Surface haul and rehandle | USD/t | 2 |
AYA GOLD & SILVER INC., BOUMADINE POLYMETALLIC PROJECT 194
| | | | | | | | |
| Pit Angle | ° | 47 |
|
| Mining - Underground | | |
| Underground stoping, including backfill | USD/t | 35 |
| Underground operating development | USD/t | 13.3 |
| Underground owners costs | USD/t | 5.3 |
| Surface haul and rehandle | USD/t | 2 |
|
| Processing | USD/t | 17.3 |
| Concentrates Shipment | | |
| Lead concentrate | USD/t | 1.5 |
| Zinc concentrate | USD/t | 1.9 |
| Pyrite concentrate | USD/t | 28.2 |
|
| Water + TSF | USD/t | 0.4 |
|
| Cut-off Values | | |
| Open pit costs | USD/t | 59.1 |
| Open pit cut-off value for MRE reporting | USD/t | 60 |
| Underground costs | USD/t | 111.2 |
| Underground cut-off value for MRE reporting | USD/t | 110 |
* costs in the above have been rounded to a single decimal place14.16Mineral Resource Statement
The SRK 2026 Mineral Resource Statement (MRS) for the Boumadine deposit is presented in Table 14‑15. The 2026 MRE is reported and classified in accordance with the CIM Definition Standards for Mineral Resources and Mineral Reserves (May 2014) and NI43-101 Standards of Disclosure for Mineral Projects (May 2016).
The 2026 MRE has an effective date of 28 February 2026, and has been depleted to reflect the current understanding of the historic mining. The Mineral Resources are limited to classified material contained within conceptual open pit shell reported above the NSR reporting cut-off of 60 USD/t and, below the pit shell, to classified material contained within grade shells (following the removal of isolated shapes) based on a 110 USD/t NSR cut-off, that satisfy a 1.5 m minimum minable thickness. The Mineral Resources are reported within the Boumadine Mining Licence on an in-situ, undiluted basis and amount to:
•Indicated Mineral Resources (open pit and underground) of some 8,582 kt, at a mean grade of 121.7 g/t Ag, 1.9 g/t Au, 0.09 % Cu, 1.01 % Pb and 2.19 % Zn; and
•Inferred Mineral Resources (open pit and underground) of some 45,365 kt, at a mean grade of 56.8 g/t Ag, 1.8 g/t Au, 0.08 % Cu, 0.58 % Pb and 1.33 % Zn.
The reader is cautioned that the results from this study are used solely for the purpose of testing the “reasonable prospects for economic extraction” and do not represent an attempt to estimate Mineral Reserves. The results are used as a guide to assist in the preparation of a MRS.
The Company’s Boumadine Mining Licence permit expired in May 2026. Aya have informed SRK that they are currently in the processes of renewing the Licence (no change to the extent or conditions) for an additional 10 years. Whilst the licence renewal approval is currently pending, the Company has informed SRK that they see no reason why this will not be successful.
AYA GOLD & SILVER INC., BOUMADINE POLYMETALLIC PROJECT 195
Table 14‑15 SRK Mineral Resource Statement for the Boumadine Project, Morrocco, as at an effective date of 28 February 2026
| | | | | | | | | | | | | | | | | | | | | | | | | | | | | | | | | | | | | | | | | | | | | | | | | | |
| Cut-off (NSR USD/t) | Tonnes (Kt) | Average Grade | Contained Metal |
| Ag (g/t) | Au (g/t) | Cu (%) | Pb (%) | Zn (%) | AgEq (g/t) | AuEq (g/t) | Ag (koz) | Au (koz) | Cu (kt) | Pb (kt) | Zn (kt) | AgEq (koz) | AuEq (koz) |
| Pit-Constrained |
| Indicated | 60 | 6,639 | 115.5 | 2.2 | 0.1 | 0.96 | 2.21 | 390.8 | 4.2 | 24,653 | 463 | 6 | 64 | 147 | 83,423 | 896 |
| Inferred | 60 | 19,497 | 57.8 | 2 | 0.07 | 0.62 | 1.54 | 298.7 | 3.2 | 36,218 | 1,280 | 14 | 120 | 301 | 187,258 | 2,011 |
| Underground |
| Indicated | 110 | 1,943 | 143 | 1.1 | 0.06 | 1.19 | 2.11 | 319.6 | 3.4 | 8,931 | 69 | 1 | 23 | 41 | 19,963 | 214 |
| Inferred | 110 | 25,868 | 56 | 1.6 | 0.08 | 0.56 | 1.17 | 251.9 | 2.7 | 46,605 | 1,372 | 21 | 145 | 303 | 209,475 | 2,249 |
| Total |
| Indicated | 60/110 | 8,582 | 121.7 | 1.9 | 0.09 | 1.01 | 2.19 | 374.7 | 4 | 33,585 | 532 | 8 | 87 | 188 | 103,386 | 1,110 |
| Inferred | 60/110 | 45,365 | 56.8 | 1.8 | 0.08 | 0.58 | 1.33 | 272.0 | 2.9 | 82,823 | 2,653 | 35 | 265 | 604 | 396,733 | 4,260 |
In reporting the Mineral Resource Statements, SRK notes the following:
•The Mineral Resources have an effective date of 28 February 2026. Mr Guy Dishaw, P.Geo., is the Qualified Person (QP) responsible for the Mineral Resource Estimate in accordance with the Canadian Institute of Mining, Metallurgy and Petroleum (CIM) Definition Standards for Mineral Resources and Mineral Reserves (2014) and CIM Estimation of Mineral Resources and Mineral Reserves Best Practice Guidelines (2019). Mr Dishaw is a member of the Association of Professional Engineers and Geoscientists of Saskatchewan.
•The Mineral Resource Estimate was prepared by a team of consultants from SRK under the supervision of the QP.
•Mineral Resources are reported in situ and undiluted and are constrained within the Boumadine Mining Licence.
•Mineral Resources have been depleted to reflect SRK's current understanding of historical underground mining completed up to mine closure in 1992 as well as surficial artisanal workings.
•Commodity prices of US$2,800/oz Au, US$30/oz Ag, US$4.60/lb Cu, US$1.00/lb Pb and US$1.20/lb Zn were used to establish reasonable prospects for eventual economic extraction.
•The NSR was calculated as: NSR (US$/t) = (Pb (%) × 12.87) + (Zn (%) × 14.12) + (Au (g/t) × 70.27) + (Ag (g/t) × 0.75) + (Cu (%) × 66.95) − 6.75.
•Silver equivalent (AgEq) and gold equivalent (AuEq) grades are based solely on metal prices and metallurgical recoveries and do not incorporate the full range of factors included in the NSR calculation, including treatment charges, payabilities, penalties, royalties and other smelter charges. Consequently, equivalent grades were not used for optimization or application of reporting cut-offs and are provided for reference only.
AYA GOLD & SILVER INC., BOUMADINE POLYMETALLIC PROJECT 196
•AgEq = Ag (g/t) + (Au (g/t) × Au price/gram × Au recovery) / (Ag price/gram × Ag recovery) + Zn (%) × Zn price/lb × Zn recovery / (Ag price/gram × Ag recovery) × 685.7147973 + Pb (%) × Pb price/lb × Pb recovery / (Ag price/gram × Ag recovery) × 685.7147973 + Cu (%) × Cu price/lb × Cu recovery / (Ag price/gram × Ag recovery) × 685.7147973.
•AuEq = Au (g/t) + (Ag (g/t) × Ag price/gram × Ag recovery) / (Au price/gram × Au recovery) + Zn (%) × Zn price/lb × Zn recovery / (Au price/gram × Au recovery) × 685.7147973 + Pb (%) × Pb price/lb × Pb recovery / (Au price/gram × Au recovery) × 685.7147973 + Cu (%) × Cu price/lb × Cu recovery / (Au price/gram × Au recovery) × 685.7147973.
•Open-pit Mineral Resources are reported within an optimized pit shell using an NSR cut-off value of US$60/t. The optimization and reporting assumptions include mineralised material mining costs of US$2.0/t, waste mining costs of US$1.5/t. Drilling and blasting costs (grade control) US$1.1/t, US$2.0/t surface haulage and rehandling costs, processing and shipping costs of US$49/t, G&A costs of US$6/t and an overall pit slope angle of 47°.
•Underground Mineral Resources are reported using a rounded NSR cut-off value of US$110/t, based on total underground mining costs of US$55.6/t, processing and shipping costs of US$48.9/t and G&A costs of US$6.7/t. The underground Mineral Resources demonstrate sufficient continuity suitable for long-hole underground mining methods. Reporting shapes apply a minimum true mining width of 1.5 m, with isolated or discontinuous volumes considered unlikely to support potential underground extraction excluded from the reported Mineral Resource.
•Mineral Resources are not Mineral Reserves and do not have demonstrated economic viability.
•The QP is unaware of any known environmental, permitting, legal, title, taxation, socio-economic, marketing, political or other relevant factors that could materially affect the Mineral Resource Estimate.
•Tonnages are reported in metric units and grades are reported in grams per tonne (g/t) for Au and Ag and percent (%) for Cu, Pb and Zn. Tonnages, grades and contained metal quantities have been rounded appropriately. Rounding may result in apparent differences between totals and the sums of individual values; such differences are not considered material.
AYA GOLD & SILVER INC., BOUMADINE POLYMETALLIC PROJECT 197
14.17Sensitivity Analysis
The Mineral Resources of the Boumadine Project are sensitive to the selection of the reporting cut-off value. To illustrate this sensitivity, Figure 14‑39 to Figure 14‑40 present grade-tonnage curves for the combined Indicated and Inferred Mineral Resources for the open pit and underground mining scenarios. The reader is cautioned that the figures presented in these charts do not constitute a MRS and are provided solely to demonstrate the sensitivity of the block model estimates to the selection of the NSR cut-off value. Furthermore, the underground grade-tonnage curve includes all material reported beneath the optimized open pit shell and does not take into account mineable shapes or minimum mining thickness.
Figure 14‑39 Boumadine Grade Tonnage Curves for Open Pit Indicated and Inferred Material
Figure 13‑40 Boumadine Grade Tonnage Curves for Underground Indicated and Inferred Material
AYA GOLD & SILVER INC., BOUMADINE POLYMETALLIC PROJECT 198
14.18Aya Peer Review
Throughout the project, Aya undertook a peer review of SRK's 2026 MRE at the key stages (upon completion of the wireframing, grade and density estimation as well as SRK’s approach to depletion). All key decisions were discussed during the weekly project calls including SRK’s classification and Mineral Resource reporting approach. Where appropriate, SRK incorporated Aya's feedback, with adjustments being made based on their Project knowledge and constructive feedback.
14.19Comparison to Previous Estimates
As stated in Section 6.8, four previous MRE’s have been completed for the Boumadine Project, with the most recent reported by Aya in March 2025 (2025 MRE), which was in accordance with NI 43-101 (Table 6‑4).
The methodologies used to define the 2026 MRE differ from those used for the 2025 MRE. The principal differences include:
•Additional data and geological modelling: SRK remodelled the Boumadine deposit using all available drilling data (historical BRPM and 2017 Maya drilling was excluded). The 2026 geological interpretation considered an additional 453 drillholes compared to the 2025 MRE, associated with Mineral Resource definition and extensions to the known mineralization. The significant increase in available drilling data is considered to be one of the principal reasons for the differences between the two estimates. The additional drilling comprised both infill and exploration drilling, resulting in upgrades to portions of the previously classified Mineral Resource (to inferred and or indicated) and extensions to the known mineralization. Both the Aya 2025 and SRK 2026 mineralization wireframes were modelled using the Leapfrog vein modelling tool, and both estimates excluded the same drillholes from the geological modelling and grade estimate. The 2026 interpretation is built upon the previous geological models and incorporated the additional drilling, previous wireframe interpretations, depletion shapes and underground geological mapping. SRK adopted a more conservative approach to the geological modelling of individual domains, locally excluding wider intervals of waste and/or low-grade material that had been included within the 2025 wireframes. In some cases, individual domains interpreted in the 2025 MRE were subdivided by SRK into multiple domains based on the updated geological, structural interpretation and their respective orientations. Both the 2025 and 2026 wireframes considered the structural interpretations developed by Gaboury, satellite imagery and structural measurements obtained from oriented drill core. As part of the 2026 study, SRK modelled 158 mineralized domains across the Project, comprising 57 domains in the southern area, 58 in the central area and 43 in the northern area. In comparison, the 2025 MRE comprised 45 modelled domains in total, including 13 in the southern area, 13 in the central area and 19 in the northern area. Some of the additional domains modelled by SRK reflect new geological information provided by the additional infill and exploration drilling that was either unavailable or poorly supported at the time of the 2025 MRE.
•Grade estimation: The 2026 grade estimation methodology differs from that used for the 2025 MRE, principally through the use of a 2D metal accumulation approach rather than 3D grade estimation adopted by Aya in 2025. SRK estimated metal accumulation (grade × true thickness) using ordinary kriging (OK) and octant-based sample selection for Ag, Au, Cu, Pb and Zn. In comparison, the 2025 MRE estimated grades directly from 1 m composites using inverse distance weighting and did not use ordinary kriging or octant-based sample selection.
•Treatment of high-grade outliers: Both the SRK 2026 and Aya 2025 estimation approaches applied high-grade caps to limit the influence of anomalously high-grade samples, albeit using different thresholds and methodologies. For the 2026 MRE, SRK initially applied capping to the raw assay grades prior to calculating metal accumulation. Capping thresholds were assessed using histograms and log-probability
AYA GOLD & SILVER INC., BOUMADINE POLYMETALLIC PROJECT 199
plots for three mineralization categories: high-pyrite (≥25% Fe), low-pyrite (<25% Fe), and polymetallic veins (relatively low Fe but elevated Ag, Zn and Pb). SRK subsequently applied additional capping to metal accumulation values within selected domains where further control of high-grade samples was considered necessary following visual and statistical validation of the model. In comparison, the 2025 MRE applied capping to the 1 m composites, with thresholds selected by Aya using histograms and log-probability plots for specific domains (if warranted).
•Density estimation: The density estimation methodology was revised for the 2026 MRE. SRK estimated density using IDW² from a single composite (across strike intersection). The estimation dataset comprised measured dry in situ density values supplemented, where required, by proxy density values derived from a regression relationship between measured dry in situ density and calculated total sulphide content. In comparison, the 2025 MRE applied fixed density values based on the average measured densities of the modelled mineralized wireframes.
•Depletion: The 2026 MRE was depleted for historical underground mining and surface artisanal workings, whereas the 2025 MRE was not depleted. As discussed above in Section 14.13, where mining is known to have occurred but an offset exists between the modelled mineralization and the available underground as-built wireframes, SRK created additional depletion shapes to account for the interpreted mined material. SRK also depleted surface artisanal workings identified during the QP site visit and from satellite imagery. These depletion shapes were used to ensure that known or interpreted historically mined material was excluded from the 2026 MRE to the best knowledge of the QP.
•Adjustments to the technical and economic parameters used for Mineral Resource reporting: The assumptions and calculations used to derive the 2026 open pit and underground NSR cut-off values were reviewed by SRK as part of the current study. In several cases, Aya made amendments following SRK's review. These included, but were not limited to, the use of concentrate recoveries and grades as inputs to the NSR calculation, revision of the Pb treatment charge to remove previous double counting, and adjustments to concentrate mass pull and associated shipment costs. The 2026 NSR calculation also incorporates updated metal price assumptions. In addition, the processing cost assumptions used to support both open pit and underground Mineral Resource reporting differed from those applied in 2025. The 2026 open pit optimization also incorporated revised mineralized material and waste mining costs and a slightly different overall pit slope assumption. Collectively, these changes resulted in differences in the technical and economic parameters used to demonstrate reasonable prospects for eventual economic extraction and to report the 2026 MRE.
•Mineral Resource reporting: For the 2025 MRE, open pit Mineral Resources were reported within an optimized pit shell above an NSR cut-off value of USD 95/t, while underground Mineral Resources were reported beneath the pit shell above an NSR cut-off value of USD 125/t. Aya did not undertake a stope optimization exercise or exclude volumes that did not form potentially mineable underground shapes or consider any minimum minable thicknesses in reporting the 2025 underground Mineral Resources. The 2025 reporting parameters were derived from the pit optimization and NSR calculations completed at the time. For the 2026 MRE, SRK reported open pit Mineral Resources within an optimized pit shell using an NSR cut-off value of USD 60/t, while underground Mineral Resources were assessed using an NSR cut-off value of USD 110/t. For underground reporting, SRK generated grade shells in Leapfrog, based on block centroid values, to define realistic potential underground mining targets. These grade shells were used to identify areas where the mineralized thickness exceeded 1.5 m, representing the assumed minimum mining thickness. For mineralized zones less than 1.5 m thick where elevated grades were present, an NSR × thickness criterion was applied. SRK subsequently removed small and isolated volumes considered unlikely to be mined using the proposed underground mining methods. This approach provides a more explicit assessment of the potentially mineable geometry of the underground Mineral Resources than that applied in the 2025 MRE.
AYA GOLD & SILVER INC., BOUMADINE POLYMETALLIC PROJECT 200
Overall, the 2026 Mineral Resource Statement (Table 14‑15) reports higher tonnages than the 2025 MRE. Indicated Mineral Resources increased by approximately 66%, from 5,169 kt to 8,582 kt, while Inferred Mineral Resources increased by approximately 55%, from 29,196 kt to 45,365 kt. The average Ag grade of the Indicated Mineral Resources increased by approximately 34%, from 90.8 g/t to 121.7 g/t, while the Inferred Ag grade decreased by approximately 31%, from 81.8 g/t to 56.8 g/t. Average Au grades decreased by approximately 31% for Indicated Mineral Resources (2.8 g/t to 1.9 g/t) and by approximately 31% for Inferred Mineral Resources (2.6 g/t to 1.8 g/t). Average Zn grades decreased by approximately 22% for Indicated Mineral Resources (2.8% to 2.19%) and by approximately 37% for Inferred Mineral Resources (2.11% to 1.33%). The average Cu grade decreased by approximately 26% for Indicated Mineral Resources (0.12% to 0.09%), while the Inferred grade remained unchanged. The average Pb grade increased by approximately 19% for Indicated Mineral Resources (0.85% to 1.01%) but decreased by approximately 29% for Inferred Mineral Resources (0.82% to 0.58%).
Given the differences in the quantity of available drilling data (an additional 453 drillholes), geological interpretation, estimation methodology, density estimation, depletion, the approach used to demonstrate reasonable prospects for eventual economic extraction, and the technical and economic input parameters, SRK considers that the changes between the 2025 and 2026 Mineral Resource estimates cannot be attributed to any single factor, but a combination of the above.
AYA GOLD & SILVER INC., BOUMADINE POLYMETALLIC PROJECT 201
15.0MINERAL RESERVE ESTIMATES
This section is not applicable to this Report.
AYA GOLD & SILVER INC., BOUMADINE POLYMETALLIC PROJECT 202
16.0MINING METHODS
16.1General Description of the Mining Project
The Boumadine deposit is a large polymetallic mineralized system containing Au, Ag, Zn, and Pb, extending over 5 km, with historic mining infrastructure in the central and southern zones. Mineralization at Boumadine begins at the surface in some occurrences and generally takes the form of vertical or subvertical structures. A combined open-pit (“OP”) and underground (“UG”) mining operations are planned for Boumadine mineralized zones.
The mine plan presented in this section is based on the Mineral Resource estimate described in Section 14 and includes Inferred Mineral Resources. Inferred Mineral Resources are considered too speculative geologically to have the economic considerations applied to them that would enable them to be categorised as Mineral Reserves. There is no certainty that the results of this Preliminary Economic Assessment will be realised. No Mineral Reserves have been estimated for the Project.
16.2Geotechnical
16.2.1Open Pit
16.2.1.1Open Pit Slope Design
Geotechnical evaluations of the Boumadine pits have been completed by empirical evaluation to produce slope design constraints domained by slope dip direction (see RockEng report #24017-102 for complete documentation of geotechnical site characterization and analyses). The pit slope design guidance may be applied to varying pit shell geometries with reliance on slope orientation (rather than geographical location).
Overall slope angle (OSA) constraints are summarized in Table 16-1. It is noted that these are maximum allowable OSA values; slopes may be limited to a flatter angle once benches, ramps, slope breaks etc. are accounted for in geometry.
Table 16-1 Summary of OSA recommendations.
| | | | | | | | | | | |
| Slope Dip Direction | Overall Slope Angle (OSA) |
| Slope Height up to 380m | Slope Height up to 220m | Slope Height up to 100m |
| 5 | 48 | 52 | 60 |
| 65 | 38 | 42 | 48 |
| 125 | 48 | 52 | 60 |
| 185 | 48 | 52 | 60 |
| 245 | 48 | 52 | 60 |
| 305 | 48 | 52 | 59 |
Further to the OSA summarized above, pit slope designs are constrained by the following:
Adverse jointing is expected at Boumadine in east-northeast dipping slopes due to the presence of a prominent ENE dipping joint set. Here, the inter ramp slope angle (IRA) should not exceed the dip of the adverse joint (48˚).
Minimum catch bench width are defined as follows (Ryan & Pryor, 2000 in Read & Stacey, 2009):
AYA GOLD & SILVER INC., BOUMADINE POLYMETALLIC PROJECT 203
Catch Bench Width (m) = 0.2 * Bench Height + 4.5m
•Where overburden is present, it will be stripped and laid back at a 2H:1V slope. A bench between the toe of the overburden and the crest of rock should be left around the pit perimeter to prevent overburden from running into the pit (bench width should be equal to overburden depth).
•The first 2 benches will be single bench height to account for the likely occurrence of poorer ground conditions near surface (weathering horizon).
•Below the initial two benches in rock, 20 m high double benches are geotechnically feasible.
•Geotechnical slope breaks will be established every 100 vertical metres; preliminary design will consider geotechnical slope breaks to be not less than double the width of a typical catch bench.
16.2.2Underground
Geotechnical evaluations of the Boumadine underground mine have been completed by empirical evaluations (see RockEng report #24017-102 for complete documentation of geotechnical site characterization and analyses).
16.2.2.1Mining Method Selection
Longhole open stoping is a geotechnically sound mining method for the Boumadine underground. Based on deposit body geometry, longitudinal open stoping and/or Avoca style stoping is deemed amenable from a geotechnical perspective. Longitudinal stoping provides operational flexibility to adjust stope panel lengths, thus there is an opportunity for optimizing design for local variances (good or bad) in ground conditions. This is particularly important where the deposit body is narrow as production performance in narrow zones is likely to be more sensitive to HW and FW dilution.
At relatively shallow depths, low stress conditions allow for operational flexibility with mine sequencing. At this phase of study, one key aspect of sequencing that has been identified pertains to inter-lens pillar stability and adjacent stope performance. The lead/lag between adjacent lenses is minimized as an opportunity to mitigate loss of confinement.
16.2.2.2Open Stope Design and Overbreak Potential
Stope stability has been evaluated by empirical methods considering vertical stope sidewalls, HW and FW faces dipping ENE at ~85° (based on modelled stope geometries), and horizontal stope backs. It is assumed that both sulphides and Tuff may be exposed in stope faces. The recommended hydraulic radii limitations are provided in Table 2. It has been concluded that 20 m level spacing (25 m stope height), with 20 m strike lengths are well suited for Boumadine underground. Larger stopes may be achieved if cable bolting is implemented. At these dimensions, with typical HW to FW spans, stope backs and endwalls are expected to perform well, with stope back cable bolting required rarely (where HR exceeds 4.2). The predicted overbreak (for 20 m strike x 20 m level spacing) is roughly 0.5 m for stope HWs and blast damage only for stope FWs.
Table 16-2 Recommended stope sizing constraints by stope face and rock type.
| | | | | | | | |
| Stope Face | Unsupported HR | Supported HR |
| HW/FW | 5.6 | 7.5 |
| Back | 4.2 | 6.2 |
| Endwalls | 7.5 | - |
AYA GOLD & SILVER INC., BOUMADINE POLYMETALLIC PROJECT 204
16.2.2.3Potential Overbreak
HW and FW overbreak is an important metric for dilution planning. An estimate of stope HW and FW overbreak has been assessed using the empirical method by Clark (1998). For hydraulic radii of 5.6 (20 m strike length, with 20 m level spacing) the predicted overbreak is roughly 0.5 m for stope HWs and blast damage only for stope FWs.
16.2.2.4Pillar Stability
Inter-lens Stope Pillars
Inter-lens pillars exist between stacked (HW to FW) mineralized zones. The Boumadine underground mine plans intend to utilize cemented rock fill, and so the largest mining risk associated with inter-lens stope pillar stability is dilution and oversize entering open stopes (as opposed to global mine stability). The following pillar dimensioning constraints have been established by empirical methods.
•At W:H = 0.3 (6 m for a 20 m stope strike length), total pillar loss predicted for HW to FW sequencing is 2.3 m, and for FW to HW sequencing is 2.2 m.
•At W:H = 0.4 (8 m pillar for a 20 m stope strike length), total pillar loss for HW to FW sequencing is 1.8 m, and for FW to HW sequencing is 1.5 m.
•At W:H = 0.5 (10 m pillar for a 20 m stope strike length), total pillar loss for HW to FW sequencing is 1.1 m, and for FW to HW sequencing is 1.0 m.
Table 16-3 Pillar Dilution Based by Mining Sequence.
| | | | | | | | | | | | | | |
Pillar Dimensions | 0.5W:H | 0.4W:H | 0.3W:H |
| HW to FW advance | ELOS 1st Stope (m) | 0.3 | 0.3 | 0.3 |
ELOS 2nd Stope (m) | 0.8 | 1.5 | ˃ 2. |
Total Pillar Dilution (m) | 1.1 | 1.8 | ˃2.3 |
| FW to HW advance | ELOS 1st Stope (m) | 0.7 | 0.7 | 0.7 |
ELOS 2nd Stope (m) | 0.3 | 0.8 | 1.5 |
Total Pillar Dilution (m) | 1.0 | 1.5 | 2.2 |
Source: RockEng
Rib & Sill Pillars
Rib pillar dimensioning will rely on a 1:0.7 width (rib pillar horizontal thickness) to height (HW to FW span) aspect ratio with a minimum dimension of 3 m. Permanent sill pillar dimensioning relies on a 1:1 width (vertical dimension) to height (HW to FW span) aspect ratio with a minimum dimension of 5 m.
Crown Pillar
Based on empirical crown pillar evaluations, a 20 m pillar (in rock, ignoring overburden thickness) is deemed appropriate for stable crown pillar conditions during active mining operations. This dimension relies on the assumption that backfill will be utilized to manage long term stability for mine closure. Further, it is not unreasonable to expect that, with appropriate engineering and planning, full crown pillar recovery may be achieved (assuming surface disturbance is permitted, and environmental risks are tolerably low).
16.2.2.5Infrastructure Siting
Given the relatively shallow mining depth, the geotechnical risks associated with stress induced damage to permanent infrastructure are considered low; thus, allowing for reasonable design flexibility, general guidance
AYA GOLD & SILVER INC., BOUMADINE POLYMETALLIC PROJECT 205
is as follows: cross-cut lengths ensure that haulage drive stand-offs are at least 15 m from the deposit body contact; either HW or FW infrastructure placement is acceptable given the near-vertical nature of the deposit; lateral development lay-outs will ensure that wide spans and intersections are not stacked level-to-level.
16.2.2.6Ground Support
Standard lateral development (4 to 6 m spans) will be supported by 2.4 m rebar at a 1.25 x 1.25 m square pattern applied to the back and walls, with welded wire mesh in the back and shoulders. Cable bolts will be utilized in intersections and wide spans wit bolt lengths equal to ½ the span, at a 2 m square pattern. It is assumed that 2% of development will require shotcrete.
16.3Hydrogeology
No site-specific hydrogeological investigation has been completed to date. For the purposes of this PEA, groundwater inflows have not been estimated: the mine dewatering system described in Section 16.6 has been sized on a level-by-level basis from typical operating practice. CCE Mining recommends that a hydrogeological programme comprising packer testing, pumping tests and the installation of monitoring wells be completed, and that a numerical groundwater model be developed, to support the next stage of study.
16.4Boumadine Mining Method
16.4.1Mining Method Selection
This section details the assumptions and procedures used to develop a mining plan for the project. The Boumadine deposit extends from the surface to depths well beyond those that can be mined using an open-pit (OP) method alone. It was decided from the outset that the mining method would be a combination of open-pit (OP) and underground (UG) mining. Initially, open-pit design shells were created using Whittle software, and underground stope designs were created using Deswik Stope Optimizer (DSO). This initial design allowed for a preliminary assessment of the interaction between open-pit and underground mining, and for the development of an open-pit mining plan that would recover as much high-grade mineralized material as possible at a reasonable cost before the underground method became more profitable.
Historical exploration activities, including underground development work, were conducted at the deposit in the 1980s and 1990s; therefore, it will be necessary in the future to locate and map these tunnels so that they can be considered in the detailed design and planning of the mine.
16.4.2NSR Cut-offs determination
To assess the Boumadine project, Aya used a Net Smelter Return (NSR) cut-off to assess the economic viability of mining one metric ton of diluted mineralized material. Viability is determined by comparing the material’s NSR value to the applicable NSR cut-off values. An NSR threshold represents the on-site cost associated with extracting and processing one metric ton of mineralized material, including general and administrative (G&A) expenses.
The NSR cut-offs incorporate mining, processing, and G&A costs based on a preliminary cost model, which has since been adjusted by the operating cost estimates developed in Section 21.
Table 16-4 presents the calculations used to determine the NSR Cut-off thresholds applied in this preliminary economic assessment (PEA) study for open-pit mining, underground mining, and underground development.
AYA GOLD & SILVER INC., BOUMADINE POLYMETALLIC PROJECT 206
Table 16‑3 NSR Cut-off Calculations General Assumptions
| | | | | | | | | | | |
| Area | Unit | Value | Source |
| Metal Price |
| Lead (Pb) | US$/lb | 1 | Aya |
| Copper (Cu) | US$/lb | 4 | Aya |
| Zinc (Zn) | US$/lb | 1.2 | Aya |
| Gold (Au) | US$/oz | $ | 2,800.00 | Aya |
| Silver (Ag) | US$/oz | 30 | Aya |
| Financial Assumptions |
| Royalties | % | 3 | |
| Open-pit Mining |
| Mining | USD/t | $4.60 | Aya |
| Processing Cost | USD/t | $50.35 | Aya |
| G&A | USD/t | $6.30 | Aya |
| Total (OP NSR Cutoff) | USD/t | $61.25 | |
| Waste Mining | USD/t | $2.00 | Aya |
| Underground Mining |
| Mining | USD/t | $68.13 | Aya |
| Processing Cost | USD/t | $50.35 | Aya |
| G&A | USD/t | $6.30 | Aya |
| Total | USD/t | $124.78 | |
| Underground Development |
| Mining | USD/t | $20.63 | Aya |
| Processing Cost | USD/t | $50.35 | Aya |
| G&A | USD/t | - | |
| Total | USD/t | $70.98 | |
NB - assumes development is required by block - decision to sent to mill vs waste |
16.5Open Pit Mining
16.5.1Whittle Open Pit optimization
GEOVIA Whittle (2026) software was used to carry out the pit optimization process for the Boumadine pit. Using the Lerchs-Grossmann (LG) algorithm integrated into Whittle, nested shells were generated, and the optimal pit shell was selected for each area of the deposit. These pit shells were then used for mine design and, ultimately, for the scheduling process.
Estimated costs and cut-off grades were provided by AYA and verified by the QP. These costs were compared to benchmark costs from similar projects before being incorporated into Whittle.
Table 16-5 presents the economic and mining data used for Whittle pit optimization. Revenue for each block was provided by the calculated NSR value.
Table 16‑4 Whittle Parameters
| | | | | | | | |
Parameters | Unit | Value |
General Assumption |
| Processing Plant Throughput | tonne/day | 8 000 |
| Processing Plant Throughput | tonne/year | 2 880 000 |
AYA GOLD & SILVER INC., BOUMADINE POLYMETALLIC PROJECT 207
| | | | | | | | |
| Working Day | day/year | 360 |
| Mining Recovery | % | 100% |
| Mining Dilution | % | 0% |
Mining Costs |
| Whittle Mining Reference Costs | US$/t | 2.00 |
Processing Costs |
| Crushing/Grinding/Flotation | US$/t of feed | 20.00 |
| Concentrates shipping | US$/t of feed | 30.00 |
| Industrial Water/TSF | US$/t of feed | 0.35 |
| Additional Mineralized Mining Costs | US$/t | 2.60 |
| G & A | US$/t | 6.30 |
| Whittle processing Costs | US$/t | 59.25 |
16.5.2Whittle Pit Shell Generation
Pit Shell Generation was first performed on the overall deposit to determine the possible pits to be evaluated. This exercise resulted in the identification of 4 distinct areas with potential pits: 2 in the south (one of which was not economical using open-pit mining method), one in the center, and one in the north. The initial block model was then modified to create four separate block models, each constrained to the boundaries of the largest pits generated during the calculation. Each pit was then optimized individually, allowing for a more precise analysis tailored to the geological and economic characteristics of each area.
The following paragraphs will describe the methodology and optimization parameters used for the central pit. A similar method and parameters were used for the other pits.
The first step was to re-block the 5m x 5m x 5m block models to 15m x 15m x 10 m (X, Y, Z). Figure 16-1 shows the Whittle block size adjustment.
Figure 16-1 Whittle Re-Blocked Model Parameters
Next, the overall slope angles were determined in accordance with geotechnical recommendations, with variations based on the depth of the pits. Figure 16-2 presents the parameters used in Whittle in the first iteration using conservative OSA numbers. After the first iteration, pit depth was determined and OSA was adjusted to the most aggressive recommendation allowed, then Whittle was re-run.
AYA GOLD & SILVER INC., BOUMADINE POLYMETALLIC PROJECT 208
Figure 16-2 Whittle Initial Slope Set Settings
For each pit, optimized pit shells were generated using revenue factors (RF) ranging from 0.25 to 1.1 with an increment of 0.05. Based on these results, pit by pit discounted cashflow graphs were developed, incorporating a 5% discount rate and a 3% royalty, which allowed the development of potential cash flows for each pit shell iteration.
Once the pits had been generated, and after simulating several planning scenarios for each of them, the extraction rate that would allow for optimal operation of most of the pits was evaluated.
The maximum mining rate, including mineralized material and waste rock, was set at 167,000 tonnes per day (t/d), or 60 Mt per year, to allow for maximal theoretical production rate per pit. However, that mining rate was never reached as the 8000 t/d processing plant throughput was the bottleneck in all scenarios.
16.5.2.1Whittle North Pit Final Shell
The Whittle pit optimization of the northern pit shows a significant increase in waste mined (26.7 Mt) between Pits 14 and 15 relative to the additional mineralized material accessed (0.88 Mt). The graph Figure 16-3 shows a turning point at Pit 14.
Operating cash flow for pit 14 is $141.6M with a RF of 0.9. The pit’s life is approximately one year at full production. There are no opportunities for a pushback. The average stripping ratio for the selected pit shell is 15:1.
AYA GOLD & SILVER INC., BOUMADINE POLYMETALLIC PROJECT 209
Figure 16-3 North Pit Whittle Shells Iteration
Figure 16-4 North Pit Whittle Shell 14
16.5.2.2Whittle Central Pit Final Shell
The Central Pit, Figure 16-5 shows that pit 15 and pit 16 are the turning point for best case and worst-case scenarios. Provided an optimal pushback sequence, Pit 16 would bring in more revenue, and hence was selected
Operating cash flow for pit 16 is $1.7B with a RF of 1.0. The pit’s mine life is approximately 7 years at full production, with a stripping ratio of 24:1.
AYA GOLD & SILVER INC., BOUMADINE POLYMETALLIC PROJECT 210
Figure 16-5 Central Pit Whittle Shells Iteration
Figure 16-6 Central Pit Whittle Shell 16
16.5.2.3Whittle South Pit Final Shell
Figure 16-7 illustrates the Whittle iterations for the Southern Pit. The graph shows that beyond pit shell 11 the incremental gain in operating cashflow is marginal. The revenue difference between pit 11 and pit 16 is only $6M, for an added 22Mt of waste.
Operating cash flow for pit 11 is $424M with a RF of 0.75. The pit’s mine life is approximately 1.7 years at full production. The stripping ratio will be 30:1.
AYA GOLD & SILVER INC., BOUMADINE POLYMETALLIC PROJECT 211
Figure 16-7 South Pit Whittle Shells Iteration
Figure 16-8 South Pit Whittle Shell 11
16.5.3Open Pit Mine Design Parameters
Pit designs were developed for the three deposit areas and are based on the optimized shells and the geotechnical design parameters presented in Table 16-6.
AYA GOLD & SILVER INC., BOUMADINE POLYMETALLIC PROJECT 212
Table 16-6 Open Pit Design Parameters
| | | | | |
Parameter | Value |
| Layback in overburden | 2H:1V |
| Bench height in overburden | 10 m |
| Bench width between the overburden and rock | Equal to overburden width |
| Bench in rock | Double 10 m (20 m) |
| Face angle | 70° – 80° |
| Minimum catchment width | 0.2 x Bench height + 4.5m |
| Inter-ramp slope angle | < 48° for east dipping slopes |
| Slope break | Every 100 m |
| Slope break catchment width | Double width of a standard catchment |
| Pre-split blasting | None |
| Ramp gradient | 10% |
| Turning radius | 20 m |
| Ramp width double lane (90 t size trucks) | 20 m |
| Ramp width single lane | 12 m |
| Minimum operational bench width | 30 m |
The mine design process is iterative and aims to transform the optimal pit shells into an operational open pit project. Once completed, the total tonnage of the designed pit should not differ significantly from that of the optimized pit shells. The detailed pit designs were carried out using Deswik mining software. It includes haulage ramps providing access to all benches, except for the final benches which will be excavated via temporary ramps.
16.5.4Haul Road Design
The haulage ramps are sized to accommodate the largest haulage truck (xx t capacity) and are designed for two-way traffic, except for the final levels of each phase, which are designed for one-way traffic. For the two-way traffic, the design considers a buffer space equivalent to half the width of the largest truck width (CAT 785). Safety berms are designed at half the diameter of the haul truck tires. Figure 16-9 (a) and (b) show a schematic of the haul ways for double and single lane.
(a) (b)
Figure 16-9 Haul Road Schematic (a) and (b)
16.5.5Open Pit Design
Figure 16-10 represents the final mine designs in plan view for North, South and Central pits. The North pit is split into 3 sub-pits each mined in a single phase, the Center pit is mined in 4 phases, and the South pit is mined in two phases. A sample cross section of the Center pit’s phases is shown in Figure 16-11.
AYA GOLD & SILVER INC., BOUMADINE POLYMETALLIC PROJECT 213
Figure 16-10 Boumadine Pit Locations
AYA GOLD & SILVER INC., BOUMADINE POLYMETALLIC PROJECT 214
Figure 16-11 Boumadine Pit Center Phases – Longitudinal Section
16.5.6Open Pit equipment Selection
At this stage of the project, it is anticipated that the pits will be mined by contractors. For design purposes, it is assumed that a 200 tonnes CAT 6020 shovel will be paired with a 90 tonne CAT 777 Truck, or similar equipment, will be used. The final choice will depend on the contractor equipment selection to sustain the nominal mill capacity at 8,000 tonnes per day of mineralized material.
16.6Underground Mining
The currently identified underground portion of the Boumadine deposit extends to approximately 640 m below the surface and extends for approximately 5.6 km along strike. It is divided into three main zones: North, Central, and South. The dip of the mineralized zone is relatively steep, ranging from approximately 70° to approximately 80°, and its average width is between approximately 1 and 4 m. The highest-grade mineralized zones are concentrated in the Southern and Central zones, beneath the pits, as shown in Figure 16-12.
Figure 16‑12 Boumadine Underground Mine Design – Longitudinal View
16.6.1Underground Mining Method Description
Given the geometry of the deposit (dip and width) and its geotechnical parameters (rock mass characterization), the long-hole stoping method was deemed appropriate. Because of its productivity and flexibility, the modified Avoca method was selected for this PEA.
This method divides the deposit into sublevels, and the mineralized material between them is mined as stopes. The mineralized material on each sublevel will be mined with longitudinal stopes extending along the strike of the deposit. Each series of longitudinal stopes requires a production drift on the upper sublevel for drilling, loading explosives, and backfilling, and a production drift on the lower sublevel for mucking blasted mineralized material. These production drifts will be driven from a central access drift connected to the ramp.
AYA GOLD & SILVER INC., BOUMADINE POLYMETALLIC PROJECT 215
Figure 16‑13 Modified Avoca Mining Method Illustration – Longitudinal Section
As shown in Figure 16-13, the longitudinal long-hole stopes will be mined in a retreating fashion towards the access drift. Within each mining panel a bottom-up stoping sequence will be used, with mining commencing on the lowest level of the panel and progressing upward, offset horizontally by three stopes. To initiate each level, a slot raise is drilled and blasted to form a void; subsequence blast hole rings are fired until planned length is achieved based on the rock mass condition of the footwall (FW) and hanging wall (HW). If the ground is competent, stope will be filled entirely of rockfill, the subsequent stope drilled and loaded, and a portion of the rockfill extracted to create a void for blasting. When there is excessive dilution in a panel, the stope will be filled with approximately 50% rockfill (RF) and 50% cemented rockfill (CRF) to offer more support.
The mining cycle of drilling, blasting, mucking and backfilling repeats until the entire level is mined out. The last level will be mined by drilling the blastholes upwards, removing the mineralized material beneath the sill that would have been backfilled with 100% cemented rock fill (CRF). Figure 16-14 illustrates the stope cycle for the proposed mining method.

Figure 16‑14 Modified Avoca Mining Method – Stope Cycle
AYA GOLD & SILVER INC., BOUMADINE POLYMETALLIC PROJECT 216
This type of mining method requires a regular shape of stopes and mineralized material boundaries. When using mechanical equipment, the drifts need to be large enough to accommodate the required equipment; which can result in dilution where the vein is narrow.
Until further geotechnical recommendations are provided, it is assumed that the ground is overall competent.
16.6.2Underground Stope Design
Stope dimensions were defined based on the recommendations of the geomechanics’ report from RockEng. Each stope was designed to be 20 m high and 20 m long.
Stopes shapes were generated using Deswik Stope Optimizer (DSO) software, taking into account the geometry of the deposit as well as geotechnical and economic criteria.
Several DSO scenarios were evaluated to determine the optimal results in terms of tonnage and grade.
The shapes generated by DSO are visually verified and sequenced to align with the mining method (long-hole longitudinal retreat), then integrated into Deswik Scheduler to establish the production profile and mine life. Table 16-7 summarizes the stope design parameters.
Table 16-7 Stope Design Parameters
| | | | | |
UG Stope Design parameters |
Parameter | Value |
Stope parameters | |
| Mining Method | Modified Avoca |
| UG NSR COG | 124.78 US$/t |
| Minimum Width | 2 m |
| Maximum Width | 20 m |
| Stope Height (Floor to Floor) | 20 m |
| Stope Length | 20 m |
| Pillar between veins | 8 m |
| Minimum dip angle | 54 deg |
| Mining Dilution ELOS HW | 0.5 m |
| Mining Dilution ELOS FW | 0.0 m |
| Mining recovery | 95% |
| Backfill Dilution | 5% |
More than 3500 stopes generated were kept in the current mine design. Table 16-8 provides a summary of the shape properties for the different zones.
Table 16-8 Deswik Stope Optimizer (DSO) Output by Zones D
| | | | | | | | | | | | | | | | | | | | | | | |
| DSO Generated - Kept | DSO Shape Width (m) | DSO Shape Dip (deg) |
Unit | Min | Max | Average | Min | Max | Average |
| Centre | 770 | 2.5 | 8.5 | 3.8 | 54 | 86 | 65 |
| North | 1235 | 2.5 | 11.1 | 3.6 | 54 | 87 | 77 |
| South | 1588 | 2.5 | 15.5 | 3.9 | 54 | 87 | 79 |
Prior to conducting a preliminary economic stope analysis additional stopes were generated between $110 and $124.78 (UG COG), allowing for the evaluation of marginally economic stopes. Isolated stopes and stopes within open pit designs were removed from the underground design. A preliminary economic analysis was then conducted on all the stopes by region, by level and case-by-case to determine if sufficient value is generated to cover the development and infrastructure costs. As a result of this analysis, a few unprofitable
AYA GOLD & SILVER INC., BOUMADINE POLYMETALLIC PROJECT 217
panels were removed from the production plan. Marginal stopes were then evaluated, after considering the sunk cost of development for stopes above COG, and those that passed the economic evaluation were kept. The mine design was then created for all the remaining stopes.
16.6.3Underground Mine Development Design Parameters
Lateral development will include the main access ramps (declines), level access drifts, the production drifts, and all the necessary excavations for infrastructures.
Vertical development will consist of ventilation raises, which are planned to be excavated using either raise boring, or conventional drill and blast raise (drop raise).
All lateral and vertical development activities are to be performed by a contractor, with the exception of sills, which will be developed using the owner’s teams. Aya provided the unit rates for these activities, based on quotes received from selected contractors, and their experience at their Zgounder mine.
Decline, with a maximum gradient of -15%, will provide access to the mining levels for all zones. The mining area will be accessed by driving level access and sill drifts above and below the stoping area.
For the purposes of this PEA, preliminary ground support design was developed based on the recommendations of the geotechnical report. Standard support in the mining drifts consists of coated Swellex bolts installed in a 1.25 m x 1.25 m square pattern, with mesh applied to the back and walls down to half the height of the drift.
At intersections and in areas with wide spans, additional support will be provided with cable bolts. The recommended length of cables bolts will be half the span on a pattern of 2.0 m × 2.0 m.
The dimensions of the development headings are shown in Table 16-9.
Table 16-9 Development Headings Profiles
| | | | | | | | | | | | | | |
| Tunnel Profile (without overbreak) |
Width (m) | Height (m) | Length (m) | Max grade (%) |
Lateral Development | | | | |
| Spiral Ramp | 4.5 | 4 | Variable | ±15 |
| Level Access | 4.5 | 4 | Variable | ±3 |
| Ventilation Drift | 4.5 | 4 | Variable | ±3 |
| Connection Drift | 4.5 | 4 | Variable | ±15 |
| Sill Drift | 4 | 4 | Variable | +2 |
| Electrical Main Substation | 4.5 | 4 | 10 | +3 |
| Main Pumping Station | 4.5 | 4 | 20 | -17 |
| Remuck Bay | 4.5 | 4 | 15 | ±3 |
| Level Sump (Gravity Drain/Borehole) | 4.5 | 4 | 15 | -15 |
| Temporary Electrical Station | 4.5 | 4 | 10 | ±3 |
| Portable Refuge Bay | 4.5 | 4 | 7 | ±3 |
| Safety Bay | 1.5 | 2 | 1 | ±0 |
Vertical Development |
| Ventilation Raises | 3 and 4 m Diameter Raise Bore, 3x3 or 3.5x3.5 or 4x4m Drop Raises | NA |
Each level includes level access, dewatering sump, ventilation accesses, truck turnaround, remuck bays, and sill drive. Electrical stations will be strategically located so that they could provide power to multiple levels or sub-levels. Figure 16-15 presents a typical mining level.
AYA GOLD & SILVER INC., BOUMADINE POLYMETALLIC PROJECT 218
Figure 16‑15 Typical Level Layout
16.6.4Emergency Egress
Production activities will respect the current legislation by ensuring that at least two distinct egresses are always available. Thus, to start production as early as possible in some mining areas, some of the internal ventilation raises will need to be outfitted with manways. This will add flexibility to the production sequence while also multiplying egress routes for additional safety. The main access ramp and the main ventilation raise will be considered as the two emergency egress routes out of the mine.
In addition to the egress provisions described above, the following mine safety infrastructure is included in the design:
•Ventilation raises connecting the sublevels will be equipped with ladderways, providing an emergency escape alternative to the spiral ramp.
•Mine rescue equipment will be provided on site for use by the mine rescue team.
•A dedicated ambulance will be stationed at the mine site for emergency medical response.
•Portable refuge stations will be positioned throughout the mine, each designed and equipped to accommodate up to eight (8) people for 36 hours.
•A stench gas system will be installed to provide warning underground in an emergency.
AYA GOLD & SILVER INC., BOUMADINE POLYMETALLIC PROJECT 219
16.6.5Additional Infrastructures
Additional infrastructure includes emergency underground refuge stations, and internal ventilation raises. Each underground refuge station is designed and located to accommodate the necessary number of workers at any given time. The refuge stations are located no further than a 1,000 m from any location. Powder & cap magazines are not included in the design, but they are considered in the equivalent-metre contingency, and their costs are included in the cash flow model.
16.6.6Dewatering
Mine dewatering system at Boumadine is planned with typical pumping station and submersible pumps located on each level. Dirty water from each level will be gravity-drained to a main sump located at different elevation in each zone. The solids will be decanted and the water pumped to the surface for final effluent treatment or recycled underground for mining operations.
As required, additional small sumps are added, collecting water through ditches by gravity at each low point. The liquid level inside the pumping station sump is monitored and controlled with level transmitters, indicators and controllers, so the submersible pumps can start and stop accordingly. Figure 16-16 illustrates a schematic of the underground mine dewatering for the Center zone. In the Northern and Southern zones, the dewatering process is essentially the same as the central zone. Table 16-10 shows the number of pumping stations for each zone.
Figure 16‑16 Dewatering Network Schematic Central Zone
Table 16‑10 Mine Dewatering
| | | | | |
UG Mine | # of pumping stations |
| UG Center | 18 |
| UG South | 32 |
| UG North | 15 |
AYA GOLD & SILVER INC., BOUMADINE POLYMETALLIC PROJECT 220
16.6.7Stope Backfilling
Considering that the mining method adopted for the underground mine is modified Avoca method, the type of backfill will be rock fill (RF) and cemented rock fill (CRF), using waste rock from either the underground mine development or the OP operations.
16.6.7.1Cement Slurry Process
CRF slurry will be mixed in a surface batch plant and then stored in an agitated tank for delivery into a transmixer. The transmixer will transport the CRF slurry UG and dump it onto a measured amount of waste rock stored in a mixing bay near the stope to be backfilled. It is important that the correct proportion of CRF slurry be added to the correct amount of waste rock to ensure the cured target strength of the CRF is achieved. An LHD will thoroughly mix the CRF slurry with the waste rock, ensuring a homogeneous mixture is delivered to the stope. Figure 16-18 represents a schematic of the typical placement of cemented rock fill. Figure 16-17 shows the process of batching and transporting the cement slurry underground.
Figure 16‑17 Cement Slurry Process and Transportation Underground
16.6.7.2Underground CRF Mixing Sump
As illustrated in Figure 16-18, the mix of waste and cement slurry is made in a mixing sump. This process offers the lowest cost form of exposable backfill available for small narrow vein stoping operations. Due to
AYA GOLD & SILVER INC., BOUMADINE POLYMETALLIC PROJECT 221
the variable nature of run-of-mine and limited control over the sump mixing process, CRF is generally not suitable for underhand exposure in man-entry stopes. The variability of the CRF material is limited by using only good quality waste rock that has no clay component and screening particles greater than 400 mm from the waste. Ongoing quality control and assurance is critical to the safe and efficient implementation of CRF. A thorough QA/QC procedure must be developed that includes inspection of waste material, sampling of the cement slurry, reconciliation of cement consumption, sampling and laboratory testing of CRF material, and visual inspection of exposure performance.
Figure 16‑18 Mixing Sump Schematic
16.6.7.3Stope Backfill Placement
Rock fill will be placed in the stopes by direct dumping from access levels, depending on stope geometry and accessibility. For cemented rockfill, the material will consist of cemented waste rock and waste rock. Placement will generally proceed in lifts, with each lift allowed to settle before subsequent filling to maintain stability and prevent backfill dilution. The cemented rock fill and rock fill mass will act primarily as passive support rather than structural strength during adjacent stope extraction. The use of rock fill as a primary backfilling option will improve the mining cycle by reducing the quantity of waste that must be rehandled. Figure 16-19 shows a schematic of the ratio of CRF and RF that will be used in poor ground conditions.
AYA GOLD & SILVER INC., BOUMADINE POLYMETALLIC PROJECT 222
Figure 16‑19 Stope Backfill Placement in Poor Ground Conditions
As mentioned earlier, the first level will be fully cemented to permit the recovery of the sill pillar below the mining horizon. CCE recommends evaluating the use of surface backfill raises to ensure a performant and efficient underground waste rock distribution. The overall system must provide operational flexibility and efficiency enabling continuous backfilling concurrent with extraction.
16.6.8Underground Mine Equipment
The underground mobile equipment estimate has been detailed for all activities. A portion of the fleet will be owned and operated by the development contractors. Raiseboring development will be completed by contractors. The Mobile equipment units needed per year for each type of equipment are based on their estimated productivity and the planned production targets outlined in the LOM plan. Additional units are included in the cost estimate to account for availability factors. The LOM mobile equipment fleet is summarized in Table 16‑11.
AYA GOLD & SILVER INC., BOUMADINE POLYMETALLIC PROJECT 223
Table 16‑11 Operating mobile equipment units – Annual requirements
| | | | | | | | | | | | | | | | | | | | | | | | | | | | | | | | | | | | | | | | | | | | | | | | | | |
Description | Model | 2029 | 2030 | 2031 | 2032 | 2033 | 2034 | 2035 | 2036 | 2037 | 2038 | 2039 | 2040 | 2041 | 2042 | 2043 |
| Jumbo | Sandvik DD321 | - | - | 2 | 4 | 5 | 5 | 6 | 7 | 7 | 8 | 8 | 8 | 8 | 6 | 1 |
| Production Drill | Sandvik DL311 | - | - | - | 1 | 2 | 2 | 2 | 3 | 3 | 3 | 3 | 3 | 3 | 3 | 2 |
| Drill Compressor | | - | - | - | 1 | 2 | 2 | 2 | 3 | 3 | 3 | 3 | 3 | 3 | 3 | 2 |
| Emulsion Charger | PAUS UNI 40ST-LG | - | - | 1 | 2 | 2 | 2 | 2 | 3 | 3 | 3 | 3 | 3 | 3 | 2 | 1 |
| 33 tonnes Mine Truck | Epiroc MT436B | - | - | 1 | 2 | 4 | 5 | 6 | 6 | 8 | 8 | 6 | 6 | 7 | 7 | 2 |
| 10 tonnes LHD | Epiroc ST1030 | - | - | 1 | 3 | 5 | 8 | 8 | 9 | 9 | 10 | 10 | 10 | 10 | 10 | 4 |
| Bolter | Sandvik DS 421 | - | - | 3 | 5 | 6 | 6 | 7 | 8 | 8 | 9 | 9 | 9 | 8 | 7 | 2 |
| Transmixer | Partindus HURON 45 | - | - | 1 | 1 | 1 | 1 | 1 | 1 | 1 | 1 | 1 | 1 | 1 | 1 | 1 |
| Scissor Lift | PAUS Scissor Lift | - | - | 2 | 2 | 3 | 3 | 3 | 3 | 3 | 3 | 3 | 3 | 3 | 2 | 1 |
| Boom Truck | PAUS TSL 853 T7 | - | - | 5 | 5 | 5 | 5 | 5 | 5 | 5 | 5 | 5 | 5 | 5 | 5 | 5 |
| Grader | XCMG GR135C | - | - | 1 | 1 | 1 | 1 | 1 | 1 | 1 | 1 | 1 | 1 | 1 | 1 | 1 |
| Fuel Lube Truck | PAUS UNI 40SV | - | - | 1 | 1 | 1 | 1 | 1 | 1 | 1 | 1 | 1 | 1 | 1 | 1 | 1 |
| Water Truck | PAUS UNI 40SV | - | - | 1 | 1 | 1 | 1 | 1 | 1 | 1 | 1 | 1 | 1 | 1 | 1 | 1 |
| Pickup Truck | Toyota Hilux | - | - | 15 | 15 | 15 | 15 | 15 | 15 | 15 | 15 | 15 | 15 | 15 | 15 | 15 |
| Mine rescue Truck | ACCESS | - | - | 1 | 1 | 1 | 1 | 1 | 1 | 1 | 1 | 1 | 1 | 1 | 1 | 1 |
Total | | - | - | 35 | 45 | 54 | 58 | 61 | 67 | 69 | 72 | 70 | 70 | 70 | 65 | 40 |
Note: It is assumed that the raiseboring development will be completed by a contractor.
AYA GOLD & SILVER INC., BOUMADINE POLYMETALLIC PROJECT 224
16.6.9Underground Mine Personnel
The mine will operate year-round, seven (7) days per week, twenty-four (24) hours per day, two (2) shifts of 12-hour shifts. Most of the staff will be recruited locally, supplemented by a few expatriate personnel were needed. In addition, Aya plans to mobilize experienced personnel from its Zgounder mine in Morocco to provide on-site training and help ensure that operations are conducted safely and efficiently.
Table 16-12 shows the staffing requirements for full production, covering underground production as well as technical, supervisory, and support staff. It excludes contractor personnel involved in surface production and underground development. This table considers absences, leave, and temporary vacancies.
AYA GOLD & SILVER INC., BOUMADINE POLYMETALLIC PROJECT 225
Table 16‑12 Maximum Labour Requirements | | | | | | | | | | | | | | | | | | | | | | | | | | | | | | | | | | | | | | | | | | | | | | | |
Task | 2029 | 2030 | 2031 | 2032 | 2033 | 2034 | 2035 | 2036 | 2037 | 2038 | 2039 | 2040 | 2041 | 2042 | 2043 |
Open Pit Employees Owner Only |
| O/P Superintendent | 1 | 1 | 1 | 1 | 1 | 1 | 1 | 1 | 1 | 1 | 1 | - | - | - | - |
| O/P Mine Administrative | 1 | 1 | 1 | 1 | 1 | 1 | 1 | 1 | 1 | 1 | 1 | - | - | - | - |
| O/P Captain | 1 | 1 | 1 | 1 | 1 | 1 | 1 | 1 | 1 | 1 | 1 | - | - | - | - |
| O/P Technical Services | 10 | 10 | 10 | 10 | 10 | 10 | 10 | 10 | 10 | 10 | 10 | - | - | - | - |
Subtotal | 13 | 13 | 13 | 13 | 13 | 13 | 13 | 13 | 13 | 13 | 13 | - | - | - | - |
Underground Employees Owner Only |
Staff |
| U/G Superintendent | - | 1 | 1 | 1 | 1 | 1 | 1 | 1 | 1 | 1 | 1 | 1 | 1 | 1 | 1 |
| U/G Mine Supervisor | - | 1 | 9 | 14 | 16 | 20 | 22 | 23 | 25 | 25 | 25 | 25 | 24 | 24 | 13 |
| U/G Technical Services | - | - | - | 36 | 36 | 36 | 36 | 36 | 36 | 36 | 36 | 36 | 36 | 36 | 36 |
| Maintenance Supervisor | - | 1 | 2 | 5 | 6 | 6 | 6 | 6 | 6 | 6 | 6 | 6 | 6 | 6 | 6 |
| Maintenance Planner | - | - | - | 2 | 2 | 2 | 2 | 2 | 2 | 2 | 2 | 2 | 2 | 2 | 2 |
Subtotal | - | 3 | 12 | 58 | 61 | 65 | 67 | 68 | 70 | 70 | 70 | 70 | 69 | 69 | 58 |
Mine Operating |
| Dev. Jumbo | - | - | 4 | 8 | 8 | 10 | 13 | 16 | 16 | 15 | 15 | 15 | 15 | 12 | - |
| Raisebore | - | - | - | - | - | | | | | | | | | | |
| Production Drill | - | - | - | 3 | 4 | 8 | 8 | 10 | 10 | 12 | 11 | 10 | 11 | 12 | 5 |
| Production Drill Services | - | - | - | 3 | 4 | 8 | 8 | 10 | 10 | 12 | 11 | 10 | 11 | 12 | 5 |
| Emulsion Loading | - | - | - | 3 | 3 | 5 | 5 | 6 | 7 | 7 | 7 | 7 | 7 | 6 | 1 |
| Tramming (33t Truck) | - | - | 2 | 8 | 13 | 20 | 23 | 23 | 31 | 32 | 26 | 26 | 26 | 26 | 8 |
| LHD (10t) | - | - | 1 | 9 | 15 | 25 | 27 | 30 | 33 | 36 | 33 | 33 | 33 | 33 | 15 |
| Bolter | - | - | 4 | 12 | 12 | 14 | 17 | 20 | 20 | 24 | 24 | 24 | 19 | 16 | 4 |
| Transmixer | - | - | 4 | 4 | 4 | 4 | 4 | 4 | 4 | 4 | 4 | 4 | 4 | 4 | 4 |
| Scissor Lift | - | - | 4 | 6 | 6 | 7 | 7 | 8 | 8 | 8 | 8 | 8 | 8 | 7 | 4 |
| Boom Truck | - | - | 40 | 40 | 40 | 40 | 40 | 40 | 40 | 40 | 40 | 40 | 40 | 40 | 40 |
| Grader | - | - | 8 | 8 | 8 | 8 | 8 | 8 | 8 | 8 | 8 | 8 | 8 | 8 | 8 |
| Fuel/Lube Truck | - | - | 4 | 4 | 4 | 4 | 4 | 4 | 4 | 4 | 4 | 4 | 4 | 4 | 4 |
| Water Truck | - | - | 4 | 4 | 4 | 4 | 4 | 4 | 4 | 4 | 4 | 4 | 4 | 4 | 4 |
Subtotal | - | - | 75 | 112 | 125 | 157 | 168 | 183 | 195 | 206 | 195 | 193 | 190 | 184 | 102 |
Maintenance |
| Mobile Mechanic | - | 1 | 9 | 11 | 13 | 15 | 16 | 17 | 18 | 18 | 18 | 18 | 18 | 18 | 11 |
| Fixed Mechanic | - | - | - | 8 | 8 | 8 | 8 | 8 | 8 | 8 | 8 | 8 | 8 | 8 | 8 |
| Fixed Mech. Batch Plant | - | - | - | 4 | 4 | 4 | 4 | 4 | 4 | 4 | 4 | 4 | 4 | 4 | 4 |
| Mobile Electrician | - | 1 | 3 | 4 | 5 | 5 | 6 | 6 | 6 | 6 | 6 | 6 | 6 | 6 | 4 |
| Fixed Electrician | - | - | - | 8 | 8 | 8 | 8 | 8 | 8 | 8 | 8 | 8 | 8 | 8 | 8 |
| Fixed Elec. Batch Plant | - | - | - | 4 | 4 | 4 | 4 | 4 | 4 | 4 | 4 | 4 | 4 | 4 | 4 |
Subtotal | - | 2 | 12 | 39 | 42 | 44 | 46 | 47 | 48 | 48 | 48 | 48 | 48 | 48 | 39 |
Total AYA O/P & U/G | 13 | 18 | 112 | 222 | 241 | 279 | 295 | 312 | 326 | 337 | 326 | 311 | 307 | 301 | 199 |
AYA GOLD & SILVER INC., BOUMADINE POLYMETALLIC PROJECT 226
16.7Stockpile Management
Net smelter return (NSR) was used to assess the economic potential of the Boumadine project. The NSR value represents the expected net value of the payable metal contained the in saleable concentrates, after deducting treatment, refining and penalty charges.
The NSR-Mine was calculated as an additional block model field, allowing a single value representing lead, zinc, gold and silver grades to be used for mine planning, scheduling, and stockpile classification. A second value, the NSR-Pyrite, was calculated to further classify the higher-value material based on the value of its pyrite concentrate. This section describes the calculation of the NSR-Mine and NSR-Pyrite, followed by the stockpile classification criteria.
16.7.1NSR Calculation – Production Plan
The NSR-Mine formula was derived by estimating the net revenue generated per unit of head grade for each payable metal, based on the three saleable concentrates expected from the process plant: a lead concentrate (payable lead, gold and silver), a zinc concentrate (payable zinc) and a pyrite concentrate (payable gold and silver). The metal prices, refining charges and treatment charges applied to each concentrate are presented in Table 16-13.
Table 16-13 Metal Prices and Smelter Terms by Concentrate
| | | | | | | | | | | |
Element | Metal Price | Refining Charge | Price net of RC |
Lead Concentrate – TC US$122/dmt (incl. US$22/dmt penalties); 29.6% Pb concentrate grade |
| Pb | US$1.00/lb | – | US$1.00/lb |
| Au | US$2,800/oz | US$30.00/oz | US$2,770/oz |
| Ag | US$30.00/oz | US$1.50/oz | US$28.50/oz |
Zinc Concentrate – TC US$205.50/dmt (incl. US$7/dmt penalties); 57.4% Zn concentrate grade |
| Zn | US$1.20/lb | – | US$1.20/lb |
Pyrite Concentrate – no treatment or refining charges |
| Au | US$2,800/oz | – | US$2,800/oz |
| Ag | US$30.00/oz | – | US$30.00/oz |
Gross payable values were calculated from the metallurgical recovery, smelter payable and metal price net of refining charges, converted to the appropriate grade unit (22.046 lb per 1% of a tonne for lead and zinc, and 31.1035 g per troy ounce for gold and silver). Treatment charges are levied per dry tonne of concentrate and, at a constant recovery and concentrate grade, are directly proportional to the lead or zinc head grade. They were therefore expressed per percent of head grade and deducted from the lead and zinc factors, respectively. No treatment or refining charges were applied to the pyrite concentrate.
Concentrate transportation, storage, ship loading and ocean freight costs were set to zero in the NSR calculation.
The derivation of each NSR-Mine factor is summarized in Table 16-14.
AYA GOLD & SILVER INC., BOUMADINE POLYMETALLIC PROJECT 227
Table 16-14 NSR-Mine Factor Derivation
| | | | | | | | | | | | | | | | | | | | |
Concentrate | Recovery (%) | Payable (%) | Price net of RC | Gross Value | Less TC | NSR Factor |
Lead – US$ per % Pb |
| Lead | 82.0 | 90.0 | US$1.00/lb | 16.25 | (3.38) | 12.87 |
Zinc – US$ per % Zn |
| Zinc | 74.7 | 85.0 | US$1.20/lb | 16.80 | (2.67) | 14.12 |
Gold – US$ per g/t Au |
| Lead | 23.8 | 95.0 | US$2,770/oz | 20.14 | – | 20.14 |
| Pyrite | 71.4 | 78.0 | US$2,800/oz | 50.14 | – | 50.14 |
Total | | | | 70.27 | – | 70.27 |
Silver – US$ per g/t Ag |
| Lead | 50.4 | 95.0 | US$28.50/oz | 0.44 | – | 0.44 |
| Pyrite | 41.4 | 78.0 | US$30.00/oz | 0.31 | – | 0.31 |
Total | | | | 0.75 | – | 0.75 |
Note: Treatment charge deductions are based on the treatment charges and concentrate grades in Table 16-13. Totals may not add due to rounding.
The resulting NSR-Mine formula is:
NSR-Mine (US$/t) = (Pb% x $12.87) + (Zn% x $14.12) + (Au g/t x $70.27) + (Ag g/t x $0.75) - $6.75*
* Royalties per tonne of feed.
16.7.2NSR Calculation – Pyrite Concentrate
The NSR-Pyrite is expressed per tonne of pyrite concentrate rather than per tonne of plant feed. It indicates the potential value of the pyrite concentrate generated from each tonne of plant feed. As each tonne of feed produces less than one tonne of pyrite concentrate, the NSR-Pyrite may be higher than the NSR-Mine.
The value of the gold and silver reporting to the pyrite concentrate was first calculated per tonne of feed, using the pyrite concentrate factors from Table 16-14. This value was then divided by the mass of pyrite concentrate produced per tonne of feed, which is estimated from the iron head grade using the iron recovery and pyrite concentrate grade presented in Table 16-15. For example, feed grading 22% Fe produces approximately 0.51 t of pyrite concentrate per tonne.
Table 16-15 NSR-Pyrite Calculation Parameters
| | | | | | | | |
Parameter | Unit | Value |
Pyrite Concentrate Value (from Table 16-14) |
| Gold factor | US$ per g/t Au | 50.14 |
| Silver factor | US$ per g/t Ag | 0.31 |
Pyrite Concentrate Mass |
| Fe recovery to pyrite concentrate | % | 89.0 |
| Pyrite concentrate grade | % Fe | 38.1 |
| Mass factor (89.0% / 38.1% Fe) | t conc./t feed per % Fe | 0.02336 |
The resulting NSR-Pyrite formula is:
NSR-Pyrite (US$/t) = ((Au g/t x $50.14) + (Ag g/t x $0.31)) / (Fe% x 0.02336)
AYA GOLD & SILVER INC., BOUMADINE POLYMETALLIC PROJECT 228
16.7.3Stockpile Classification
The mineralized material included in the production schedule has been classified into three stockpiles (Low Grade Stockpile, LG Pyrite Stockpile and HG Pyrite Stockpile) based on both the NSR-Mine and the NSR-Pyrite. The classification thresholds for the open pit and underground mines are presented in Table 16-16 and illustrated in Figure 16-20.
Table 16-16 Stockpile Classification Criteria
| | | | | | | | |
Stockpile | NSR-Mine | NSR-Pyrite |
Open Pit |
| Low Grade Stockpile | US$60/t ≤ NSR-Mine < US$140/t | – |
| LG Pyrite Stockpile | NSR-Mine ≥ US$140/t | NSR-Pyrite < US$340/t |
| HG Pyrite Stockpile | NSR-Mine ≥ US$140/t | NSR-Pyrite ≥ US$340/t |
Underground |
| Low Grade Stockpile | US$77/t ≤ NSR-Mine < US$130/t | – |
| LG Pyrite Stockpile | NSR-Mine ≥ US$130/t | NSR-Pyrite < US$240/t |
| HG Pyrite Stockpile | NSR-Mine ≥ US$130/t | NSR-Pyrite ≥ US$240/t |
Figure 16‑20 Stockpile Classification Parameters
16.8Production Plan
Both the underground (UG) and open-pit (OP) mining sequences were developed using Deswik Scheduler software. The life-of-mine (LOM) production plan for the Boumadine project extends over fifteen (15) years, including pre-production.
To improve the project overall economics, the production schedule prioritizes the mining of higher-grade mineralized material during the early years. In addition, underground production is intentionally deferred by two (2) years after the start of open-pit operations. This phased approach allows for earlier cash flow
AYA GOLD & SILVER INC., BOUMADINE POLYMETALLIC PROJECT 229
generation from open-pit mining while delaying the capital-intensive underground development to a later stage of the mine life.
16.8.1Pre-Production Plan
Production is scheduled to begin in early 2029, during the project construction phase (“Year 0” of the financial model). As such, pre-production activities must begin well in advance to allow for the early critical works. The main activities carried out during the pre-production period will include the construction of roads, pads, and surface waste stockpiles. Pre-stripping of the mining areas (OP) will be performed by a contractor. The waste rock dump facilities must be prepared before stripping can begin.
16.8.2Open Pit Production Plan
Open pit mining will begin in two main areas in the Center and South pits, prioritizing higher-grade mineralized material. The Central pit, which contains higher-grade mineralized material, will serve as the main pit, and will be mined first, starting in 2029. Mining in this pit will continue for approximately eleven (11) years. The Central Pit will be mined in four (4) phases.
At the same time, South pit will be developed more gradually to supplement production from Central Pit. The South Pit will be mined in two (2) phases.
South pit will be mined over a period of six (6) years, while mining at North pit will start in 2034. The annual production projected, including both mineralized material and waste is scheduled at a maximum of 55Mt per year.
Figure 16-21 a, b, c, d, e and f present the open pit mining for Central, Southern and Northern pits.
AYA GOLD & SILVER INC., BOUMADINE POLYMETALLIC PROJECT 230
Figure 16‑21 Open Pit Sequence: Surface view every 2 year: (a) 2030 (b) 2032 (c) 2034 (d) 2036 (e) 2038 (f) 2039
AYA GOLD & SILVER INC., BOUMADINE POLYMETALLIC PROJECT 231
Table 16-17 shows the breakdown of open-pit life-of-mine (LOM) production by stockpiles, while Table 16-18 shows a production breakdown by pit. All tonnes shown are diluted at 5% with 0% mineralized material loss.
Table 16‑17 Open Pit Life-Of-Mine Production by Stockpile | | | | | | | | | | | | | | | | | | | | | | | | | | | | | | | | | | | | | | |
Description | Units | 2029 | 2030 | 2031 | 2032 | 2033 | 2034 | 2035 | 2036 | 2037 | 2038 | 2039 |
HG Pyrite Stockpile |
| Mineralized material tonnage | tonnes | 634,432 | 902,494 | 511,050 | 885,797 | 2,399,064 | 321,842 | 658,421 | 19,820 | 82,579 | 804,509 | 1,367,008 |
| NSR Average | $/tonne | 340.4 | 470.0 | 262.8 | 346.7 | 355.1 | 273.3 | 310.4 | 225.1 | 208.3 | 299.0 | 339.9 |
LG Pyrite Stockpile |
| Mineralized material tonnage | tonnes | 367,871 | 1,177,778 | 667,392 | 952,227 | 676,575 | 1,095,513 | 958,316 | 418,073 | 643,452 | 1,124,585 | 384,541 |
| NSR Average | $/tonne | 193.4 | 230.6 | 191.2 | 209.9 | 224.1 | 192.5 | 192.0 | 158.3 | 174.8 | 193.0 | 245.3 |
Low Grade Stockpile |
| Mineralized material tonnage | tonnes | 330,856 | 423,248 | 632,714 | 437,938 | 332,672 | 567,495 | 759,027 | 535,048 | 477,575 | 656,180 | 148,003 |
| NSR Average | $/tonne | 97.8 | 97.3 | 92.5 | 98.8 | 93.6 | 97.9 | 98.1 | 100.1 | 96.8 | 103.0 | 109.5 |
|
| Mineralized material tonnage | tonnes | 1,333,158 | 2,503,519 | 1,811,155 | 2,275,963 | 3,408,312 | 1,984,850 | 2,375,764 | 972,941 | 1,203,606 | 2,585,273 | 1,899,552 |
| NSR Average | $/tonne | 239.6 | 294.4 | 176.9 | 241.7 | 303.6 | 178.6 | 194.8 | 127.7 | 146.2 | 203.2 | 302.8 |
Table 16‑18 Open Pit Life-Of-Mine Production by Zone
| | | | | | | | | | | | | | | | | | | | | | | | | | | | | | | | | | | | | | | | | |
| Description | Units | 2029 | 2030 | 2031 | 2032 | 2033 | 2034 | 2035 | 2036 | 2037 | 2038 | 2039 | Total |
| Central Pit |
| Mineralized material tonnage | tonnes | 1,329,316 | 1,977,788 | 1,011,004 | 1,268,656 | 2,712,296 | 1,255,810 | 1,451,152 | 589,508 | 622,443 | 2,585,273 | 1,899,552 | 16,702,797 |
| NSR Average | $/tonne | 240 | 324.7 | 156.3 | 188.7 | 286.8 | 193.3 | 218.2 | 127.9 | 136.7 | 203.2 | 302.8 | 236.9 |
| Waste Mined | tonnes | 13,666,926 | 23,007,125 | 28,984,998 | 28,741,745 | 43,322,528 | 38,746,713 | 41,295,737 | 48,310,678 | 41,079,349 | 47,414,706 | 24,898,476 | 379,468,981 |
| Total Material | tonnes | 14,996,243 | 24,984,913 | 29,996,002 | 30,010,401 | 46,034,825 | 40,002,523 | 42,746,888 | 48,900,186 | 41,701,792 | 49,999,979 | 26,798,028 | 396,171,778 |
| South Pit |
| Mineralized material tonnage | tonnes | 3,842 | 525,731 | 800,152 | 1,007,307 | 696,015 | - | - | - | 581,163 | - | - | 3,614,210 |
| NSR Average | $/tonne | 104.7 | 180.1 | 203 | 308.6 | 368.8 | - | - | - | 156.3 | - | - | 253.4 |
| Waste Mined | tonnes | 5,000,147 | 19,485,012 | 24,203,866 | 23,992,686 | 8,269,186 | - | - | - | 12,720,089 | - | - | 93,670,985 |
| Total Material | tonnes | 5,003,989 | 20,010,743 | 25,004,017 | 24,999,993 | 8,965,201 | - | - | - | 13,301,252 | - | - | 97,285,196 |
| North Pit |
| Mineralized material tonnage | tonnes | - | - | - | - | - | 729,041 | 924,613 | 383,433 | - | - | - | 2,037,087 |
| NSR Average | $/tonne | - | - | - | - | - | 153.2 | 158.2 | 127.2 | - | - | - | 150.5 |
| Waste Mined | tonnes | - | - | - | - | - | 14,270,032 | 11,328,410 | 5,718,903 | - | - | - | 31,317,345 |
| Total Material | tonnes | - | - | - | - | - | 14,999,072 | 12,253,023 | 6,102,336 | - | - | - | 33,354,432 |
| Total Tonnage Mined |
| Mineralized material tonnage | tonnes | 1,333,158 | 2,503,519 | 1,811,155 | 2,275,963 | 3,408,312 | 1,984,850 | 2,375,764 | 972,941 | 1,203,606 | 2,585,273 | 1,899,552 | 22,354,094 |
| NSR Average | $/tonne | 239.6 | 294.4 | 176.9 | 241.7 | 303.6 | 178.6 | 194.8 | 127.7 | 146.2 | 203.2 | 302.8 | 231.7 |
| Waste Mined | tonnes | 18,667,073 | 42,492,137 | 53,188,864 | 52,734,431 | 51,591,714 | 53,016,745 | 52,624,147 | 54,029,581 | 53,799,438 | 47,414,706 | 24,898,476 | 504,457,312 |
| Total Material | tonnes | 20,000,232 | 44,995,656 | 55,000,019 | 55,010,394 | 55,000,025 | 55,001,596 | 54,999,911 | 55,002,522 | 55,003,044 | 49,999,979 | 26,798,028 | 526,811,406 |
| Stripping Ratio | | 14 | 17 | 29 | 23 | 15 | 27 | 22 | 56 | 45 | 18 | 13 | 23 |
AYA GOLD & SILVER INC., BOUMADINE POLYMETALLIC PROJECT 232
Figure 16-22 Mineralized Material Mined per Year and per Pits
Figure 16-23 Waste Mined per Year per Pits
AYA GOLD & SILVER INC., BOUMADINE POLYMETALLIC PROJECT 233
Figure 16-24 Open Pit Life-of-Mine Production Plan and NSR
AYA GOLD & SILVER INC., BOUMADINE POLYMETALLIC PROJECT 234
•
16.8.3Underground Development Plan
Development of the underground facility is expected to begin in 2031 and will take approximately one year to reach full production capacity for the first portal. Full ramp up of underground production will end in 2038, as open pit production ramps down. All development activities will be carried out by a contractor, except for sill development. The pre-production phase of underground operations will include the procurement of equipment, the portal excavation and ventilation shafts, as well as the recruitment of qualified mining personnel to support the start-up of underground mining operations.
Access to all underground mining zones of the Boumadine deposit will be provided by spiral ramps, either from the surface or from existing pits that have already been developed.
Ramps will provide access to all levels of the mine and, subsequently, to the production sub-levels, which will be spaced 20 meters apart. Also, the ramps will be used for:
•Hauling mineralized material and waste to surface;
•Moving equipment and personnel from level to level;
•Providing return airways and serving as emergency egress;
•Providing a pathway for the mine dewatering.
Other ancillary infrastructures will be located throughout the mine, such as drainage sumps, main pumping station, electrical substations, powder magazines, lubricant and fuel storage bays.
Vertical development will consist of a surface ventilation raise, which will be excavated using raise boring machine, and inter level raises that will be developed as drop raises or raise bore depending on the airflow needs and the length of raises. The exhaust air raises will be driven in parallel with the main ramp. In addition, the exhaust raises will connect all levels and sublevels and equipped with ladders to serve as secondary escape routes.
It is also assumed that a portion the surface waste material will be backhauled underground to supplement the waste generated by development, when required. Figure 16-25 shows the main underground infrastructures for the south zone portal 1.
AYA GOLD & SILVER INC.235
Figure 16-25 Development Heading (South Zone Portal 1)
The lateral development rate used for the Boumadine project is based on the Zgounder mine. Table 16-19 presents the performance used in Deswik Mine Scheduler.
Table 16-19 Development Performance Rate
| | | | | | | | |
Activity / Per Dev Team | Unit | Underground Rate |
Decline and Mine Access | m/day | 8 |
Lateral waste development, multiple headings | m/day | 8 |
Sill development, multiple headings | m/day | 8 |
Vertical Development | m/day | 3 |
The dilution factor and the recovery for the mineralized development used are at 0% and 100% respectively, and the incremental NSR cut-off applied for development is 77 $/tonne. In addition, an uplift factor was used to account for added meter from infrastructure that was not designed at this stage and additional Opex meters. A factor of 10% was used on the Capex meters and 5% on the Opex meters.
Table 16-20 presents the LOM development plan summarized by development type and categorized into Capital and Operating.
AYA GOLD & SILVER INC.236
Table 16‑20 Life-of-Mine Underground Development Plan
| | | | | | | | | | | | | | | | | | | | | | | | | | | | | | | | | | | | | | | | | | | | | | | | | | | | | |
Description | Unit | 2029 | 2030 | 2031 | 2032 | 2033 | 2034 | 2035 | 2036 | 2037 | 2038 | 2039 | 2040 | 2041 | 2042 | 2043 | Total |
Lateral Development |
Ramp | m | - | - | 3,563 | 3,578 | 5,354 | 4,394 | 3,651 | 4,686 | 5,736 | 5,716 | 5,480 | 5,983 | 7,076 | 3,065 | - | 58,282 |
Level Access | m | - | - | 727 | 1,320 | 1,870 | 1,347 | 3,513 | 2,615 | 1,655 | 3,350 | 4,311 | 2,481 | 1,999 | 1,619 | - | 26,807 |
Sill | m | - | - | - | 5,819 | 5,840 | 7,496 | 9,496 | 11,712 | 11,680 | 10,753 | 10,975 | 14,307 | 11,177 | 9,030 | 322 | 108,607 |
Ventilation Drift | m | - | - | 597 | 465 | 843 | 1,046 | 989 | 524 | 874 | 1,095 | 1,280 | 2,582 | 2,164 | 1,387 | - | 13,846 |
Dev. Infrastructure | m | - | - | 313 | 493 | 693 | 368 | 582 | 614 | 495 | 895 | 610 | 612 | 441 | 513 | - | 6,629 |
Total Lateral Dev. | m | - | - | 5,200 | 11,675 | 14,600 | 14,651 | 18,231 | 20,151 | 20,440 | 21,809 | 22,656 | 25,965 | 22,857 | 15,614 | 322 | 214,171 |
Vertical Development |
Ventilation Raises | m | - | - | 266 | 433 | 945 | 875 | 464 | 1,092 | 926 | 1,286 | 356 | 1,091 | 1,319 | 914 | - | 9,967 |
Dewatering Holes | m | - | - | 173 | 292 | 528 | 160 | 236 | 372 | 242 | 541 | 218 | 211 | - | 270 | - | 3,243 |
CAPEX vs OPEX Development |
CAPEX Dev. | m | - | - | 5,639 | 6,581 | 10,233 | 8,190 | 9,435 | 9,903 | 9,928 | 12,883 | 12,255 | 12,960 | 12,999 | 7,768 | - | 118,774 |
OPEX Dev. | m | - | - | - | 5,819 | 5,840 | 7,496 | 9,496 | 11,712 | 11,680 | 10,753 | 10,975 | 14,307 | 11,177 | 9,030 | 322 | 108,607 |
AYA GOLD & SILVER INC.237
16.8.4Underground Production Plan
Since the underground mine will operate in parallel with open-pit mining activities, zone access ramps will start construction from the surface. This approach ensures rapid access to the underground mining areas without being constrained by the sequence of open-pit mining operations. There will be five portals providing surface access: Portals 1 to 3 in the South Zone, Portal 4 in the Center Zone, and Portal 5 in the North Zone. The zones and their respective portal numbers can be seen in Figures 16-26, 16-27, and 16-28 below.
The underground mining sequence will follow the same strategy as the open-pit operation, prioritizing high-grade zones. The sequence of each portal was independently evaluated and optimized prior to integration in the overall sequence. When considering only average NSR, the ideal sequence would be Portal 1, 3, 2, 4, and then 5. However, additional considerations such as accessibility to higher and lower grade areas, resource utilization, development requirements and timelines, and yearly consistency in production in terms of grade and tonnage was included in the evaluation of the optimized underground sequence. As such, underground operations will begin in Portal 1 in 2031, with mineralized material production in 2032. Portal 1 is followed by Portal 4 in 2034, Portal 3 in 2036, Portal 2 in late 2036, and Portal 5 in 2038. Portals 4 and 5 will continue operating in tandem until underground mining operations are complete in 2043.
Figure 16‑26 Primary UG Mining Area in the South Zone
In the early years of the schedule, as mineralized material production and capital spending are ramping up, Portal 1 will be the sole focus of mining operations. Portal 4 will begin development in 2034 to achieve maximum mineralized material production in 2036 when Portal 1’s production capabilities start diminishing. Operations in Portal 3 will commence in 2036, followed by Portal 2 towards the end of the year as more equipment resources are freed from Portal 1 in the lead up to its completion in early 2037. Priority shifts to Portals 3 and 2 in 2037, throttling Portal 4’s production as higher-grade mineralized material becomes depleted in the Center Zone.
AYA GOLD & SILVER INC.238
Figure 16‑27 Secondary UG Mining Area in the Center Zone
Portal 5 will begin development in 2038 and start ramping up its mineralized material contribution as mining operations in the South Zone come to completion with Portal 3 in 2039, and Portal 2 in 2040. After which Portal 5 remains the priority, focusing on its higher-grade areas and finishing together with the remainder of Portal 4 in 2043.
 Figure 16‑28 Remaining UG Mining Area in the North Zone
Where permitted and favorable to the mine sequence, deep mineralized zones have been divided into two or more mining horizons, separated by a sill pillar. The first mineable level of the mining horizon will be backfilled
AYA GOLD & SILVER INC.239
with Cemented Rock Fill (CRF), allowing for efficient and safe mining in the levels below. This strategy is important to reduce development requirements prior to mineralized material production in vertically long mineralized zones while enabling earlier access to high-grade areas.
The stope production cycle was estimated based on a typical stope with an average width of 3.6m, a height of 16 m (from the floor to ceiling), and a length of 20 m. The stope parameters were based on an average density of the mineralized material of 3.7 t/m³, a dilution of 5%, a recovery rate of 95%, and a swell factor of 1.365. Table 16-21 presents the production cycle parameters used in Deswik Scheduler.
Table 16‑21 Stope Production Cycle Parameters
| | | | | | | | | | | |
Activity | Unit | Rate | Duration (day) |
Stope Preparation | d/stope | 2 | 2 |
Production Drilling | m/d/drill | 345 | 2 |
Blasting | d/stope | 0.6 | 0.6 |
Mucking | t/d | 1530 | 2.8 |
Backfill Preparation | d/stope | 1 | 1 |
Average Stope Backfill | t/d | 1 637 | 1.6 |
Stope Curing Time | Day | 14 | 14 |
Stope Cycle (average) | Day | | 24 |
Table 16-22 and 16-23 present the underground production profile by stockpiles and by zones.
AYA GOLD & SILVER INC.240
Table 16‑22 Underground Production Plan Sorted by Stockpile Category
| | | | | | | | | | | | | | | | | | | | | | | | | | | | | | | | | | | | | | | | | | | | | | | | | | | | | |
Description | Unit | 2029 | 2030 | 2031 | 2032 | 2033 | 2034 | 2035 | 2036 | 2037 | 2038 | 2039 | 2040 | 2041 | 2042 | 2043 | Total |
HG Pyrite Stockpile |
Mineralized material tonnage | tonnes | - | - | - | 166,212 | 219,782 | 160,924 | 295,852 | 698,010 | 615,182 | 656,802 | 230,231 | 252,717 | 146,284 | 231,213 | 16,655 | 3,689,864 |
NSR Average | $/tonne | - | - | - | 237.4 | 245.3 | 189.8 | 172.3 | 186.0 | 203.5 | 194.8 | 177.5 | 191.2 | 160.2 | 167.9 | 133.6 | 192.8 |
LG Pyrite Stockpile |
Mineralized material tonnage | tonnes | - | - | - | 300,330 | 372,721 | 946,072 | 726,048 | 550,009 | 517,641 | 641,570 | 586,623 | 892,347 | 1,097,850 | 650,140 | 415,637 | 7,696,988 |
NSR Average | $/tonne | - | - | - | 185.2 | 164.7 | 160.8 | 150.7 | 157.8 | 161.7 | 154.0 | 148.7 | 160.0 | 162.6 | 150.3 | 145.5 | 157.8 |
Low Grade Stockpile |
Mineralized material tonnage | tonnes | - | - | - | 100,416 | 232,578 | 364,892 | 496,395 | 626,740 | 712,287 | 701,525 | 1,119,196 | 854,776 | 755,672 | 1,118,450 | 424,942 | 7,507,869 |
NSR Average | $/tonne | - | - | - | 109.9 | 113.9 | 115.8 | 113.1 | 113.0 | 115.1 | 116.3 | 114.1 | 111.6 | 113.5 | 114.8 | 117.1 | 114.2 |
Total Mineralized Material Mined |
Mineralized material tonnage | tonnes | - | - | - | 566,958 | 825,081 | 1,471,888 | 1,518,295 | 1,874,759 | 1,845,110 | 1,999,897 | 1,936,050 | 1,999,840 | 1,999,806 | 1,999,803 | 857,234 | 18,894,721 |
NSR Average | $/tonne | - | - | - | 187.2 | 171.9 | 152.8 | 142.6 | 153.3 | 157.6 | 154.2 | 132.1 | 143.3 | 143.9 | 132.5 | 131.2 | 147.3 |
Table 16‑23 Underground Production Plan Sorted by Mining Zone
| | | | | | | | | | | | | | | | | | | | | | | | | | | | | | | | | | | | | | | | | | | | | | | | | | | | | |
Description | Unit | 2029 | 2030 | 2031 | 2032 | 2033 | 2034 | 2035 | 2036 | 2037 | 2038 | 2039 | 2040 | 2041 | 2042 | 2043 | Total |
Central Zone |
Mineralized material tonnage | tonnes | - | - | - | - | - | - | 96,430 | 1,276,745 | 1,268,514 | 547,656 | 702,639 | - | - | 208,532 | 154,242 | 4,254,758 |
NSR Average | $/tonne | - | - | - | - | - | - | 109.2 | 155.8 | 157.9 | 138.8 | 126.4 | - | - | 119.7 | 141.5 | 146.0 |
Waste Mined | tonnes | - | - | - | - | - | 164,120 | 431,639 | 215,244 | 57,432 | 43,202 | 3,557 | 92,324 | 3,076 | 227,211 | 2,639 | 1,240,444 |
Total Material Moved | tonnes | - | - | - | - | - | 164,120 | 528,069 | 1,491,989 | 1,325,946 | 590,858 | 706,196 | 92,324 | 3,076 | 435,743 | 156,881 | 5,495,202 |
South Zone |
Mineralized material tonnage | tonnes | - | - | - | 566,958 | 825,081 | 1,471,888 | 1,421,885 | 598,014 | 576,597 | 1,451,935 | 821,303 | 668,576 | - | - | - | 8,402,237 |
NSR Average | $/tonne | - | - | - | 187.2 | 171.9 | 152.9 | 144.9 | 148.1 | 157.1 | 159.9 | 138.9 | 148.9 | - | - | - | 155.2 |
Waste Mined | tonnes | - | - | 248,590 | 334,713 | 495,505 | 246,921 | 82,996 | 289,428 | 547,596 | 408,009 | 46,203 | 25,945 | - | - | - | 2,725,906 |
Total Material Moved | tonnes | - | - | 248,590 | 901,671 | 1,320,586 | 1,718,809 | 1,504,881 | 887,442 | 1,124,193 | 1,859,944 | 867,506 | 694,521 | - | - | - | 11,128,143 |
North Zone |
Mineralized material tonnage | tonnes | - | - | - | - | - | - | - | - | - | 306 | 412,108 | 1,331,265 | 1,999,806 | 1,791,271 | 702,992 | 6,237,748 |
NSR Average | $/tonne | - | - | - | - | - | - | - | - | - | 168.4 | 128.3 | 140.4 | 143.9 | 133.9 | 128.9 | 137.6 |
Waste Mined | tonnes | - | - | - | - | - | - | - | - | - | 262,807 | 613,500 | 571,408 | 687,164 | 269,156 | 2,782 | 2,406,817 |
Total Material Moved | tonnes | - | - | - | - | - | - | - | - | - | 263,113 | 1,025,608 | 1,902,673 | 2,686,970 | 2,060,427 | 705,774 | 8,644,565 |
Total Mineralized Material Mined |
Mineralized material tonnage | tonnes | - | - | - | 566,958 | 825,081 | 1,471,888 | 1,518,315 | 1,874,759 | 1,845,111 | 1,999,897 | 1,936,050 | 1,999,841 | 1,999,806 | 1,999,803 | 857,234 | 18,894,743 |
NSR Average | $/tonne | - | - | - | 187.2 | 171.9 | 152.9 | 142.6 | 153.3 | 157.7 | 154.1 | 132.1 | 143.2 | 143.9 | 132.4 | 131.2 | 147.3 |
Waste Mined | tonnes | - | - | 248,590 | 334,713 | 495,505 | 411,041 | 514,635 | 504,672 | 605,028 | 714,018 | 663,260 | 689,677 | 690,240 | 496,367 | 5,421 | 6,373,167 |
Total Material Moved | tonnes | - | - | 248,590 | 901,671 | 1,320,586 | 1,882,929 | 2,032,950 | 2,379,431 | 2,450,139 | 2,713,915 | 2,599,310 | 2,689,518 | 2,690,046 | 2,496,170 | 862,655 | 25,267,910 |
AYA GOLD & SILVER INC.241
Figure 16-29 Underground Mineralized Material Mined by Zones
Figure 16-30 Underground Mineralized Material Mined and NSR
16.8.5Combined Production Plan
The total mineralized material tonnage for the mine is estimated at 41.2 million tonnes, with an average NSR grade of 193 US$/t. OP mining will contribute with 54.2% of the total tonnage, while UG mining will account for the remaining 45.8%. In the final four years of the mine life, production will be exclusively from UG operations.
Because the tonnages from open pit and underground are not balanced year on year, the strategy is to use the different stockpiles to regulate and optimize the feed to the processing plant, ensuring a consistent tonnage and grade profile over the LOM. Boumadine production plan is summarized in Table 16‑24, Figure 16‑31 and Figure 16‑32.
AYA GOLD & SILVER INC.242
Table 16‑24 Boumadine Life-of-Mine Production Plan
| | | | | | | | | | | | | | | | | | | | | | | | | | | | | | | | | | | | | | | | | | | | | | | | | | | | | |
Description | Units | 2029 | 2030 | 2031 | 2032 | 2033 | 2034 | 2035 | 2036 | 2037 | 2038 | 2039 | 2040 | 2041 | 2042 | 2043 | Total |
Open Pit Mine |
Mineralized material tonnage | tonnes | 1,333,158 | 2,503,519 | 1,811,155 | 2,275,963 | 3,408,312 | 1,984,850 | 2,375,764 | 972,941 | 1,203,606 | 2,585,273 | 1,899,552 | - | - | - | - | 22,354,094 |
NSR Average | $/tonne | 239.6 | 294.4 | 176.9 | 241.7 | 303.6 | 178.6 | 194.8 | 127.7 | 146.2 | 203.2 | 302.8 | - | - | - | - | 231.7 |
Waste Mined | tonnes | 18,667,073 | 42,492,137 | 53,188,864 | 52,734,431 | 51,591,714 | 53,016,745 | 52,624,147 | 54,029,581 | 53,799,438 | 47,414,706 | 24,898,476 | - | - | - | - | 504,457,312 |
Total Material Moved | tonnes | 20,000,232 | 44,995,656 | 55,000,019 | 55,010,394 | 55,000,025 | 55,001,596 | 54,999,911 | 55,002,522 | 55,003,044 | 49,999,979 | 26,798,028 | - | - | - | - | 526,811,406 |
Underground Mine |
Mineralized material tonnage | tonnes | - | - | - | 566,958 | 825,081 | 1,471,888 | 1,518,295 | 1,874,759 | 1,845,111 | 1,999,897 | 1,936,050 | 1,999,841 | 1,999,806 | 1,999,803 | 857,234 | 18,894,722 |
NSR Average | $/tonne | - | - | - | 187.2 | 171.9 | 152.9 | 142.6 | 153.3 | 157.7 | 154.1 | 132.1 | 143.2 | 143.9 | 132.4 | 131.2 | 147.3 |
Waste Mined | tonnes | - | - | 248,590 | 334,713 | 495,505 | 411,041 | 514,635 | 504,672 | 605,028 | 714,018 | 663,260 | 689,677 | 690,240 | 496,367 | 5,421 | 6,373,167 |
Total Material Moved | tonnes | - | - | 248,590 | 901,671 | 1,320,586 | 1,882,929 | 2,032,930 | 2,379,431 | 2,450,139 | 2,713,915 | 2,599,310 | 2,689,518 | 2,690,046 | 2,496,170 | 862,655 | 25,267,889 |
Open Pit & Underground Tonnes Mined |
Mineralized material tonnage | tonnes | 1,333,158 | 2,503,519 | 1,811,155 | 2,842,921 | 4,233,393 | 3,456,738 | 3,894,060 | 2,847,700 | 3,048,716 | 4,585,170 | 3,835,602 | 1,999,841 | 1,999,806 | 1,999,803 | 857,234 | 41,248,816 |
NSR Average | $/tonne | 239.6 | 294.4 | 176.9 | 230.9 | 277.9 | 167.6 | 174.5 | 144.6 | 153.1 | 181.8 | 216.7 | 143.2 | 143.9 | 132.4 | 131.2 | 193.1 |
Waste Mined | tonnes | 18,667,073 | 42,492,137 | 53,437,454 | 53,069,144 | 52,087,219 | 53,427,786 | 53,138,782 | 54,534,253 | 54,404,466 | 48,128,724 | 25,561,736 | 689,677 | 690,240 | 496,367 | 5,421 | 510,830,479 |
Total Material Moved | tonnes | 20,000,232 | 44,995,656 | 55,248,609 | 55,912,065 | 56,320,612 | 56,884,524 | 57,032,842 | 57,381,953 | 57,453,183 | 52,713,894 | 29,397,338 | 2,689,518 | 2,690,046 | 2,496,170 | 862,655 | 552,079,295 |
AYA GOLD & SILVER INC.243
Figure 16‑31 Boumadine Life-Of-Mine Production Plan Breakdown by Mining Methods
Figure 16‑32 Boumadine LOM Production Plan Tonnes and NSR
AYA GOLD & SILVER INC. 244
16.9Electrical Underground Distribution
The electrical infrastructure for the Boumadine mine has been designed around a modular, relocatable concept that follows the development sequence. Power will be taken from the surface 22 kV overhead powerline network and stepped down at five surface substations, one serving each of the five underground portal areas (Portal 1 to Portal 5). Medium voltage (5.5 kV) will then be distributed underground to skid-mounted substations that supply 1,000 V power to the underground loads.
16.9.1Surface Electrical Infrastructure
Five surface substations will transform the incoming 22 kV supply to 5.5 kV. Three substations will be rated at 2 MVA (Portals 1, 2 and 5) and two at 1.5 MVA (Portals 3 and 4), for a total installed surface transformer capacity of 9 MVA. The substations will be fed from the surface 22 kV overhead powerline network, and each will be capable of supplying the underground ventilation fans and all underground levels within its portal area. Table 16-25 summarizes the surface substations.
All surface substations will be modular, housed in 40-ft high-cube containers, so that they can be relocated as required by the development sequence. All underground communication cabinets and devices will be installed in the same surface containers.
Table 16-25 Surface Substations by Portal
| | | | | | | | | | | |
| Portal | Transformation | Capacity (MVA) | Levels Served |
| Portal 1 | 22 kV – 5.5 kV | 2 | 27 |
| Portal 2 | 22 kV – 5.5 kV | 2 | 21 |
| Portal 3 | 22 kV – 5.5 kV | 1.5 | 18 |
| Portal 4 | 22 kV – 5.5 kV | 1.5 | 25 |
| Portal 5 | 22 kV – 5.5 kV | 2 | 30 |
| Total | | 9 | 121 |
One 5.5 kV feeder, using riser TECK cable, will be installed through each portal to supply the underground substations on the first levels. Once the ventilation raise is completed, a second 5.5 kV feeder will be installed through the raise to supply the lower levels.
16.9.2Emergency Power
A common modular diesel generator station will be installed near the surface substations to supply the underground emergency loads, including compressors, pumps and ventilation. The generator station grounding will be connected to the isolated grounding grid to maintain a constant fault level. Fuel storage capacity will be sufficient to supply the emergency loads for 24 hours.
16.9.3Underground Electrical Distribution
Junction boxes will be installed on each level to feed the underground main substations. The underground main substations will be installed at each main level and will provide 1,000 V power to underground loads such as pumps, ventilation and garages. The key design features of the underground distribution system are as follows:
•One 1 MVA, 5.5 kV – 1 kV underground substation is planned for every three levels;
•Substations are expected to be skid-mounted to allow ease of installation and relocation;
•All substation equipment will be located inside an electrical room excavation along the main ramp;
•As underground mine development progresses, some substations will be relocated from completed areas to newly developed zones.
AYA GOLD & SILVER INC. 245
16.9.4Communications
The mine will be provided with a fibre optic backbone and a private LTE (Long Term Evolution) wireless network to support all communications required to operate the mine and to transmit data within the mine and to surface. The communication infrastructure will support voice communications, PLC monitoring and control, video, operational data, and control and monitoring of the electrical network.
The fibre optic backbone will be installed from the surface control room through each portal and down the ramps and ventilation raises, with connections to the electrical substations and to each active level. It will carry all wired Ethernet/IP traffic and serve as the transport network for the LTE system. A surface LTE core and backbone will link the underground network to the site operations centre. The fibre backbone will be installed in a ring configuration where practical to provide redundancy and improved reliability.
LTE radio units will be installed along the ramps, level accesses and production drifts as development advances, and connected to the fibre backbone. The LTE network will provide high-bandwidth, low-latency wireless coverage for voice, data and video across the underground workings. The network will also be capable of supporting additional applications such as personnel and equipment tracking, real-time equipment telemetry, and tele-remote operation of mobile equipment. These applications are not included in the base case but may be implemented during operations, providing flexibility to improve productivity and safety without major changes to the communication infrastructure.
A dedicated blast line communication system will also be installed to support blasting operations.
16.9.5Electrical Infrastructure Unit Costs
The unit costs provided for the main electrical and communication infrastructure are summarized in Table 16-26. Quantities and total capital costs are addressed in the capital cost estimate.
Table 16-26 Electrical and Communication Infrastructure Unit Costs
| | | | | | | | |
| Item | Description | Unit Cost (US$) |
| Surface substation | 2 MVA, 22 kV – 5.5 kV | 600,000 |
| Surface substation | 1.5 MVA, 22 kV – 5.5 kV | 500,000 |
| Underground substation | 1 MVA, 4.16 kV – 1 kV, skid-mounted | 250,000 |
| Communication system | LTE | 500,000 |
| Blast line communication | Blast line communication system | 100,000 |
AYA GOLD & SILVER INC. 246
16.10Ventilation
This section of the report outlines the ventilation design and strategy for the Boumadine Project, based on the proposed mine layout, production schedule, and diesel equipment fleet. The design aims to ensure safe and efficient airflow distribution across all zones of the mine, while optimizing energy consumption and fan performance. Air flow rate is based on a diesel dilution rate of 0.06 m³/s/kW as per industry standard.
16.10.1Design Criteria
Other design criteria for ventilation are defined as follows:
•Maximum air velocity in ramps: 7 m/s
•Main fan pressure limit: 5000 Pa to avoid high pressures in return air raise system for safety and bulkhead design purposes to access the egress.
•Fan efficiency of main fans: 75%
•Fan efficiency of auxiliary fans: 80%
•Main fan electrical utilization rate: 80%.
•Motor efficiency: 95%
•Fan installation loss pressure: 625 Pa
•Heating or cooling of mine air is not required.
•Any open stopes are sealed with a ventilation curtain
•Optimize blast clearing times
•Leakage factor: 50 mm²/m² for auxiliary duct network
•Hydraulic resistance of closed regulator and personnel doors bulkheads: 15 N s2/m8
•When airflow is divided between two raises on a given zone, a 70/30% split is assumed for worst-case pressure balance.
•Electricity cost: $US 90/MWh
•Main fans operate 365 days/year, 24 hours/day
•Auxiliary fans operate 365 days/year, 24 hours/day with On/Off starters only
•Vertical mining cost of $US 1537/m plus 218/m3
16.10.2Ventilation Demand and Distribution
Ventilation demand is based on the number of equipment and utilization factor as shown in Table 16-27, specified before the addition of 15% leakage.
AYA GOLD & SILVER INC. 247
Table 16-27 Diesel equipment air demand
| | | | | | | | | | | | | | | | | | | | |
| Machine | Engine (kW) | m3/s/kW | Utilisation (%) | Airflow per unit, (m3/s) | No. of units | Total airflow (m3/s) |
| Drill DL311 | 74.6 | 0.06 | 25 | 1.1 | 3 | 3.4 |
| Jumbo | 74.6 | 0.06 | 25 | 1.1 | 9 | 10.1 |
| Scissor Paus | 111.9 | 0.06 | 50 | 3.4 | 9 | 30.2 |
| LHD 10t 1030 | 186.5 | 0.06 | 100 | 11.2 | 10 | 111.9 |
| Bolter Sandvik DS421 | 74.6 | 0.06 | 25 | 1.1 | 9 | 10.1 |
| Emulsion PAUS | 111.9 | 0.06 | 25 | 1.7 | 3 | 5.0 |
| Truck 33t MT436B | 298.4 | 0.06 | 100 | 17.9 | 6 | 107.4 |
| Subtotal 1 - Allocated to resources | | | | 278 |
| 111.9 | 0.06 | 25 | 1.7 | 1 | 1.7 |
| Transmixer | 111.9 | 0.06 | 50 | 3.4 | 3 | 10.1 |
| Boom truck Paus | 111.9 | 0.06 | 50 | 3.4 | 1 | 3.4 |
| Grader GR135 XCMG | 111.9 | 0.06 | 50 | 3.4 | 2 | 6.7 |
| Fuel Lube Paus | 111.9 | 0.06 | 50 | 3.4 | 1 | 3.4 |
| Water Truck Paus | 93.25 | 0.06 | 50 | 2.8 | 15 | 42.0 |
| Subtotal 2 - Distributed Proportionally to Resources | | | 67 |
Airflow is allocated to resources defined in Table 16-28. A production schedule from 2029 to 2044 specifies the number of resources in each zone. The remaining fleet air demand is distributed proportionally to the resource allocation, with an additional amount of 15% for leakage. The resulting peak airflow demand in each zone is shown in Table 16-29. The airflow demand for the life-of-mine by zone is shown in Figure 16-33.
Table 16-28 Task resource definitions
| | | | | | | | |
| Resource category | Resources assigned | Airflow, m3/s |
| Dev Horizontal Capex | 1 Jumbo 1 Scissor lift ½ LHD 1 Cable bolter ¼ LHD ¼ emulsion truck | 8.8 |
| Dev Horizontal Opex | 1 Jumbo 1 Scissor lift ½ LHD 1 Cable bolter ¼ LHD ¼ emulsion truck | 8.8 |
| Dev Vert | ½ LHD | 5.6 |
| Drilling | Production drill and compressors | 1.5 |
| Mucking | 1 LHD | 11.2 |
| Backfilling | 1 LHD | 11.2 |
| Haulage | 1 Truck and ¼ LHD | 20.7 |
AYA GOLD & SILVER INC. 248
Table 16-29 Peak airflow by zone, including 15% leakage
| | | | | | | | |
| Zone | Peak airflow (m3/s) | Start of production |
| Portal 1 | 255 | 2031 |
| Portal 2 | 95 | 2036 |
| Portal 3 | 133 | 2036 |
| Portal 4 | 226 | 2034 |
| Portal 5 | 285 | 2038 |
Figure 16-33 Life of mine airflow by zone Portal 1 to Portal 5
16.10.3Main Ventilation system Design
The main ventilation system design for all zones consists of the following:
•Fresh air will enter the mine via portal and dedicated intake raises
•Fresh air will descend via ramp to the levels
•Fresh air will be supplied to the working faces by auxiliary ducting and fans
•Exhaust air will enter dedicated return air raises by drop-board regulators
•Air will be exhausted from the mine by primary fans installed on surface.
This design was chosen to optimize blast clearing times. The drop board regulators are adjusted manually to supply enough air on each of the levels. When a level becomes inactive, the regulator is completely sealed.
AYA GOLD & SILVER INC. 249
Figure 16-34 Zones and locations of exhaust fans
The extent of the underground mining zones is pictured in Figure 16-34.
Zone South 1, pictured in Figure 16-35, features three fan installations which will be sized to exhaust, respectively, 50%, 75%, and 50% of the maximum air flow for the zone, that is 255 m3/s reached in year 2034.
Figure 16-35 Longitudinal view of South 1 zone showing three exhaust raises and three intakes
AYA GOLD & SILVER INC. 250
Figure 16-36 Longitudinal view of South 2 zone showing exhaust raise and intake portal
Zone South 2 will require a maximum of 95 m3/s, that will be provided by a single exhaust fan, shown in Figure 16-36.
Figure 16-37 Longitudinal view of South 3 zone showing three exhaust raises and three intakes
Zone South 3, pictured in Figure 16-37, features three fan installations which will be sized to exhaust, respectively, 100%, 35%, and 35% of the maximum air flow for the zone, that is 133 m3/s reached in year 2036.
AYA GOLD & SILVER INC. 251
Figure 16-38 Longitudinal view of Center (Portal 4) zone showing two exhaust raises and two intakes
Zone Center (Portal 4), pictured in Figure 16-38, features two fan installations which will be sized to exhaust, respectively, 50%, and 100% of the maximum air flow for the zone, that is 226 m3/s reached in year 2034.
Figure 16-39 Longitudinal view of North (Portal 5) zone showing four exhaust raises and four intakes
Zone North (Portal 5), pictured in Figure 16-39, features four fan installations which will be sized to exhaust, respectively, 70%, 70%, 40%, and 40% of the maximum air flow for the zone, that is 285 m3/s reached in year 2038.
Thirteen main fan installation locations are listed in Table 16-30. Some of the smaller fans may be specified by vendors as vertically mounted for reduced cost. Raises exhausting more than 150 m3/s of air will more likely be quoted for twin parallel horizontal fans.
AYA GOLD & SILVER INC. 252
Table 16-30 Main fan operating points and installation configuration
| | | | | | | | | | | | | | | | | | | | | | | |
| Portal | Fan | Maximum flow as % of zone | Max. airflow (m3/s) | Fan pressure (Pa) | Fan type | Combined power (kW) | Fans |
| Portal 1 | South 1.1 | 50 | 102 | 3000 | Surface horizontal | 500 | 1 |
| Portal 1 | South 1.2 | 75 | 179 | 3600 | Surface horizontal parallel arrangement | 900 | 2 |
| Portal 1 | South 2.1 | 50 | 102 | 2300 | Surface horizontal or vertical | 400 | 1 |
| Portal 2 | South 2.2 | 100 | 95 | 2200 | Surface horizontal or vertical | 300 | 1 |
| Portal 3 | South 3 | 100 | 133 | 2700 | Surface horizontal or vertical | 500 | 1 |
| Portal 3 | South 4.1 | 35 | 80 | 2300 | Surface horizontal or vertical | 250 | 1 |
| Portal 3 | South 4.2 | 35 | 80 | 2000 | Surface horizontal or vertical | 200 | 1 |
| Portal 4 | Center | 100 | 226 | 4300 | Surface horizontal parallel arrangement | 1300 | 2 |
| Portal 4 | South 5 | 50 | 113 | 3000 | Surface horizontal or vertical | 450 | 1 |
| Portal 5 | North 1 | 70 | 199 | 3200 | Surface horizontal parallel arrangement | 850 | 2 |
| Portal 5 | North 2 | 40 | 114 | 2400 | Surface horizontal or vertical | 400 | 1 |
| Portal 5 | North 3.1 | 40 | 114 | 2900 | Surface horizontal or vertical | 450 | 1 |
| Portal 5 | North 3.2 | 70 | 199 | 4500 | Surface horizontal parallel arrangement | 1200 | 2 |
Vertical raise sizing is based on prices for 3-m ($2,525/m) and 4-m ($3,000/m) diameter raise resulting in an variable cost of $1945/m and 83/m3. Raises to surface are raisebore specified up to 4.0 m diameter maximum to reduce ground control risk during excavation. All underground ventilation raises are drop raises at a maximum size of 4.5 × 4.5 m and minimum of 3.0 m x 3.0 m. The RAR system is also used as an egress using laddertube type. The laddertube is maintained open to minimize the impact on the hydraulic resistance of the RAR system. Double personnel doors are therefore installed in each of the bulkheads for egress purposes. A summary of vertical airways according to dimension and type of excavation is provided in Table 16-31.
Table 16-31 Summary of raises by dimensions and length
| | | | | | | | |
| Raise type | Total length, m | Total number of raises |
| Drop Raise 3.0x3.0 | 2261 | 113 |
| Drop Raise 3.5x3.5 | 461 | 23 |
| Drop Raise 4.0x4.0 | 1033 | 52 |
| Drop Raise 4.5x4.5 | 560 | 28 |
| Raisebore 3.0m | 1568 | 6 |
| Raisebore 3.65m | 1435 | 10 |
| Raisebore 4.0m | 1496 | 8 |
Main fan power costs are estimated in Table 16-32 assuming an average power utilization of 80% which is equivalent to an average speed reduction of 8%. Speed reductions are possible with the use of Variable Frequency Drives (VFDs).
AYA GOLD & SILVER INC. 253
Table 16-32 Energy Consumption of Main Fans
| | | | | | | | | | | | | | | | | | | | | | | | | | | | | | | | | | | | | | | | | | | | | | | |
| Zone | Fan power (kW) | Utilisation | 2031 | 2032 | 2033 | 2034 | 2035 | 2036 | 2037 | 2038 | 2039 | 2040 | 2041 | 2042 | 2043 |
| Portal 1 | 1800 | 80% | 1.1$ | 1.1$ | 1.1$ | 1.1$ | 1.1$ | 1.1$ | | | | | | | |
| Portal 2 | 300 | 80% | | | | | | | 0.2$ | 0.2$ | 0.2$ | 0.2$ | | | |
| Portal 3 | 950 | 80% | | | | | | 0.6$ | 0.6$ | 0.6$ | 0.6$ | | | | |
| Portal 4 | 1750 | 80% | | | | 1.1$ | 1.1$ | 1.1$ | 1.1$ | 1.1$ | 1.1$ | 1.1$ | 1.1$ | 1.1$ | |
| Portal 5 | 2900 | 80% | | | | | | | | 1.8$ | 1.8$ | 1.8$ | 1.8$ | 1.8$ | 1.8$ |
| Total, $M | | | 1.1$ | 1.1$ | 1.1$ | 2.2$ | 2.2$ | 2.8$ | 1.9$ | 3.7$ | 3.7$ | 3.1$ | 2.9$ | 2.9$ | 1.8$ |
| Annual MWh | | | 12,614 | 12,614 | 12,614 | 24,878 | 24,878 | 31,536 | 21,024 | 41,347 | 41,347 | 34,690 | 32,587 | 32,587 | 20,323 |
AYA GOLD & SILVER INC. 254
16.10.4Auxiliary Ventilation system Design
Auxiliary ventilation for production headings and ramp advance was sized using a duct leakage allowance of 50 mm²/m². Fan and motor efficiencies of 65% and 95%, respectively, were applied when establishing the required duty points. The assessment also accounts for the duct lengths associated with the planned advance rates and the geometry of the production levels.
16.10.4.1Ramp Development
Ramp headings will be ventilated through two 1.0-m-diameter flexible duct lines, each designed for runs of up to 800 m. Fresh air will be supplied from the main ventilation network, with return-air-raise (RAR) connections established at five-level intervals. Each duct system is equipped with a 200-kW auxiliary fan designed to deliver 37 m3/s while supporting the concurrent operation of a truck, LHD, bolter and pickup. When a new RAR connection becomes available, the fans and ducting will be advanced to the lower connection. The mine plan assumes that two ramp-development ventilation systems may operate simultaneously. A typical ramp-development arrangement is presented in Figure 16-40.
AYA GOLD & SILVER INC. 255
Figure 16-40 Auxiliary Ventilation on Ramp Development Zone Centre
16.10.4.2Production Levels
Ventilation on each active production level will be provided by a 150-kW main auxiliary fan, supplemented by a 15-kW fan serving secondary headings. Fresh-air quantities will be controlled at the level regulator to satisfy fan intake requirements, prevent recirculation and maintain adequate airflow to the other active levels. The design basis allocates 21 m³/s to the primary heading, where an LHD and truck may operate, and 10 m³/s. The lower airflow allowance applies to a secondary heading served by an LHD. Both circuits use 1.0-m-diameter flexible ducting, with representative lengths of 300 m for primary headings and 200 m for secondary headings. At the mine-wide peak, eleven levels are assumed to have fan installations: four operating, four available on standby and three supporting development. The duct-leakage allowance of 50 mm²/m² is included when determining fan pressure and the airflow delivered to the working face. A typical production-level ventilation arrangement is presented in Figure 16-41.

Figure 16-41 Auxiliary Ventilation on Production Levels Zone Centre
The combined annual energy cost of the production-level and ramp-development auxiliary fans is estimated at US$1.9 million per year, based on an electricity rate of US$90/MWh. The corresponding fan duties and energy calculations are summarized in Table 16-33.
Table 16-33 Energy Consumption of Auxiliary and Ramp Development Fans
| | | | | | | | | | | | | | | | | | | | |
| Airflow (m3/s) | Pressure (Pa) | Consumed power per fan (kW) | Average number of fans operating | Annual energy consumption (MWh) | Annual energy cost ($US) |
| Production level main auxiliary fan | 21 | 4117 | 140 | 11 | 13,491 | 1,214,234 |
| Production level secondary fan | 10 | 656 | 11 | 11 | 1,024 | 92,131 |
| Ramp development fan | 18.5 | 6364 | 191 | 4 | 6,681 | 601,273 |
| | | | Total | 21,196 | 1,907,638 |
The combined annual energy cost for auxiliary and main ventilation systems is estimated on average at $US 4.2 M/yr.
AYA GOLD & SILVER INC. 256
17.0RECOVERY METHODS
17.1Process Design
The process plant design for the Project is based on a conventional flotation flowsheet. Lead, zinc and pyrite concentrates will be recovered and sold to market.
The plant design criteria were selected to minimize operating costs and maximize the use of proven technology. The key criteria for equipment selection are suitability for duty, safety, reliability, and ease of maintenance.
17.1.1Selected Process
The process plant design comprises the following unit operations:
•Single stage primary crushing with a jaw crusher to produce an 80% Passing (P80) crushed product size of 136 mm.
•Crushed rock stockpile with a live capacity of approximately 8,115 tonnes to provide 24 hours of live storage. During extended periods of primary crusher equipment maintenance, additional crushed material inventory can be generated in the weeks leading up to the planned shutdown by dozing crushed material from this stockpile to the area adjacent to the stockpile. This material can then be reclaimed during the shutdown by front-end loader to feed the grinding circuit.
•SAB type grinding circuit consisting of a SAG mill and a ball mill to produce a ground product with a P80 of 58 microns (µm), with hydrocyclones for particle size classification.
•Lead rougher flotation, classification, regrinding and cleaner flotation to produce a lead concentrate of 29.6% grade. The lead concentrate will be thickened, filtered, and bagged prior to shipment.
•Zinc rougher flotation, classification, regrinding and cleaner flotation to produce a zinc concentrate of 57.4% grade. The zinc concentrate will be thickened and filtered for stockpiling prior to shipment.
•Pyrite rougher flotation to produce a pyrite concentrate with 4.2 Au g/t and 81.0 Ag g/t. The pyrite concentrate will be thickened and filtered for stockpiling prior to shipment.
•Tailings thickening and storage in a tailings management facility.
The unit operations incorporated in the selected process flowsheet are shown in Figures 17-1 and 17-2.
AYA GOLD & SILVER INC. 257
-+
Figure 17-1 Simplified Process Flowsheet
AYA GOLD & SILVER INC. 258
Figure 17-2 Simplified Process Flowsheet (Continued)
AYA GOLD & SILVER INC. 259
17.1.2Key Process Design Criteria
The key design criteria for the process plant are outlined in Table 17-1.
Table 17-1 Key Process Design Criteria
| | | | | | | | | | | |
| Criteria Description | Units | Nominal | Source |
| Plant Throughput | Mtpa | 2.92 | AGS |
| Life of Mine | y | 11 | AGS |
| Head Grade - Design | g/t Au | 3.15 | Testwork |
| g/t Ag | 105 | Testwork |
| % Pb | 0.92 | Testwork |
| % Zn | 1.87 | Testwork |
Flotation Recovery: •Pb to Pb Concentrate •Zn to Zn Concentrate •Au to Py Concentrate •Ag to Py Concentrate |
%
%
%
% |
82.0
74.7
71.4
41.4 |
Testwork
Testwork
Testwork
Testwork |
Concentrate Grades: •Pb grade in Pb Concentrate •Zn grade in Zn Concentrate •Au grade in Py Concentrate •Ag grade in Py Concentrate |
%
%
g/t
g/t |
29.6
57.4
4.2
81.0 |
Testwork
Testwork
Testwork
Testwork |
Reagent Addition1: •Zinc Sulphate (ZnSO4·7H2O) •Sodium-Diisobutyl Dithiophosphinate (Aerophine 3418A) •Methyl Isobutyl Carbinol (MIBC) •Copper Sulphate (CuSO4·5H2O) •Sodium Isopropyl Xanthate (SIPX) •Potassium Amyl Xanthate (PAX) •Sulphuric Acid (H2SO4) •Sodium Cyanide (NaCN) •Lime (@91% CaO) |
g/t
g/t
g/t
g/t
g/t
g/t
g/t
g/t
g/t |
360
22.5
106.3
225
32.5
300
1,000
120
2,350 |
Testwork
Testwork
Testwork
Testwork
Testwork
Testwork
Testwork
Testwork
Testwork |
| Crushing Plant Availability | % | 75 | Agreed |
| Milling and Flotation Circuit Availability | % | 91.3 | Agreed |
| Filtration Circuit Availability | % | 80 | Agreed |
| Crushing Work Index (CWi) | kWh/t | 10.2 | Assumption |
| Bond Ball Mill Work Index (BWi) | kWh/t | 13.1 | Testwork |
| SMC Axb | 0 | 46.2 | Assumption |
| Bond Abrasion Index (Ai) | 0 | 0.402 | Assumption |
Grind Size, P80 | µm | 58 | Testwork |
| Pb Flotation Conc. Mass Pull – Rougher / Cleaner | % | 9.7 / 2.6 | Testwork |
Pb Regrind Size, P80 | µm | 16 | Testwork |
| Pb Concentrate Thickener Solids Loading | t/h/m2 | 0.2 | Assumption |
| Zn Flotation Conc. Mass Pull – Rougher / Cleaner | % | 4.4 / 2.4 | Testwork |
Zn Regrind Size, P80 | µm | 15 | Testwork |
| Zn Concentrate Thickener Solids Loading | t/h/m2 | 0.2 | Assumption |
| Py Rougher Flotation Conc. Mass Pull | % | 53.5 | Testwork |
| Py Concentrate Thickener Solids Loading | t/h/m2 | 0.5 | Assumption |
| Flotation Tailings Thickener Solids Loading | t/h/m2 | 0.5 | Assumption |
| Tailings Disposal | - | Pumped to TSF (by others) | AGS |
AYA GOLD & SILVER INC. 260
17.2Process Plant Description
ROM material will be delivered to a local feed bin by a mine truck to feed the crushing plant. The crushed product will be stockpiled prior to feeding the grinding circuit, consisting of a SAG mill and a ball mill with hydrocyclones for particle size classification. The ground product will feed the lead rougher flotation conditioning tank, which will feed the lead rougher flotation cells. The lead rougher flotation concentrate will proceed to a classification and regrind circuit, while the tails will feed the zinc rougher flotation conditioning tanks. Following regrinding, the ground lead rougher concentrate will report to a lead cleaner flotation circuit, consisting of three cleaning stages and one cleaner-scavenger stage. The lead cleaner tailings will report to zinc rougher flotation, while the final lead cleaner concentrate will be thickened, filtered and bagged prior to shipment. The filtrate from the lead filter will circulate back to the lead concentrate thickener and the lead thickener overflow will report to the lead water circuit and any excess will report back to the process water pond.
The lead rougher tails and the lead first cleaner-scavenger tails will feed the zinc rougher flotation conditioning tank, which will feed the zinc rougher flotation cells. The zinc rougher flotation concentrate will proceed to a classification and regrind circuit, while the tails will feed the pyrite rougher flotation conditioning tanks. Following regrinding, the zinc rougher concentrate will report to a zinc cleaner flotation circuit, consisting of three cleaning stages and one cleaner-scavenger stage. The zinc cleaner-scavenger tailings will report to pyrite rougher flotation, while the third zinc cleaner concentrate will be thickened and filtered prior to stockpiling for truck loading and shipment. The filtrate from the zinc filter will circulate back to the zinc concentrate thickener and the zinc thickener overflow will report to the zinc water circuit and any excess will report back to the process water pond.
The zinc rougher tails and the zinc first cleaner-scavenger tails will feed the pyrite rougher flotation conditioning tank, which will feed the pyrite rougher flotation cells. The pyrite rougher flotation tailings will be thickened in a tailings thickener before getting pumped to the flotation tailings management facility. The flotation tailings thickener overflow will report to the process water pond. The pyrite concentrate will be thickened, filtered and stockpiled by a radial stacker from where it is loaded on trucks and shipped. The filtrate from the pyrite concentrate filter will report to the pyrite concentrate thickener, and the pyrite concentrate thickener overflow will report to the process water pond.
17.2.1Crushing Circuit
The crushing circuit will be fed through the ROM bin by direct tipping of the mine truck or reclaimed by a front-end loader. The ROM bin will be fitted with a static grizzly with an aperture size of 800x800 mm to prevent oversized rocks from entering the crusher. Oversized rocks will be crushed by a fixed rock breaker. The ROM bin will discharge onto an apron feeder that will feed a vibrating grizzly with an aperture size of 90 mm. The grizzly undersize will bypass the primary crusher to reduce wear on the crusher, while the grizzly oversize will directly feed the primary crusher. The primary crusher will be a 160 kW jaw crusher, and will crush the grizzly oversize at a rate of 444 dry t/h from an F80 of 501 mm to a P80 of 156 mm. The crushed rock will discharge onto the primary crusher discharge conveyor together with the grizzly undersize to feed the 24h live capacity crushed rock stockpile.
17.2.2Grinding Circuit
Crushed material will be reclaimed from the crushed rock stockpile by two apron feeders, which may be operated together or with one on standby. The apron feeders will discharge on to the SAG mill feed conveyor to feed the primary mill. Flotation reagents zinc sulphate, sodium cyanide and Aero 3418A will be added to the primary mill with process water to pre-condition the material and to achieve a target moisture level of 75 %w/w in the mill.
AYA GOLD & SILVER INC. 261
The primary mill will be a SAG mill with a diameter of 7.92 m and effective grinding length of 4.39 m. It will have a high-speed variable speed drive and installed motor power of 6.1 MW. It will be charged with forged steel balls with a maximum size of 125 mm, equipped with a grate discharge and a trommel screen. The trommel screen oversize will discharge into a scats bunker or onto one of two pebble transfer conveyors for recirculation back to the SAG mill via the SAG mill feed conveyor. The trommel screen undersize will discharge to the cyclone feed pump box. The trommel screen will be equipped with a spray water mechanism to improve screening efficiency.
The secondary mill will be a ball mill with a diameter of 6.10 m and an effective grinding length of 9.32 m. Process water will be fed to the mill to achieve a target moisture content of 75%. The ball mill will have a fixed speed drive with a wound round induction motor and liquid resistance starter. The installed motor power will be 6.1 MW. It will be charged with high-chromium steel balls with a maximum size of 50 mm, discharging by overflow and equipped with a trommel screen. The trommel screen oversize will discharge to a scats bunker, and the trommel screen undersize will discharge to the cyclone feed pump box. The trommel screen will be equipped with a spray water mechanism to improve screening efficiency.
The combined SAG and Ball Mill discharge will be pumped to the cyclones for classification from the cyclone feed pump box, targeting an overflow P80 of 58 µm. There will be a total of twelve installed cyclones with six duty and six standby. The cyclones will be operated at a pressure of 85 kPa(g) and are expected to have a nominal recirculation rate of 382%. The cyclone overflow will report to the lead rougher flotation circuit, and the underflow will feed the secondary mill.
17.2.3Lead Rougher Flotation Circuit
The cyclones’ overflow will gravitate to the lead rougher conditioning tank. Zinc sulphate, sodium cyanide and Aero 3418A will be fed to the agitated conditioning tank where the rougher feed will be conditioned for five minutes. The conditioned slurry will then feed the lead rougher flotation cells. The circuit will consist of a single train of six forced-air mechanical cells. Zinc sulphate, sodium cyanide, Aero 3418A, and MIBC will be added to the lead rougher cells to maximize lead recovery. The lead rougher flotation concentrate will report to the lead regrind and cleaner flotation circuits, while the tails will feed the zinc rougher flotation circuit.
17.2.4Lead Regrind Circuit
The lead rougher concentrate and the lead first cleaner-scavenger concentrate will report to the lead regrind cyclone pump box and will be pumped to the lead regrind cyclone cluster for classification and to increase the percent solids of the slurry feeding the regrind mill. The lead cyclone cluster will consist of sixteen cyclones in total, with 11 duty and 5 standby. The cyclones will be operated at a pressure of 64 kPa(g) and will target an overflow particle d50 of 21 µm. The lead regrind cyclones’ overflow will report directly to the lead cleaner flotation surge tank, while the underflow will gravitate to the lead regrind mill feed pump box before getting pumped to the lead regrind stirred media mill (SMM). The SMM will reduce the particle size from an F80 of 58 µm to a P80 of 16 µm. It will be charged with zirconia toughened alumina ceramic beads and will have an installed motor power of 1.6 MW. The SMM discharge will combine with the cyclone overflow in the lead cleaner flotation surge tank.
17.2.5Lead Cleaner Flotation Circuit
Zinc sulphate and sodium cyanide will be added to the lead cleaner flotation surge tank for conditioning ahead of flotation. The flotation feed will be conditioned for five minutes prior to feeding the first lead cleaner flotation circuit. The lead cleaner flotation circuit will consist of three cleaning stages and one cleaner-scavenger stage. The first cleaner stage will contain one train of four forced-air mechanical cells and all other stages will contain one train of three forced-air mechanical cells. MIBC will be added to each stage and Aero 3418A will be added to the second and third cleaner flotation circuits to promote lead recovery.
AYA GOLD & SILVER INC. 262
The concentrate and tails will travel through the circuit counter-currently. The lead first cleaner flotation concentrate will feed the lead second cleaner flotation cells, the lead second cleaner flotation concentrate will feed the lead third cleaner flotation cells, and the lead third cleaner flotation concentrate will feed the lead concentrate thickener. The lead third cleaner flotation tails will report to the lead second cleaner flotation cells, the lead second cleaner flotation tails will feed the lead first cleaner flotation cells, and the lead first cleaner flotation cell tails will feed the lead first cleaner-scavenger flotation cells. The lead first cleaner-scavenger flotation concentrate will be recirculated back to the lead regrind cyclone pump box, while the tails will report to the zinc rougher flotation conditioning tank with the lead rougher flotation tails.
17.2.6Lead Concentrate Thickening, Filtration, and Bagging Circuit
The lead third cleaner flotation concentrate will be pumped to the lead concentrate thickener, where flocculant will be added to the feed well to promote particle settling. The thickener will be high rate with a diameter of 11 m. The slurry will be thickened to 55% (w/w) solids in the underflow. The thickener overflow will report to the lead process water tank, while the thickener underflow will be pumped to the lead concentrate filter feed tank. The filter feed tank will be sized to hold 24 hours of feed slurry. The slurry will be pumped to a pressure filter to dewater the concentrate cake to 10% (w/w) moisture. The thickener and filter design criteria will be further defined upon the completion of dewatering testwork. The filtrate from the lead concentrate filter will be discharged to a filtrate tank and pumped back to the lead concentrate thickener, while the lead concentrate filter cake will be discharged via a belt feeder, bucket elevator and shuttle conveyor into lead concentrate hoppers. The hoppers will feed automatic bagging systems, with the bags transported and stacked by forklift prior to loading on highway trucks for shipment offsite.
17.2.7Zinc Rougher Flotation Circuit
The first zinc rougher conditioning tank will receive the lead rougher flotation tails and the lead first cleaner scavenger tails. Lime will be added to the first conditioning tank to achieve a target pH of 11.5, and the second conditioning tank will be dosed with additional lime and copper sulphate. The zinc rougher flotation feed will be conditioned in the agitated conditioning tanks for a total of 10 minutes – five minutes in each tank. The conditioned slurry from the second conditioning tank will feed the zinc rougher flotation cells. The circuit will consist of a single train of six forced-air mechanical cells. SIPX, lime and MIBC will be added to the zinc rougher cells to maximize zinc recovery. The zinc rougher flotation concentrate will report to the zinc regrind and cleaner flotation circuits, while the tails will feed the pyrite rougher flotation circuit.
17.2.8Zinc Regrind Circuit
The zinc rougher concentrate and the zinc first cleaner-scavenger concentrate will report to the zinc regrind cyclone pump box and will be pumped to the zinc regrind cyclone cluster for classification and to increase the percent solids of the feed entering the regrind mill. The zinc cyclone cluster will consist of eight cyclones in total, with 5 duty and 3 standby. The cyclones will be operated at a pressure of 81 kPa(g) and will target an overflow particle d50 of 20 µm. The zinc regrind cyclones overflow will report directly to the zinc cleaner flotation surge tank, while the underflow will gravitate to the zinc regrind mill feed pump box before being pumped to the zinc regrind stirred media mill (SMM). The SMM will reduce the particle size from an F80 of 58 microns to a P80 of 15 µm. It will be charged with zirconia toughened alumina ceramic beads and will have an installed motor power of 700 kW. The SMM discharge will combine with the cyclone overflow in the zinc cleaner flotation surge tank.
17.2.9Zinc Cleaner Flotation Circuit
SIPX and lime will be added to the zinc cleaner flotation surge tank for conditioning ahead of flotation. The flotation feed will be conditioned for five minutes prior to feeding the first zinc cleaner flotation circuit. The
AYA GOLD & SILVER INC. 263
zinc cleaner flotation circuit will consist of three cleaning stages and one cleaner-scavenger stage. Each stage will contain one train of three forced-air mechanical cells. MIBC will be added to each stage, SIPX will be added to the first cleaner-scavenger and the third cleaner, and lime will be added to the first through third cleaners to maximize zinc recovery.
The concentrate and tails will travel through the circuit counter-currently. The zinc first cleaner flotation concentrate will feed the zinc second cleaner flotation cells, the zinc second cleaner flotation concentrate will feed the zinc third cleaner flotation cells, and the zinc third cleaner flotation concentrate will feed the zinc concentrate thickener. The zinc third cleaner flotation tails will report to the zinc second cleaner flotation cells, the zinc second cleaner flotation tails will be recycled to the zinc first cleaner flotation cells, and the zinc first cleaner flotation cell tails will report to the zinc first cleaner-scavenger flotation cells. The zinc first cleaner-scavenger flotation concentrate will be recirculated back to the zinc regrind cyclone pump box, while the tails will report to the pyrite rougher flotation conditioning tank with the zinc rougher flotation tails.
17.2.10Zinc Concentrate Thickening and Filtration Circuit
The zinc third cleaner flotation concentrate will be pumped to the zinc concentrate thickener, where flocculant will be added to the feed well to promote particle settling. The slurry will be thickened in a 11 m diameter, high-rate thickener to 55% (w/w) solids in the underflow. The thickener overflow will report to the zinc process water tank, while the thickener underflow will be pumped to the zinc concentrate filter feed tank. The filter feed tank will be sized to hold 24 hours of feed slurry. The slurry will be pumped to a pressure filter to dewater the concentrate cake to 10% (w/w) moisture. The thickener and filter design criteria will be further defined upon the completion of dewatering testwork. The zinc concentrate filter filtrate will be discharged to filtrate tank and pumped back to the zinc concentrate thickener, while the zinc concentrate filter cake will be discharged to a stockpile in a covered shed prior to loadout. The zinc concentrate will be loaded into highway haulage trucks by a front-end loader for shipment offsite.
17.2.11Pyrite Rougher Flotation Circuit
The pyrite rougher flotation conditioning tank will receive the tails from the zinc rougher flotation and the zinc first cleaner-scavenger flotation. Sulphuric acid will be fed to the agitated conditioning tank to lower the pH between 7-8.5. The pyrite rougher feed will be conditioned for five minutes. The conditioned slurry will feed the pyrite rougher flotation cells. The circuit will consist of a single train of six forced-air mechanical cells. PAX and MIBC will be added to the pyrite rougher cells to maximize pyrite recovery. The pyrite rougher flotation concentrate will report to pyrite concentrate thickening and filtration, while the tails will report to the flotation tailings thickener.
17.2.12Pyrite Concentrate Thickening and Filtration Circuit
The pyrite rougher flotation concentrate will be pumped to the pyrite concentrate thickener, where flocculant will be added to the feed well to promote particle settling. The slurry will be thickened to 65% (w/w) solids in the underflow in a 32 m diameter high-rate thickener. The thickener design criteria will be further defined upon the completion of dewatering testwork. The thickener overflow will report to the process water pond, while the thickener underflow will be pumped to the pyrite concentrate filter feed tank. The filter feed tank will be sized to hold 24 hours of feed slurry. From the filter feed tank, the pyrite concentrate slurry is pumped to one of two parallel pressure filters to dewater the concentrate cake to 15% (w/w) moisture for stockpiling.
The filtrate from the pyrite concentrate filter will recirculate back to the pyrite concentrate thickener. The filter design criteria will be further defined upon the completion of dewatering testwork. The stockpile will be a radially stacked dead stockpile with a live capacity of 7,250 m3, holding approximately 24 hours of filtered pyrite concentrate. The pyrite concentrate will be loaded into highway haulage trucks by a front-end loader for shipment offsite.
AYA GOLD & SILVER INC. 264
17.2.13Flotation Tailings Disposal
The pyrite rougher flotation tails will be pumped to the flotation tails thickener, where flocculant will be added to the feed well to promote particle settling. The thickener will be a high-rate type with a diameter of 22 m. The slurry will be thickened to 40% (w/w) solids in the underflow. The thickener overflow will report to the process water pond, while the thickener underflow will be pumped to the flotation tailings management facility. It is estimated that 129 m3/h of water will be decanted from the flotation tailings management facility back to the process water pond. The thickener design criteria will be further defined upon the completion of dewatering testwork.
17.2.14Reagents
Plant operations will require a reagent inventory of flocculant, zinc sulphate, Aero 3418A, MIBC, copper sulphate, SIPX, PAX, sulphuric acid, sodium cyanide, lime, and anti-scalant. The site will maintain six weeks’ worth of supply of each reagent onsite in the reagent shed. All reagents will be dosed to their respective injection sites by metered dosing pumps (one per dosing site), except for lime and flocculant. Lime will be dosed by a centrifugal pump and flocculant will be dosed by helical screw pumps, with one per dosing application.
17.2.14.1Flocculant
Flocculant will be used in each of the thickeners to promote particle settling. It will be delivered to site as a solid powder in 750 kg bags. The bags will be split by a bag breaker and mixed for five hours with filtered process water. The mixing concentration will be 0.25% (w/v). The flocculant will be diluted in-line with process water to a concentration of 0.025% (w/v). The type and quantity of flocculant used will be further defined upon the completion of thickening testwork.
17.2.14.2Zinc Sulphate
Zinc sulphate is an activator in lead flotation. It will be fed to the SAG mill, lead rougher flotation and lead cleaner flotation feed. It will be delivered to site as a heptahydrate crystal in 1,000 kg bags at 98% purity. It will be diluted to 25% (w/v) concentration for dosage. Three bags will be required for the mixing of one batch, which is enough to supply 22 hours of operation.
17.2.14.3Aero 3418A
Aero 3418A will be used as a collector and promoter in lead flotation. It will be fed to the SAG mill, lead rougher flotation, the lead first cleaner and the lead first cleaner scavenger. It will be delivered to site and stored in 1 m3 IBC totes.
17.2.14.4MIBC
MIBC will be delivered as a liquid in 1 m3 IBC totes for usage as a frothing agent in all flotation circuits and stages.
17.2.14.5Copper Sulphate
Copper sulphate will be used as an activator in zinc rougher flotation. It will be fed to the second zinc conditioning tank. The copper sulphate will be delivered as solid pentahydrate crystals at 98% purity in 1,200 kg bulk bags. The copper sulphate will be diluted to 20% (w/v) for dosage. Two tonnes of crystals will be required per mix, which is enough to supply operations for 24 hours.
AYA GOLD & SILVER INC. 265
17.2.14.6Sodium Isopropyl Xanthate (SIPX)
SIPX will be used as a collector in zinc rougher and cleaner flotation. It will be fed to the zinc rougher, zinc regrind feed, zinc first and second cleaners, and the zinc first cleaner scavenger. SIPX will be delivered to site in 1,000 kg bulk bags as pellets with a purity of at least 90%. One tonne of material will be used per mix, through which the SIPX will be diluted to 10% (w/v). One mix will last for approximately three days of operation.
17.2.14.7Potassium Amyl Xanthate (PAX)
PAX will be used as a collector in the pyrite rougher flotation, fed directly to the rougher cells. PAX will be delivered to site in pellet format packed in 1,000 kg bulk bags, with a purity of at least 90%. Three tonnes of PAX will be mixed per makeup batch, which will dilute the reagent to 10% (w/v) and will last for 25 hours of operation.
17.2.14.8Sulphuric Acid
Sulphuric acid will be used for pH adjustment prior to pyrite flotation, fed to the pyrite conditioning tank. It will be delivered to site as a liquid in 1 m3 IBC totes with a purity of 98%. Three totes will be kept in the dosing area, which will be enough supply for 15 hours of operation.
17.2.14.9Sodium Cyanide
Sodium cyanide will be used in lead flotation and will be fed to the SAG mill, lead conditioning tank, lead rougher flotation cells and to the lead cleaner flotation surge tank. It will be delivered to site as solid briquettes packed in one-tonne bulk bags in boxes. The briquettes will be mixed at a rate of one tonne per batch, diluted to 20% (w/v). This will be sufficient supply for 22 hours of operation.
17.2.14.10Lime (CaO)
Lime will be used in zinc flotation and will be dosed to the zinc conditioning tanks, zinc rougher flotation, zinc cleaner flotation surge tank, and the first, second and third zinc cleaners. It will be delivered to site as a quicklime powder. It will be stored in a 150-tonne silo and slaked for dosage. The lime slurry will be prepared at a 20% (w/w) solids concentration. The storage tank will have a 24-hour residence time, and the dosage system will have a ring main for constant recirculation to prevent scaling. Lime will be delivered to site in full truckloads pneumatically offloading into the silo, requiring approximately one truckload per day.
17.2.14.11Anti-Scalant
Anti-scalant will be used to prevent process water scaling and will be dosed to the process water pond pump suction line. It will be delivered to site as a liquid in 1 m3 IBC totes. One tote will service approximately 3.6 days of operation.
17.2.15Plant Services
17.2.15.1Air
Plant and instrument air will be supplied from air compressors. The air will be dried before it is distributed to various air receivers and users.
AYA GOLD & SILVER INC. 266
17.2.15.2Water
Raw water will be sourced from the city sewage treatment effluent into a Raw Water Basin and transferred into a combined raw and fire water tank located in the process plant. Raw water will be used for gland service water, reagent mixing, dust suppression in the crushing circuit, process water makeup and the fire water reserve.
The main process water will be stored in a pond and will be supplied by thickener overflows, tailings management facility decant return, and raw water makeup. Separate lead and zinc process water tanks are fed from the lead and zinc concentrate thickeners respectively and used for the last cleaning and filter stages in each respective circuits to avoid contamination of the final products.
Potable water will be sourced from an aquifer and will be treated through an onsite treatment plant prior to use at the camp and in the operations facilities.
17.2.15.3Fuel
Plant mobile equipment will be powered by diesel, which will be stored onsite in a tanker and distributed to fueling stations.
17.3Plant Consumption
17.3.1Water
Nominal water consumption figures are provided in Table 17.3.1.
Table 17-2 Daily Water Consumption (Nominal)
| | | | | |
| Type | Daily Consumption (m3/d) |
| Raw Water | 2,997 |
| Potable Water | 128 |
17.3.2Energy
A breakdown of the estimated annual energy consumption for the process plant is provided in Table 17-3.
Table 17-3 Annual Energy Consumption
| | | | | |
| Area | Annual Energy Consumption (MWh/y) |
| Feed Preparation – Crushing & Stockpiling | 2,012 |
| Milling – Grinding & Classification | 93,487 |
| Flotation & Concentrate Handling | 36,512 |
| Tails Thickening & Handling | 2,701 |
| Reagents | 1,841 |
| Water Services | 2,692 |
| Air Services | 4,576 |
| Fuel Storage & Distribution | 102 |
| Water Supply, Sewage, TSF, Plant Infrastructure (Buildings & Offices) | 2,494 |
| Total | 172,396 |
17.3.3Reagents and Consumables
Annual consumption figures for each reagent and major consumables are shown in Table 17-4.
AYA GOLD & SILVER INC. 267
Table 17-4 Annual Consumption of Reagents and Consumables
| | | | | |
| Reagent | Annual Consumption1 (t/y) |
| Flocculant | 60 |
| Zinc Sulphate | 1,051 |
| Aero 3418A | 66 |
| MIBC | 310 |
| Copper Sulphate | 657 |
| SIPX | 95 |
| PAX | 876 |
| Sulphuric Acid | 2,920 |
| Sodium Cyanide | 350 |
| Lime | 6,862 |
| Anti-Scalant | 91 |
| Grinding Media – SAG Mill | 1,679 |
| Grinding Media – Ball Mill | 2,307 |
| Grinding Media – Regrind Mills | 59 |
1.Reagent consumptions are provided at supply concentration
AYA GOLD & SILVER INC. 268
18.0PROJECT INFRASTRUCTURE
18.1Overall Site Development
The overall site plan is shown in Figure 18-1 and includes major facilities of the Project, including the proposed open pit mines, underground mine, crushing and feed preparation facilities, flotation process plant, electrical substations, administrative buildings, and tailings facilities.
18.2Site Access Road
18.2.1Access to Site
The project site is located approximately 450 kilometers from the capital of Marrakesh, with the main access being via the National 10 highway. The N10 passes through the town of Tinejdad, which is connected to the mine site through an upgraded dirt road.
The Port of Agadir, approximately 600 km away, will enable the transportation of goods and products for shipping, with an expected truck round trip from the mine to the port and back taking about 24 hours. The Nador Beni Ansar Port, also located approximately 600 km away, can also be utilized. All ports are accessible via national highways.
18.2.2Project Site Roads
Internal roads will provide access between the open pits, underground portals, crushing facilities, process plant area, mine service areas, and tailings storage facilities. These roads will be six metres wide and constructed flush with bulk earthworks pads to facilitate stormwater management.
18.3Process Plant Facilities
The infrastructure will support mining, processing, and construction activities. Located north-east of the central zone open pit, the main site will host a ROM pad, crushing and feed preparation facilities, stockpile with live reclaim, processing plant operations, and a security and site office buildings. Open pit mines will operate independently but connect to the central site via haul roads and mine access roads. A portion of the mining activity will also be carried out through an underground portal.
AYA GOLD & SILVER INC. 269
Figure 18-1 Overall Site Plan
AYA GOLD & SILVER INC. 270
Figure 18-2 Process Plant Layout
AYA GOLD & SILVER INC. 271
Key infrastructure includes:
•Run of mine (ROM) pad.
•Crushing and feed preparation.
•Stockpile with reclaim chamber.
•Lead and zinc flotation plant.
•Lead and Zinc Concentration Handling
•Reagents Storage.
•Plant security and site office building.
•Plant administration and first aid building.
•Mine services area.
•Waste rock facility.
•Laboratory.
•Explosive magazine.
•Fuel and lubricant storage.
•Maintenance workshops and warehouse.
•Electrical Switchrooms.
Services provided cover power generation and distribution, water supply and distribution, surface water management, sewage and waste management, mine pit access, and haul roads. Portable / prefabricated structures will house security office and assay lab, while maintenance shops and warehousing will be brick and mortar buildings on concrete slabs.
Electrical Switchrooms will be located near areas of use.
Due to scarce water sources, an on-site water harvesting reservoir will be constructed near the process plant. A site water balance assessment will determine storage needs. A containerized water treatment system will ensure potable water availability for safety showers and personnel consumption.
Wastewater storage and treatment facilities will be established on-site. Solid waste, excluding domestic waste, will be managed off-site by licensed contractors, with on-site incineration for domestic waste. Dedicated areas for waste collection and sorting will facilitate disposal off-site, with no on-site long-term storage planned.
18.4Mining Facilities
18.4.1Truck Shop
A 1,000 m² truck shop will be adjacent to the ROM Pad for heavy equipment and light vehicles maintenance. There will be four bays dedicated to maintenance and one enclosed wash bay. All heavy equipment garage doors will be roll-type to maximize inside working space.
A 10-ton overhead crane equipped with two hooks will be installed in the heavy equipment maintenance area, while a single 5-ton overhead crane will cover the light vehicle area. Other maintenance equipment will be available for the workers, considering both the mining and the site maintenance fleets.
AYA GOLD & SILVER INC. 272
Various sections will be installed in the truck shop, including a tool crib, an oil and grease deposit with a carousel distribution system, a mechanical / electrical room, storage rooms, a foreman’s office, toilets, locker facilities, a lunchroom, and a meeting room.
Water on the shop floor will be collected to an oil separation system with an integrated coalescent filter to ensure efficiency even if emulsification occurs. A sand pre-separator is included in the wash bay.
18.4.2Site Roads
The haulage roads will be 20 m wide based on the mine trucks selected and will connect the open pits, the underground mine portals, the mineralized material stockpiles, the ROM pad and the waste rock stockpiles. The service roads to access ventilation raises and other mine services will be 10 m wide.
18.4.3Low-grade Material Stockpile
The low-grade mineralized material stockpile will be located near the ROM pad to allow for the deposition of low-grade material for eventual blending or mineralized material storage, should the crushing or process plant be shut down. The stockpiled material will be rehandled by a loader and will have a capacity of 3.5 Mt (1.7 Mm³), with a planned height of 5 meters. A more detailed design will be developed during the next phase of the project, to possibly increase the height of the stockpile.
In the absence of geochemical characterization results, it is assumed that material may be potentially acid-generating and/or leachable. Based on this, it is assumed that the mineralized material stockpile will require a foundation consisting of a 2 mm thick HDPE geomembrane with a 300 mm sand protection layer on each side. This assumption will be revisited at the next phase of the project.
Additionally, the stockpile will be located at least 60 meters from the surrounding watercourses and at least 50 meters from the open pit rim.
18.4.4Rom Pad
Mineralized material exceeding the cut-off grade and characterized as low grade material, as described in section 16.7.3, will be trucked and stored on the mill ROM pad. The material will be separated based on the NSR-Pyrite value into two stockpiles – low- and high-grade pyrite. The ROM will be sufficiently sized for the estimated LOM stockpile volume requirements.
The feed to the concentrator will be blended from the two stockpiles, and material will be fed into the crushing plant with a front-end loader.
18.4.5Waste Rock Stockpiles
Two waste rock stockpiles with a combined capacity of 187 million cubic meters (Mm³), equivalent to 504 million tonnes (Mt), are planned. The North waste rock stockpile will have a capacity of 130 Mm³ and will be required at the start of mining operations; however, its southern section is scheduled for construction later during ongoing operations. The South waste rock stockpile will have a capacity of 57 Mm³ and will receive waste rock from both the South pits and a portion of the Central pit.
Because a large portion of the waste rock will be used for backfilling in the underground mine, only 6 million tonnes will be added to the waste rock stockpile throughout the underground mining operations.
The design of the waste rock stockpiles will adhere to all relevant mining industry standards, utilizing conservative parameters at this stage due to the absence of geotechnical studies and geochemical characterization results. It is currently assumed that the stored waste rock could be potentially acid-generating and/or leachable. In this optic, it is assumed that each pile will require a foundation consisting of a
AYA GOLD & SILVER INC. 273
2 mm thick HDPE geomembrane with a 300 mm sand protection layer on both sides, or a similar design that would prevent potential contamination. This assumption will be revisited at the next phase of the project.
Additionally, each stockpile will be situated at least 60 meters from surrounding watercourses and 50 meters from the open pit rim.
The following design criteria were used for the waste rock stockpiles:
•Bench slope 2.5H: 1V
•Bench height: 10 m
•Berm width: 10 m
•Maximum height: 100 m
•Waste in-situ density: 2.75 t/m³
•Swelling factor: 1.36
18.5Tailings Storage Facility
Boumadine Global Mining SA has appointed Epoch Resources (Pty) Ltd (Epoch) to review and provide the Qualified Person’s signature for the update to the Pre-Economic Assessment (PEA) for a Flotation Tailings Storage Facility (TSF). A preliminary site selection study was completed in 2024 by an independent third-party Moroccan based consultancy, Groupement des Consultants et Ingénieurs de Maroc (GCIM) for two potential TSFs. The study design criteria have since been updated from two TSFs to only one Flotation TSF, with an updated storage capacity and tailings production rate based on the Life of Mine (LOM) production.
Boumadine Global Mining SA has appointed Epoch Resources (Pty) Ltd (Epoch) to review and provide the Qualified Person’s signature for the update to the Pre-Economic Assessment (PEA) for a Flotation Tailings Storage Facility. The history of the study is as follows:
•The study was initially completed in 2024 by an independent third-party Moroccan based consultancy, Groupement des Consultants et Ingénieurs de Maroc (GCIM) for two TSFs (Cyanide and Flotation).
•In 2025, the study design criteria have since been updated from two TSFs to only one Flotation TSF B2, with a doubled storage capacity and doubled tailings production rate for the same Life of Mine (LoM).
•In 2026, the study design criteria have since been updated for an increase in storage capacity of the one Flotation TSF B2, with an increased LoM.
A summary of the key design criteria for the TSF is summarized in Table 18-1 below.
Table 18-1 Design Criteria
| | | | | | | | | | | | | | | | | |
Item | Design Criteria | Flotation TSF (TSF B2) | Flotation TSF (TSF B2) Update 2025 | Flotation TSF (TSF B2) Update 2026 | Source / Comment |
| 1 | Tailings Annual Deposition Rate (Mtpa) | 0.86 | 1.65 | 1.64 | Aya |
| 2 | Life of Mine Storage (Years) | 11.0 | 11.3 | 14.5 | Aya |
| 3 | Total tonnage stored (Million) | 9.5 | 18.6 | 24.0 | Aya |
| 4 | Lining Requirement | Lined | Best Practice |
| 5 | Construction Methodology | Full Containment Walls | GISTM compliance |
AYA GOLD & SILVER INC. 274
The conceptual design for the preferred TSF site comprises the components that affect the major costs at a high level. The tailings will be deposited from a slurry pipeline into a lined basin, behind earth-fill downstream wall raises. Drainage measures are included along the upstream wall slope and within the basin. Outside of the TSF basin, storm diversion channels along the perimeter of the TSF and an emergency basin located downstream of the TSF manage storm events, and a return water basin receives water pumped from a floating barge on the TSF pool.
The key design changes entail updating quantities according to the revised dimensions of the TSF to accommodate the additional tonnage. The construction phasing in the 2025 study had five lifts. An additional sixth lift was included to accommodate the additional tonnage required by the revised design criteria.
18.6Water Supply
18.6.1Raw Water Supply System
Due to water scarcity, off-site water sourcing has been evaluated. This could be done by using treated wastewater from nearby communities. Three raw water lines will provide up to 4230 m3/d to the site, from the towns of Tinejdad, Goulmima and Tinghir. An on-site water treatment plant will be used to ensure that the water quality is acceptable for the process. The raw water will be stored in the on-site water harvesting reservoir prior to being transferred to the open top raw water tank for distribution.

Figure 18-3 Raw Water Sourcing
AYA GOLD & SILVER INC. 275
It is assumed that raw water will also be obtained from nearby boreholes and non-contact surface run-off water. A rainwater catchment pond will also harvest water for raw water usage and supplement in the flotation plant.
Raw water will be provided from the raw water tank for use as fire water. Feed to the potable water treatment plant and other users at the process plant will be sourced directly from boreholes and other non-contact water sources.
18.6.2Fire Water Supply System
Fire water will be piped to all main facilities via buried underground fire water ring mains around each of the facilities. The raw water tank live volume will hold a four-hour reserve of fire water equalling 288 m3. In addition, all buildings will be equipped with hose cabinets and supplemented with handheld fire extinguishers of two types - general purpose extinguishers for inside plant areas, and dry type extinguishers for inside electrical and control rooms.
18.6.3Potable Water Supply
The potable water treatment plant will be designed to local drinking water guidelines. The water treatment plant is expected to include multimedia filtration for reduction of turbidity, followed by ultraviolet disinfection for primary disinfection, and the addition of sodium hypochlorite for secondary disinfection. Treated potable water from the potable water treatment plant will be stored in the plant potable water tank and distributed via the plant potable water pump in a piping ring main to serve all potable water users in the process plant, heap leach, feed preparation and crushing facilities.
18.7Water Management
Studies and assessments required to complete a site wide water management will be done as part of the next phase of project.
18.8Power Supply
The Plant is estimated to have a Maximum Demand (running) of an estimated 26.3 MVA and a connected load of approximately 30.9 MVA. The main substation is sized at 40 MVA @ 65.75% load capacity.
Primary power to the Boumadine site will be provided by Office National de l'Electricité et de l'Eau Potable (ONEE) via a 220 kV high-voltage overhead transmission line. This newly constructed high-voltage overhead line will tee-off from the existing high-voltage overhead line that supplies power to the town of Tinejdad. The overhead line will connect to the main substation located north-east of the process plant. Power will be supplied to all areas of the site via the main 40 MVA substation.
18.9Sewage and Solid Waste Management
The project will utilize a modular sewage treatment plant based on a bio-oxidation process. Sewage and wastewater from various areas of site will be collected and transported to the plant via pump stations, strategically located to ensure efficient gravity flow. The plant will treat the water to the required environmental standards before being released into the environment. Solid waste will be periodically removed from the facility for off-site disposal.
AYA GOLD & SILVER INC. 276
18.10Security
The Process Plant site area will be surrounded by fencing and access shall be through a main gate located at plant north direction. A ‘Main Gate House’ at the entrance shall provide station to any security personnel with a more security resources stationed at the ‘Plant Security and Changehouse’ Building.
18.11Accommodations
Effort of local hiring will be made given the proximity of the nearby town of Tinejdad and reduce the need for onsite accommodation.
Offsite accommodation shall include 200 prefabricated rooms. Senior staff and expatriate employees will be accommodated in rental units in the town of Tinejdad.
A construction/ permanent camp of 200-300 people capacity will be setup to accommodate any on-site accommodation needs.
18.12Administration and Plant Buildings
Administration and Plant Buildings area will be situated at the plant north entrance. Administration area will include the following:
•Main gate House, Emergency Services / Clinic Building, Plant Security and Changehouse, Admin Building, Admin Mess, Project Office, Laboratory, Warehouse.
Plant area buildings, which are accessible after passing by the Plant Security and Changehouse, will include the following:
•Plant Office, Plant Mess, Plant Workshop.
Three Ablutions facilities are located between the Administration and Plant Buildings. One Ablutions facility will also be located inside the Process Plant area close to the ROM Pad.
18.13Concentrate Transportation and Loadout
The three concentrate products will be shipped by road to the port of Nador-West, located 641 km from Boumadine. The zinc and pyrite concentrates will be shipped in bulk, while the lead concentrate will be shipped in big bags. The road haulage of concentrate will be contractor operated, with transportation along national highways.
A concentrate handling facility will be located near or at the port of Nador-West. This facility will be covered and allow for approximately 250,000 t of storage capacity over a surface area of 13,500 m2.
AYA GOLD & SILVER INC. 277
19.0MARKET STUDIES AND CONTRACTS
19.1Market Studies
The commodities produced at Boumadine are gold, silver, zinc and lead, in the form of concentrates. The concentrates are sold under the terms of preliminary offers received and detailed in Section 19.2. As most of the value is contained in the gold and silver, AYA considered there were no need to carry out a proper market studies at this stage of the project.
19.2Commodity price projections
This study used the following prices for the different commodities:
•Gold: $3500/oz
•Silver: $50/oz
•Lead: $0.90/lbs
•Zinc: $1.37/lbs
Metals prices were kept constant for the entire life of mine plan of Boumadine.
19.3Contracts
19.3.1Concentrates sales
Aya Gold & Silver contacted several potential off-taker for the different concentrates that will be produced at Boumadine. Three different commodity traders have well received the request of interest sent by Aya Gold & Silver and have provided preliminary terms for off-take agreement for the purchase of the Lead-concentrate, Zinc-concentrate and Pyrite-concentrate of the Boumadine project. These terms are summarized as follows:
•Lead concentrate:
•Lead: payable at 95%, subject to a minimum deduction of 3 units
•Silver: payable at 95%, subject to a minimum deduction of 50 grams
•Gold: payable at 95%, subject to a minimum deduction of 1 gram
•Treatment charges: based on the annual Lead Asian Benchmark, with a $10/dmt in favor of the seller.
•Refining charges: for silver, based on annual benchmark, with $0.15 premium per Ag payable ounces in favor of the seller; for gold, $20 per gold payable ounces.
Penalty: for arsenic penalty, $2.5 for each 0.10% above 0.6% arsenic content in the lead concentrate
•Zinc concentrate:
•Zinc: payable at 85%, subject to a minimum deduction of 8 units
•Silver: deduction of 3 ounces, then payable at 70%
•Gold: deduction of 1 gram, then payable at 70%
AYA GOLD & SILVER INC. 278
•Treatment charges: based on annual Zinc Asian Benchmark, with a $15/dmt in favor of the seller.
•Refining charges: for silver, based on annual benchmark, with $0.15 premium per Ag payable ounces in favor of the seller; for gold, $20 per gold payable ounces.
•Penalty: for Arsenic penalty, $2.5 for each 0.10% above 0.6% arsenic content in the zinc concentrate; for Cadmium penalty, $2.5 for each 0.1% above 0.3% cadmium content in the zinc concentrate
•Pyrite concentrate:
•Gold: if the gold content is 2g/t in the pyrite concentrate, payable of 77%; if gold content is 3g/t in the pyrite concentrate, payable of 78%; and if the gold content is 4g/t in the pyrite concentrate, payable of 79%.
•Silver: payable of 78% if silver content is above 30 g/t in the each tonne of pyrite concentrate,
•Penalty: If the As content is less than 2.0% in the concentrate, there is no Arsenic Penalty
No refining charges for gold or silver in the Pyrite concentrate
19.3.2Other contracts
There are no other material contracts or agreements in place as of the effective date of this Report. AYA Gold & Silver has not hedged nor committed any of its production to an off-take agreement with any of the commodity traders that have expressed their interest to the Boumadine project.
AYA GOLD & SILVER INC. 279
20.0ENVIRONMENTAL STUDIES, PERMITS, AND SOCIAL
OR COMMUNITY IMPACTS
20.1Project Setting
The Project is located in the Drâa-Tafilalet region of western Morocco, with the planned mine site located approximately 19 km south of the nearest town of Tinejdad. The biophysical and social characteristics of the planned mining area are defined by its semi-arid climate and relatively rural and remote nature. Urban settlements are concentrated along main transport routes with villages located along valleys with access to water resources. Climatic conditions influence local ecosystems and land uses including agriculture, concentrated in areas of water availability.
20.2Environmental and Social Studies
Limited environmental studies have been completed in the past. As part of the environmental and social work currently being undertaken, an environmental baseline sampling program was initiated by BGM in September 2024 and a high-level screening for critical biodiversity habitat was undertaken by SLR in September 2024.
The baseline sampling, covering soils, air quality and water, was undertaken by AfriLabs, a Moroccan-based laboratory specializing in mineral and environmental analysis. Preliminary findings from the surveys and screening assessment reflect the following:
•Air Quality: Preliminary results indicate elevated particulate matter less than 10µm in diameter PM₁₀ and dust deposition levels, likely due to a combination of natural arid conditions and historical mining activities on site. Gaseous pollutants (NO2, SO2) were well below guideline thresholds.
•Water Resources: water resources are influenced by the semi-arid nature of the Project area. The Oued Akrouz, which crosses the area, is ephemeral but plays a key role in local irrigation feeding the Barrage d’Akrouz and acting as a pathway for aquifer recharge. Several wells are located along the valley of the Oued supplying local villages and farmers with domestic and irrigation water. Preliminary results indicate background water quality in the wells around the douars, , with some elevated concentrations of metals and metalloids reflecting the local geology and geochemistry. In the area of historical mining activities, water in the old shafts reflect the local mineralized geology with high acidity and elevated concentrations of some metals, metalloids, and major ion compared to the background groundwater quality from the irrigation well samples..
•Soils and Sediments: Background soil samples, i.e. soil samples which are distant from the area of historical mining activities on site, show some differences in chemical composition compared to the soil and sediment samples on site. Preliminary results of all samples indicate elevated levels of heavy metals and trace elements related to the local geology and geochemistry, and in some instances due to historical mining activities. While the survey included a preliminary review of the suitability of the soil for agriculture, environmental factors such as rainfall and evaporation / evapotranspiration, are probably the key limiting factors on soil use for agriculture in the local area.
•Biodiversity: most of the survey area includes a varying terrain of hills, small mountains and rocky outcrops all sparsely vegetated with a low density of plant cover. Preliminary flora and fauna surveys have identified the potential for some species of importance to occur on site. This will be confirmed through detailed seasonal surveys. The closest protected area to the Project is the Aferdou (El Kheng) Biological Reserve located 35km northeast of the site. While the Project site falls within an internationally recognised area, the Oasis du Sud Marocain Biosphere Reserve, the core zone of this reserve is located
AYA GOLD & SILVER INC. 280
approximately 200km west of the Project site. Further engagement is required during the ESIA to better understand the biosphere reserve and any requirements for the ESIA and Project.
Additional baseline surveys have been completed during the course of 2026 covering social, biodiversity, soil, water, air quality and noise. The results will be used to inform the international ESIA process outlined below. Studies covering the topics of biodiversity, hydrology, hydrogeology, soils and sediments, air quality, noise, GHG, climate change, stakeholder engagement, labour and working conditions, community health and safety, and other social elements are ongoing.
20.3Permitting and Applicable Standards
The Project will require national permits to support the development of the mine and the requirement to carry out an Environmental Impact Assessment (EIA) under Moroccan Law. The EIA under Moroccan Law, prepared by NOVEC, was completed and submitted in July 2026 to the “Centre Régional d'Investissement” (CRI) (Regional Investment Center), the regional administrative body responsible for deciding on the environmental acceptability of the Project based on the EIA. The CRI review process, which includes a three-week public consultation period, is underway, and a decision on the environmental acceptability of the Project is expected before the end of 2026.
In addition to meeting national permitting requirements, the Project is being undertaken to meet international ESIA lender standards.
In this regard, applicable standards that will be applied to the ESIA preparation include:
•The existing legal framework in Morocco with respect to environmental protection, EIA processes, sustainable development, climate change, water management, soil protection, waste management, landfill management, oil management, energy efficiency, air quality, pollution prevention and control, biodiversity protection and conservation, cultural heritage protection, property expropriation, mining, labour and working conditions, and occupational health and safety, as well as any regulation that may influence the content of the ESMP measures either for construction or operation;
•The Lenders policies, including the 2024 EBRD Environmental and Social Policy and supporting E&S Requirements, the 2012 IFC Performance Standards, and the World Bank Group Environmental, Safety, and Health Guidelines (general and sector-specific guidelines), and supporting good practice E&S reference documents; and
•The relevant AYA corporate policies, sustainability framework and requirements.
20.4Key Environmental and Social Issues
20.4.1Potentially Affected Communities
Available preliminary information on potential project affected persons reflects a site with no permanent settlement identified within the planned mine footprint, within an area that, in general, is sparsely populated. The surrounding landscape is used for grazing, livestock movement and access to water and other natural resources. Villages are located mainly, along the valleys of the wadis where there is access to water resources and related livelihoods such as date and olive farming, and livestock. The closest settlements to the planned mine site are the downstream villages and farms located along the Oued Akrouz; the nearest is the village and farms of Bouydoud, about 1.5km to the northeast. Farming is primarily subsistence and/or supplies local markets. To the southwest and west, the villages and farms situated in the adjacent valley, along the Oued Taghoucht, lie approximately 7.5 km from the planned mine site. Similarly, associated farms are for
AYA GOLD & SILVER INC. 281
subsistence and/or local markets. With the allocation of land plots and the establishment of the Taghoucht) Reservoir occupation and farming in this area may increase over time. Existing roads and tracks providing access to the planned mine site are used by local residents, farmers and herders. No villages or farms are located along the planned access road.
Nomadic and semi-nomadic herders seasonally use parts of the wider Project area for grazing, livestock passage, temporary camps and access to water points. The location and intensity of this use vary according to rainfall, pasture availability and water availability.
The planned mine footprint is located outside irrigated oasis areas, on land historically characterised by collective tenure and agro-pastoral use. The Project powerline and water-supply pipeline corridors extend across a broader landscape that include agricultural plots, grazing areas, livestock routes, access tracks, water points, wadis and areas subject to seasonal and/or temporary pastoral use. However, the precise tenure status and formal or customary land-use rights within the Project footprint remain to be confirmed. The land acquisition for the Project facilities is expected to be done through a long-term lease of the required area, with initial discussions underway with local authorities. A decision is expected before the end of 2026.
Social baseline surveys conducted during 2026 will be used to inform the social impact assessment undertaken as part of the ESIA.
20.4.2Environmental and Social Management
As part of the ESIA, potential impacts associated with the Project will be identified and assessed in a systematic approach. The impact assessment will inform a comprehensive Environmental and Social Management and Monitoring Plan to be developed for the Project. It will include:
•Mitigation measures for construction, operations and decommissioning
•Framework management plans covering biodiversity, erosion and sediments, waste, air and noise, water, community health and safety, community development and investment, supply chain, cultural heritage, rehabilitation and closure
•Stakeholder engagement plan including grievance management
•Monitoring plans for Project performance and the receiving environment (water, air, noise and biodiversity) including social aspects
Water management planning will continue to include the following elements:
•Characterization of the groundwater systems on site
•Environmental testwork to understand the geochemical composition and acid generating potential of the host rock and mineral residues
•Development of a site-wide climatic water balance to understand the water circuit and confirm water use, storage and discharge volume requirements.
•Establishment of an engineered stormwater runoff system catering for the diversion of clean water runoff around Project sites, separation of clean and potentially dirty water runoff on site, storage of potentially dirty water runoff in appropriately designed and engineered facilities, and collection and re-use of potentially dirty water runoff.
•Flood protection analysis and measures, if needed.
•Prioritizing water reuse and recycling.
•Water treatment for potable water supply, raw water supply, and discharge to the environment (if discharge is required).
AYA GOLD & SILVER INC. 282
20.4.3Mine Closure
A conceptual mine closure plan governed by Aya’s Environmental Policy will be prepared as part of the ESIA.
AYA GOLD & SILVER INC. 283
21.0CAPITAL AND OPERATING COSTS
21.1Capital Cost Estimate
21.1.1Summary
The capital cost estimates for the Boumadine Project PEA was compiled by Lycopodium and is presented here in summary format. The capital cost estimate reflects the Project scope as described in this report.
All costs are expressed in United States Dollars (US$) unless otherwise stated.The capital cost estimate was developed in Q3 2025 and escalated to Q3 2026 pricing and deemed to have an overall accuracy of +50%/-30%. The capital cost estimate conforms to AACE International (Association for the Advancement of Cost Engineering) Class 5 estimate standards.
The capital estimate for the Project is summarized in Table 21-1 by the major cost elements.
Table 21-1 Capital Estimate Summary
| | | | | | | | | | | |
| Capital Expenditures ($M) | Initial | Sustaining | Total |
| Direct Costs | 299 | 507 | 806 |
| Open Pit Mining | 52 | 59 | 112 |
| Underground Mining | - | 407 | 407 |
| Processing Plant | 175 | - | 175 |
| Shipping Infrastructure | 11 | - | 11 |
| Electrical Line | 18 | - | 18 |
| Raw Water Supply | 33 | - | 33 |
| Tailings Storage Facility | 9 | 30 | 40 |
| TSF Closure Costs | - | 11 | 11 |
| Indirect Costs | 65 | - | 65 |
| Subtotal | 364 | 507 | 871 |
| Contingency | 99 | - | 99 |
| Total | 463 | 507 | 970 |
The following exchange rates have been used in the compilation of the estimate:
Table 21-2 Currency Exchange Rate
| | | | | |
| Currency | USD |
| AUD | 0.65 |
| USD | 1 |
| GBP | 1.35 |
| Euro | 1.15 |
| Rand | 0.06 |
| CAD | 0.72 |
The capital cost estimate is broken down into mining capex, process plant and infrastructure capex, and tailings facility.
AYA GOLD & SILVER INC. 284
21.1.2Mining Capex
All costs are reported in 2025 USD unless otherwise specified and conversion rates used as per Table 21-2. Escalation of 3% has been applied to estimates from prior years where required. Contingency is excluded from this estimate and will be applied separately.
Capital costs for mining activities include:
•General surface infrastructure – Roads, electrical distribution and other surface facilities.
•Open Pit facilities – Mineralized material and waste stockpiles
•Underground development – Lateral and vertical
•Underground mobile equipment – Acquisition and sustaining costs
•Underground mine infrastructure – Ventilation, electrical facilities, dewatering and facilities
Equipment costs for open-pit mobile equipment are included in the contractor mining cost. No equipment is forecast to be purchased by the owner. Other than the first year of mining, all waste mining costs for the open-pit operations are classified as an operating cost . A portion of these costs could eventually be reclassified as capital stripping at a later phase. First year mining costs have been capitalized.
A summary of the capital costs is shown in Figure 21-1 and Table 21-3.
Figure 21-1 Capital Cost Summary – Mining
Table 21-3 Capital Cost Estimate - Mining
| | | | | |
| Area | $M |
| UG Capital Development - Lateral | 263.9 |
| UG Capital Development - Vertical | 36.9 |
| UG Mobile Equipment - Acquisition | 35.9 |
| UG Mobile Equipment - Sustaining | 22.8 |
AYA GOLD & SILVER INC. 285
| | | | | |
| General Infrastructure | 10.4 |
| Open Pit Infrastructure | 56.5 |
| Underground Infrastructure | 47.0 |
| Capitalized OP Mining Costs (Y1) | 44.8 |
| Total | 518.2 |
21.1.2.1General Surface Infrastructure
Surface facilities include roads, electrical distribution, and a truck shop. Costs are summarized in Table 2.
The plan includes 10 km of site roads and 2 km of service roads, with respective unit costs of $252,000/km and $84,000/km. Site roads are 20 m wide, while the service road linking the ventilation raise to the plant is 10 m wide. Electrical distribution will cover the total road length of 12 km at a unit cost of $95,000/km.
The truck shop has an estimated cost of $4.9 M. This includes three service bays as well as auxiliary bays, office space and a warehouse.
Table 21-4 General Facilities Cost
| | | | | |
| Area | $M |
| Site Road | 2.5 |
| Service Road | 0.1 |
| Electrical Distribution | 2.9 |
| Surface Facilities | 4.9 |
| Total | 10.4 |
21.1.2.2Open Pit Facilities
Open pit mining will be performed by a contractor, who will provide and maintain all equipment and materials required.
Construction of mineralized material and waste stockpile facilities is included in the OP estimate. Stockpiles assume that geomembrane is required throughout; this requirement may be reduced at a later date as a result of further environmental testing. No clearing is required due to lack of vegetation.
Unit costs include surface preparation, foundations, and construction costs. Construction of waste stockpiles will be distributed over the mine life according to the production plan. Costs are summarized in Table 21-5.
Table 21-5 Open Pit Facilities Cost
| | | | | | | | | | | |
| Area | m2 | $/m2 | $M |
| Mineralised Material Stockpiles | 370,000 | 13.00 | 4.8 |
| Waste Stockpiles | 4,920,509 | 10.51 | 51.7 |
| Total | | | 56.5 |
21.1.2.3Underground Development
All underground development is forecast to be completed by a contractor. An average unit cost of $2,500 was provided by Aya for this estimate, based on current contracts. This applies to ramp and lateral development and includes all labour, materials and equipment.
A vertical cost of $1,800/m was estimated for vertical development. This assumes a mix of 3-meter diameter raisebores and drop raises. Raisebores will be used in egress raises and raises from surface. Drop raises will be used in all other raises. An allowance of $1,900/m was added for SafeScape in required egress raises.
AYA GOLD & SILVER INC. 286
Table 21-6 summarises the underground development costs.
Table 21-6 Underground Development Cost
| | | | | |
| Area | $M |
| Ramp | 145.7 |
| Lateral Development | 118.2 |
| Vertical Development | 37.4 |
| Total | 301.3 |
21.1.2.4Underground Mobile Equipment
Underground mobile equipment is included for all production activities. Mine development is expected to be completed by the contractor who will provide all required equipment.
Recent quotes were provided by Aya for most of the mobile equipment costs. Quotes for similar recent projects were used to estimate costs for the remaining equipment.
Pickup trucks are assumed to be replaced after the useful life of 5 years. An overhaul of 50% of the initial acquisition cost was included for all other equipment at mid-life. Equipment exceeding useful life was replaced at initial cost.
Table 21-7 summarizes the parameters used to develop the mobile equipment estimate.
Table 21-7 Mobile Equipment
| | | | | | | | | | | | | | |
Activity | Quantity | Unit price | Life Years | Sustaining |
| Jumbo Drill | 6 | $931,000 | 12 | $465,500 |
| Production Drill | 4 | $931,000 | 12 | $465,500 |
| Mobile Compressors for Drill | 4 | $113,000 | 12 | $56,500 |
| Emulsion Charger | 3 | $373,000 | 8 | $186,500 |
| 30-tonne Mine Truck | 10 | $720,000 | 9 | $360,000 |
| 10-tonne LHD 10 t | 12 | $634,000 | 9 | $317,000 |
| Bolter | 7 | $817,000 | 12 | $408,500 |
| Transmixer | 2 | $343,000 | 9 | $171,500 |
| Scissor Lift | 3 | $188,000 | 8 | $94,000 |
| Boom Truck | 5 | $363,000 | 7 | $181,500 |
| Grader | 1 | $96,000 | 15 | $48,000 |
| Fuel Lube Truck | 1 | $287,000 | 8 | $143,500 |
| Water Truck | 1 | $287,000 | 8 | $143,500 |
| Pickup Truck | 15 | $44,000 | 5 | REPLACE |
| Mine rescue Truck | 1 | $93,000 | 16 | $46,500 |
Total - Mine Life | | $35,896,000 | | $22,762,000 |
21.1.2.5Underground Mine Facilities
Underground facilities costs include egress, ventilation, electrical, dewatering, and rock passes. The estimate is summarised in Table 21-8.
Table 21-8 Underground Facilities Cost
| | | | | |
| Area | $M |
| Ventilation – Main Fans | 31.4 |
| Ventilation – Auxiliary Fans | 1.2 |
AYA GOLD & SILVER INC. 287
| | | | | |
| Ventilation – Mercaptan | 0.1 |
| Electrical Stations | 14.3 |
| Total | 49.0 |
Main fans costs have been assumed based on existing quotes for similar projects in Europe and Canada, the cost includes the Electrical substation, the fan with dampers and accessories, mechanical and electrical installation, 15% of material cost to account for freight and civil works. In total there are nine different fan system, one for each zone, the total cost for each fan is shown in the Table 21-9 below.
Table 21-9 Main fans cost
| | | | | |
Ventilation Zone | $M |
| North 1.1 & 1.2 | 1.9 |
| North 2 | 3.3 |
| North 3.1 | 1.3 |
| North 3.2 | 1.3 |
| Center | 4 |
| South 5 | 1.9 |
| South 4.1 | 1.3 |
| South 4.2 | 1.3 |
| South 3 | 2.6 |
| South 2.1 | 3.3 |
| South 2.2 | 3.3 |
| South 1.1 | 3 |
| South 1.2 | 3 |
Total | 31.4 |
Auxiliary fans cost has been estimated based assuming a total of 27 fans are required initially at the start of the project, 22 for the production levels (two (2) per level) and five (5) for the ramp development. It then includes an allowance of 20% for spares per year.
Underground bulkheads with drop board regulators and double personnel doors for egress have not been included in the cost and need to be included in the next phase of the project.
A mercaptan system is included for all surface raises at a unit cost of $26,000, based on a quote for a similar project.
The estimated surface infrastructure costs are $2.9M, including the surface substation, LTE backbone and diesel generator sets. Underground infrastructure is estimated at $14.3M, including underground substations and distribution of power and communications.
21.1.3Process Plant and Infrastructure Capex
The Table 21-10 below shows the Capital cost breakdown of the Process Plant and Infrastructure.
Table 21-10 Process Plant and Infrastructure Capital Cost Breakdown
| | | | | | | | | | | | | | | | | | | | | | | |
| Process Plant Main Areas | Supply Cost | Installation Hours | Labour Installation Cost | Freight Cost | Subtotal Cost | Project Contingency | Project Total |
| 000 Construction Distributables | 3,886,500 | 5,000 | 198,620 | - | 4,085,120 | 1,021,280 | 5,106,400 |
AYA GOLD & SILVER INC. 288
| | | | | | | | | | | | | | | | | | | | | | | |
| 100 Treatment Plant Cost | 89,252,329 | 1,243,741 | 31,605,949 | 12,470,446 | 133,328,724 | 36,760,703 | 170,089,427 |
| 200 Reagents & Plant Services | 11,506,610 | 138,552 | 3,680,704 | 1,595,996 | 16,783,311 | 4,791,217 | 21,574,527 |
| 300 Infrastructure | 10,063,976 | 81,544 | 1,132,876 | 1,249,289 | 12,446,141 | 4,584,031 | 17,030,173 |
| 500 Management Costs | 19,965,140 | 49,913 | - | - | 19,965,140 | 4,991,285 | 24,956,425 |
| 600 Owners Project Costs | 41,327,536 | 397,295 | - | 603,028 | 41,930,564 | 10,482,641 | 52,413,205 |
| Infrastructure |
| Shipping Infrastructure | - | - | - | - | 10,870,368 | 5,435,184 | 16,305,552 |
| Electrical Line | - | - | - | - | 17,204,211 | 4,301,053 | 21,505,264 |
| Raw Water Supply | - | - | - | - | 30,426,944 | 7,606,736 | 38,570,522 |
| Grand Total | 176,002,091 | 1,916,045 | 36,618,149 | 15,918,760 | 290,416,546 | 80,954,015 | 385,929,069 |
21.1.3.1Estimating Methodology
Engineering lists, general arrangement drawings and a layout 2D model have been produced with sufficient detail to permit the assessment of the engineering quantities for concrete, steelwork, mechanical and electrical for the process plant and associated infrastructure. Quantities have also been benchmarked against similar flowsheet and throughput executed Lycopodium projects.
The unit rates and labour rates are based on historical in-house information or budgetary quoted and reflect current project market conditions. Budget pricing for major mechanical equipment was obtained from suitable, reputable suppliers and contractors.
21.1.3.2Quantity Development
The Project works were quantified to represent the defined scope of work and to enable the application of rates to determine costs.
Quantity information was derived from a combination of sources and categorized to reflect the maturity of design information as follows:
•Material Take Offs: detailed quantities derived from drawings and Naviswork model of Boumadine.
•Estimated: includes quantities derived from sketches or redline mark-ups of previous project drawings/data by estimating or similar projects.
•Factored: quantities derived from percentages applied as a factor based on experience or similar projects.
•Allowance: lump sum added to the cost estimate to account for costs that are certain to occur, but they cannot be identified with any accuracy.
The derivation of quantities is provided in Table 21-4 below, weighted by value of the direct permanent works (i.e. excluding temporary works, construction services, commissioning assistance, engineering costs, escalation and contingency).
AYA GOLD & SILVER INC. 289
Table 21-11 Derivation of Quantities
| | | | | | | | |
| Classification | MTO Prepared | Factored |
| Earthwork | | 1 |
| Concrete | | 1 |
| Structural Steel | | 1 |
| Platework | | 1 |
| Mechanical Equipment | 1 | 0 |
| Process Piping | | 1 |
| Overland Piping | | 1 |
| Electrical Bulks | | 1 |
| Electrical Equipment | | 1 |
| Instrumentation and Control | | 1 |
| Buildings | | 1 |
The table below identifies the sourcing of costs included in the estimate.
Table 21-12 Supply Cost Source
| | | | | | | | | | | |
| Classification | Total Supply Cost | Estimated / Historical Pricing | Budgetary Quote |
| F Mechanical | 62,871,233 | 0.48 | 0.52 |
21.1.3.3Installation Basis
This component represents the cost to install the plant equipment and bulk materials on site or to perform site activities. Installation costs are further divided between direct labour, equipment and construction indirect costs.
The labour component reflects the cost of the direct workforce required to construct the Project scope. The labour cost is the product of the estimated work hours spent on site multiplied by the cost of labour, inclusive of overtime premiums, statutory overheads, and payroll burden.
The equipment component reflects the cost of the construction equipment and running costs required to construct the Project. The equipment cost also includes cranes, vehicles, small tools, consumables, and Personal Protective Equipment (PPE).
The installation of the mechanical equipment has been built up using historical data of similar projects. The other disciplines installation costs were estimated as a percentage of mechanical costs and validated against historical data from similar projects.
21.1.3.4Field Indirects
Construction indirect costs encompass the remaining cost of installation and include items such as offsite management, onsite staff and supervision above trade level, crane drivers, equipment and labour mobilization and demobilization.
Construction indirect costs for all direct labour is included for all works in the capital estimate. This is inclusive of PPE, travel and clothing. Earthworks rates are inclusive of fuel, maintenance and running costs of machinery. Construction equipment and project cranes are included in the capital cost estimate.
Field In-directs costs have been calculated based on a percentage of direct installation cost. The percentage applied is derived from similar projects.
AYA GOLD & SILVER INC. 290
21.1.3.5Engineering Services
The estimate for engineering design and construction management services was factored based on previous Lycopodium experience for similar sized projects and based on an allowance typical for projects of similar size and nature.
21.1.3.6Vendor Representatives
Some equipment will require vendor representation during construction and or commissioning. A provision has been included in the estimate to cover the vendor representatives’ services, including mob/demob and site expenses. It is based on an allowance typical for projects of similar size and nature.
21.1.3.7Freight
The freight estimate was derived from the following:
•By calculation as a percentage of supply costs for items where freight tonnes and bulk volumes are yet to be determined.
•By benchmarking against similar projects.
21.1.3.8Owners Costs
A summary of the Owners costs is given below based on estimates. A total cost, including contingency is shown to be $55.03M. This includes some general costs, Plant and Admin Pre-Production, Spare Parts and Plant Mobile Equipment. Owner's costs were developed by Aya, and include costs for engineering studies, project-specific home office costs, field staffing, pre-production in-country expenses, and a construction camp.
Table 21-13 Owners Project Cost Total
| | | | | | | | | | | | | | | | | | | | | | | |
| Plant Area | Supply Cost | Installation Hours | Labour Installation Cost | Freight Cost | Subtotal Cost | Project Contingency | Project Total |
| 610 Owners Costs - General | 22,650,775 | 113,254 | - | - | 22,650,775 | 5,662,694 | 28,313,469 |
| 620 Plant & Admin Pre-Production | 11,751,715 | 303,906 | - | - | 11,751,715 | 2,937,929 | 14,689,644 |
| 640 Spare Parts | 6,037,500 | - | - | - | 6,037,500 | 1,509,375 | 7,546,875 |
| 670 Plant Mobile Equipment | 2,953,922 | - | - | 633,180 | 3,587,102 | 896,775 | 4,483,877 |
| Total | 43,393,912 | 417,160 | - | 633,180 | 44,027,092 | 11,006,773 | 55,033,865 |
21.1.4Tailings Storage Facility Capex
The high-level cost estimate was determined for the Capital Expenditure (CAPEX), Engineering Fees, Operating Expenditure (OPEX) and Closure CAPEX costs, as described below and detailed in Appendix A. The total LoM cost estimate changed from $48.2 to 56.6M (458M to 538M MAD (Moroccan Dirhams)), and comprises the following:
•The total LoM CAPEX with contingency is $37.4M (355 MAD),
•The total OPEX associated with the TSF has been estimated at $6.8M US (64,7M MAD) over the 14.5-year LoM, based on typical full containment operational costs sourced from tailings dam management companies.
AYA GOLD & SILVER INC. 291
•Engineering consultant and construction supervision fees for the TSF over the LoM amounts to $1.5M (14,0M MAD), and
•The rehabilitation and closure of the TSF and post-closure monitoring costs amounts to $11M US (104,1M MAD).
Table 21-14 LoM Capital Costs (Million MAD)
| | | | | |
| LoM Costs | TSF ($M) |
| TSF Capex | 32.9 |
| Contingency | 4.5 |
| Total CAPEX | 37.4 |
| Opex | 6.8 |
| Engineering Consultant Fees: Monitoring and EOR | 1.5 |
| Closure CAPEX | 11.0 |
| Total | 56.6 |
21.1.5TSF Closing Costs
The rehabilitation and closure and post-closure monitoring costs were estimated to be $11.0 M (104,1M MAD) for the study, and includes the following:
•The closure design work amounts to $0.13M (1.2M MAD).
•Closure CAPEX is $10.6M (100.5M MAD) phased over three years. The assumptions of the CAPEX estimates are based on the following items and associated works.
•Spillway channel, and
•TSF basin capping layer.
•The construction supervision of closure works amounts to $0.25M (2,4M MAD).
21.1.6Sustaining and Closing Costs
The sustaining and closing costs are detailed in each respective section.
The overall capital costs for the project, including sustaining and closing costs, are shown in Table 21-15.
Table 21-15 Capital Expenditures including Sustaining and Closing Costs
| | | | | | | | | | | |
Capital Expenditures ($M) | Initial | Sustaining | Total |
| Direct Costs | 299 | 507 | 806 |
| Open Pit Mining | 52 | 59 | 112 |
| Underground Mining | 0 | 407 | 407 |
| Processing Plant | 175 | 0 | 175 |
| Shipping Infrastructure | 11 | 0 | 11 |
| Electrical Line | 18 | 0 | 18 |
| Raw Water Supply | 33 | 0 | 33 |
| Tailings Storage Facility | 9 | 30 | 40 |
| TSF Closure Costs | 0 | 11 | 11 |
| Indirects Costs | 65 | 0 | 65 |
| Subtotal | 364 | 507 | 871 |
| Contingency | 99 | 0 | 99 |
| Total | 463 | 507 | 970 |
AYA GOLD & SILVER INC. 292
21.1.7Contingency
An amount of contingency has been provided in the estimate to cover anticipated variances between the specific items allowed in the estimate and the final total installed project cost. The contingency does not cover scope changes, etc., or the listed qualifications and exclusions.
Contingency has been applied to the estimate as a percentage allowance and is varied for different cost elements but typically around 25% for all areas except electrical costs where the contingency applied was 50%. The average project contingency is 27%. It should be noted that contingency is not a function of the specified estimate accuracy which should be measured against the project total that includes contingency.
21.1.8Qualifications and Assumptions
The capital estimate is qualified by the following assumptions:
The base date for the bulk of pricing for the estimate is Q3 2026
Prices of materials and equipment with an imported content have been converted to US$ at the rates of exchange stated previously in this document. All pricing has been entered into the estimate utilizing native currencies wherever possible.
Suitable construction/fill materials will be available from borrow pits within 2 km of the work fronts. It must be reviewed following the results of the geotechnical investigation.
There is no allowance for unforeseen blasting in the bulk earthworks cost estimates.
It has been assumed mobile equipment purchased and used by the owner’s construction team will be handed over to the owner’s operations team upon completion of construction. No allowance for additional mobile equipment has been made for operations.
21.1.9Exclusions
The following items are specifically excluded from the capital cost estimate:
•Permits and licenses
•Project sunk costs
•Federal and state taxes and duties
•Exchange rate variations
•Sustaining Capital Costs
•Fuel Distribution
21.1.10Process Plant Pre-Production and Working Capital Costs
The costs incurred by operations during the latter stages of construction and commissioning are included in the capital cost estimate but are derived in this estimate. Pre-production costs associated with mining are excluded.
AYA GOLD & SILVER INC. 293
21.1.10.1Pre-Production Labour
The pre-production site administration expenses cost covers the establishment of operations during the eight months preceding start-up and includes provision for power consumption, mobile equipment, and other expenses during this period.
21.1.10.2First Fill Reagents and Opening Stocks
Costs have been allowed in the project financial model cash flow estimates to purchase the mill balls, regrind ceramic media and reagents needed to commission the plant. Other consumables and reagents required for the process plant first fill and opening stocks are expected to be paid for in the commissioning and ramp up period, from the operating cost budget.
Sufficient first fill reagents and consumables have been estimated for the initial ball mill steel ball load to fill the reagent tanks, fill the regrind mills with ceramic media, and for other plant consumable requirements. Opening stocks refer to the purchase of the reagents and consumables required to sustain the operations for 6 weeks, which is the minimum on-site start-up storage quantity nominated by Aya Gold and Silver.
Quantities allowed have been based on either consumption over the minimum period or minimum shipping quantities, considering package size.
21.1.10.3Vendor Representatives
This cost allows for specialist vendor representatives to oversee commissioning of their processing equipment and include allowances for labour, airfares, and expenses.
21.2Operating Cost Estimate
21.2.1Mining Opex
Operating costs for mining activities include:
•Open-pit variable costs –mineralized material and waste mining, grade control and haulage
•Open-pit fixed costs – owners’s labour
•Underground variable costs – definition drilling, developing, stoping, haulage and backfill
•Underground fixed costs – labour, maintenance, electricity, mine services
A summary of the operating costs is shown in Figure 2 and Table 7. Year 1 open pit mining costs have been capitalized.
AYA GOLD & SILVER INC. 294
Figure 21-2 Operating Cost Summary – Mining
Table 21-15 Operating Cost Estimate - Mining
| | | | | |
Area | $M |
| Open-Pit Variable Costs | 1,066.9 |
| Open-Pit Fixed Costs | 14.6 |
| Underground Variable Costs | 414.9 |
| Underground Fixed Costs | 306.1 |
Total | 1,802.6 |
Unit Cost | $44/t |
21.2.1.1Open-Pit Costs
Open pit mining will be performed by a contractor. Unit costs were provided by Aya based on current contracts. The following costs were used.
Table 21-16 Open-Pit Unit Costs
| | | | | |
| Area | $/t |
| Mineralised Material Mining | 1.50 |
| Waste Mining | 2.00 |
| Grade Control | 1.10 |
| Surface Haulage | 2.00 |
Owner’s labour was estimated on an annual basis based on the Aya salary tables. Senior managers are budgeted as expatriate labour while technical services are a blend of local and expatriate labour.
AYA GOLD & SILVER INC. 295
Table 21-17 Open-Pit Owner’s Team
| | | | | |
| Area | QUANTITY |
| Captains | 1 |
| Mine Admin | 1 |
| Technical Services | 20 |
| Annual Labour Cost | $1.3 M |
21.2.1.2Underground Variable Costs
Variable costs were calculated for all stoping activities, based on production cycles and provided consumables cost. Costs for definition drilling and development were provided as per current contracts. Cemented rockfill costs were benchmarked from a similar project.
Unit costs include all consumables (including a 10% loss allowance). Equipment operation and maintenance costs are included as a fixed cost. Drilling costs include electricity. As no provision is made for a compressed air network, mobile compressors are included for all production drills. Costs are shown in Table 21-18.
Table 21-18 Underground Variable Costs
| | | | | | | | |
Activity | $/t | $M |
| Definition Drilling | 3 | 56.7 |
| Operating Development | $2,000/m | 217.2 |
| Drilling | 3.2 | 48.1 |
| Blasting | 2.69 | 40.4 |
| Backfill – CRF | 6.39 | 1.9 |
| Surface Haulage | 2 | 50.5 |
| Total | 21.96 | 414.9 |
21.2.1.3Underground Fixed Costs
Fixed costs include operating labour, equipment maintenance of the owner’s fleet, electricity and mine services.
LOM costs are summarized in Table 21-19.
Table 21-19 Underground Fixed Costs
| | | | | |
| Area | $M |
| Mining Labour | 49.9 |
| Maintenance - Parts and Diesel | 87.6 |
| Maintenance Labour | 13.8 |
| Staff and Technical Services | 65.4 |
| Electricity | 82.4 |
| Infrastructure Maintenance and Mine Services | 6.9 |
| Total | 306.1 |
All labour is budgeted on an annual basis according to provided salary tables. All labour is local except for certain managers that are expatriate. 1 supervisor is allocated for every 8 employees. The labour estimate is shown in Figure 21-3.
AYA GOLD & SILVER INC. 296
Figure 21-3 Underground Labour Profile
Maintenance costs were developed based on annual operating hours. Annual maintenance costs are based on a 20-30% factor of initial acquisition cost and then converted to hourly rates. Diesel is also factored based on operating hours. Mobile maintenance labour is estimated using a factor of 4 units per mechanic and 12 units per electrician. Twelve (12) mechanics and 12 electricians are included to maintain the mine infrastructure. Diesel is budgeted at $1.30/L. Mobile maintenance costs are summarized in Table 21-20. Development equipment costs are included in lateral development rates.
Table 21-20 Mobile Maintenance Costs
| | | | | | | | | | | | | | |
Activity | Annual Hours | Annual Mtc Factor | Parts $/hr | Diesel $/hr |
| Jumbo Drill | 3,000 | 20% | - | - |
| Production Drill | 3,000 | 20% | $62 | $6 |
| Mobile Compressors for Drill | 3,000 | 20% | $8 | $13 |
| Emulsion Charger | 1,500 | 20% | $50 | $2 |
| 30-tonne Mine Truck | 5,000 | 30% | $43 | $30 |
| 10-tonne LHD 10 t | 5,000 | 30% | $38 | $19 |
| Bolter | 3,000 | 20% | - | - |
| Transmixer | 1,500 | 20% | $46 | $7 |
| Scissor Lift | 2,500 | 20% | $15 | $3 |
| Boom Truck | 2,000 | 20% | $36 | $5 |
| Grader | 2,000 | 20% | $10 | $6 |
| Fuel Lube Truck | 2,000 | 20% | $29 | $5 |
| Water Truck | 1,500 | 20% | $38 | $4 |
| Pickup Truck | 2,000 | 20% | $4 | $1 |
| Mine rescue Truck | 1,200 | 20% | $16 | $1 |
AYA GOLD & SILVER INC. 297
Electricity for production drills is included in the drilling unit cost. Electricity consumption for the mine is based on the following factors:
•4.85 kWh/T for dewatering
•1.37 kW/T for lighting and services
•~44,000 MWh/year for main fans
•~22,000 MWh/year for auxiliary fans
•Electricity is budgeted at $0.09/kWh for a total of $82.4 M.
Other fixed costs included in estimate include an annual allowance of $150,000 for infrastructure maintenance, $100,000 for mine services, and $326,000 for ventilation maintenance (1% of initial capital).
21.2.2Process Operating Cost Estimate
21.2.2.1Introduction
The operating costs have been compiled by Lycopodium based on costs developed by Aya Gold & Silver and Lycopodium for all processing related costs.
Operating costs for Mining and TSF are detailed separately in Section 21.2.1 and Section 21.2.3 Respectively.
The estimate is considered to have an accuracy of +50 / -30%, is presented in US$ and is based on information obtained or adjusted for the third quarter of 2026 (Q3 2026).
21.2.2.2Process Plant Operating Costs
Processing operating costs have been developed by Lycopodium for a life of mine (LOM) blend. It is expected that the plant will operate on a range of mineralized material blends. The LOM processing costs are a weighted average of the various mineralized material type processing costs based on the LOM blend.
Processing operating costs have been developed for a plant with an annual throughput equivalent to 2.92 Mtpa of fresh mineralized material plant feed at a P80 grind size of 58 µm for the SAB circuit, 16 µm for the Pb regrind circuit, and 15 µm for the Zn regrind circuit, based on a 24 hour per day operation, 365 days per year. The plant will operate at the following utilization:
•6,570 h/y (75%) - Primary jaw crusher with a crushed rock stockpile.
•8,000 h/y (91.3%) - SAB grinding circuit and all flotation, regrind, thickening, reagents, and services processing plant sections.
•7,008 h/y (80%) – Concentrate filtration and handling.
The operating costs have been compiled from a variety of sources, including the following:
•Labour pay rates and manning as advised by Aya Gold & Silver.
•Laboratory rates as advised by Aya Gold & Silver.
•Grid power costs as advised by Aya Gold & Silver at a rate of 0.090 US$/kWh.
•Consumable prices from supplier budget quotations obtained in Q3 2025. Aya Gold & Silver advice, and the Lycopodium database and escalated to Q3 2026.
•Crushing and grinding consumable prices from supplier budget quotations, OMC modelled crushing and grinding energy and consumables, based on physical mineralized material characteristics determined from comminution testwork and estimated material properties from OMC database.
AYA GOLD & SILVER INC. 298
•Reagent consumptions, mass pulls and recoveries based on the results from a metallurgical testwork program.
•First principal estimates based on typical operating data / standard industry practice.
The processing operating cost estimate is summarized in Table 21-21. The relative proportions of each operating cost center for the processing and process plant (processing plus G&A) operating costs are shown in Figure 21-4.
The operating costs include all direct costs to allow production of concentrates. The battery limits for the processing operating costs are as follows:
•Mineralized material delivered to the ROM bin.
•Tailings discharged onto the tailings storage facility (TSF).
•Pb concentrate in bags, with Zinc and Pyrite concentrates on stockpiles.
Qualifications
The operating cost estimate presented in this section excludes the following:
•All sunk costs.
•ROM stockpile rehandling costs.
•General and Administration:
•All head office costs and corporate overheads.
•Withholding taxes and other taxes.
•Any impact from fluctuations in foreign exchange rate.
•Any escalation from the date of the estimate.
•Project finance costs.
•Interest charges.
•Corporate Overheads.
•Political risk insurance.
•GST and/or VAT.
•All costs associated with areas beyond the battery limits of the Study.
•Plant rehabilitation costs.
•Land or crop compensation costs (included in CAPEX).
•Subsidies to local communities.
•License fees.
•Royalties.
•No allowance for contingency.
•Any business interruption costs.
•Concentrate:
•Pyrite concentrate processing or further refining costs.
AYA GOLD & SILVER INC. 299
•In transit insurance costs.
•Transport or transit costs.
•Process / Tailings:
•Tailings storage costs, including future lifts and rehabilitation.
•Tailings dust suppression costs.
•External Government required monitoring and compliance costs.
•Raw water sourcing costs.
•Environmental:
•Any rehabilitation or closure costs.
•Labour:
•Union fees.
•Contract labour other than maintenance (generally self-performed by Aya Gold and Silver).
•Overtime allowances.
•First fill/opening stocks are captured in the CAPEX
The operating cost estimate includes the following:
•Import duties on consumable unit costs (in the consumables cost).
•Costs for the preparation and assaying of mine grade control samples and routine laboratory tests on the site water samples (in the laboratory cost).
Figure 21-4 Processing Plant Operating Cost Breakdown
AYA GOLD & SILVER INC. 300
Table 21-21 Process Plant Operating Cost Summary (US$, Q3 2025, +50 / -30%)
| | | | | | | | |
| Process Stream Costs | LOM Blend |
| Cost Centre | US$/y | US$/t |
| Operating Consumables | 27,350,727 | 9.37 |
| Maintenance | 5,153,388 | 1.76 |
| Contract Maintenance | 1,135,189 | 0.39 |
| Power (Plant) | 13,177,570 | 4.51 |
| Concentrate Handling | 1,686,485 | 0.58 |
| Laboratory | 407,880 | 0.14 |
| Process Plant Labour | 3,347,874 | 1.15 |
| Total Process Plant | 52,259,122 | 17.90 |
| General & Administration |
| Labour (G&A) | 3,530,125 | 1.21 |
| Laboratory (Exploration, Mining, Environmental) | 2,707,657 | 0.93 |
| Miscellaneous Costs | 9,252,233 | 3.17 |
| Total G&A | 15,490,014 | 5.30 |
| Total Overall OPEX | 67,749,127 | 23.20 |
21.2.2.3Power
The power cost estimate has been based on grid power at a unit cost of US$0.09/kWh. The average continuous power draw and power cost for the LOM blend by plant area is summarized in Table 21-22.
Table 21-22 LOM Blend - Power Cost Summary (US$, Q3 2025, +50 / -30%)
| | | | | | | | | | | |
| Plant Area | Connected Power kW | LOM Average Continuous Power Draw kW | LOM Power Cost US$/y |
| 120 – Feed Preparation – Crushing and Stockpiling | 437 | 230 | 181,043 |
| 130 – Milling – Grinding and Classification | 14,774 | 10,672 | 8,413,850 |
| 150 – Flotation and Concentrate Handling | 5,941 | 4,168 | 3,286,037 |
| 180 – Tails Thickening and Handling | 446 | 308 | 243,132 |
| 210 – Reagents | 350 | 210 | 165,695 |
| 220 – Water Services | 423 | 307 | 242,274 |
| 240 – Air Services | 776 | 522 | 411,866 |
| 250 – Fuel Storage and Distribution | 16 | 12 | 9,173 |
| 330/350/360/370 – Water Supply, Sewage, TSF, and Plant Infrastructure | 605 | 285 | 224,499 |
410 – Mining General1 | 7,414 | 5,171 | N/A |
| Total | 31,182 | 21,885 | 13,177,570 |
Note 1: Mining Power Costs are covered in Section 21.2.1
The power consumption for the crushers and ball mills has been calculated by OMC based on the physical mineralized material properties determined from comminution testing and database estimation. The power consumption for the remainder of the individual plant mechanical equipment items has been calculated from the load list derived from the vendor supplied equipment and estimated based on the installed motor size of individual items of equipment, excluding standby equipment, adjusted by efficiency, load, and utilization
AYA GOLD & SILVER INC. 301
factors to arrive at the annual average power draw. This is then multiplied by total hours per annum and the electricity price to obtain the power cost.
21.2.2.4Operating Consumables
Costs for processing operating consumables, including reagents, liners, fuels, and process supplies have been estimated and are summarized for the LOM blend by plant area in Table 21-23.
Table 21-23 Consumables Cost Summary (US$, Q3 2025, +50 / -30%)
| | | | | | | | |
| Plant Area | LOM Blend |
| US$/y | US$/t |
| Crushing | 769,499 | 0.26 |
| Milling | 9,904,499 | 3.39 |
| Pb Regrinding | 326,530 | 0.11 |
| Pb Concentrate Handling | 38,656 | 0.01 |
| Zn Regrinding | 281,370 | 0.10 |
| Zn Concentrate Handling | 33,395 | 0.01 |
| Py Concentrate Handling | 535,033 | 0.18 |
| Reagents | 13,457,236 | 4.61 |
| Fuel (Plant) | 2,003,970 | 0.69 |
| Total | 27,350,727 | 9.37 |
The consumables cost for mining is included in the mining operating cost.
The consumption of reagents and other consumables has been calculated from laboratory testwork and comminution circuit modelling at estimated material properties, calculated from first principles, or has been assumed based on experience with other operations. No additional allowance for process upset conditions and wastage of reagents has been made.
Reagent costs have been sourced from a combination of budget quotations, Client supplied costs, and in-house data relating to similar projects in the region. Transport and freight to site and import duties and taxes have been added based on vendor information. In absence of vendor information, a cost of 17.5% is added for transport, customs, and duties.
A diesel price, delivered to site, of US$1.34 per litre has been used, as provided by the Client. Diesel will be used in plant mobile equipment and the diesel consumption is based on industry standard vehicle consumption rates and estimated equipment utilization.
Allowances have been made for water treatment reagents.
21.2.2.5Maintenance
The plant maintenance cost allowance has been factored from the capital supply cost using factors from the Lycopodium database and is summarized for the LOM blend.
The allowance covers mechanical spares and wear parts, but excludes crushing and grinding wear components, grinding media, liners, and general consumables which are allowed for in the consumables cost.
The maintenance cost excludes payroll maintenance labour which is included in the labour cost. No additional contract labour has been allowed for.
Allowances for plant mobile equipment and general maintenance expenses have been made.
The mobile equipment allowance is based on unit costs for maintenance of the light vehicles, portable generators, and other mobile equipment for the process plant.
AYA GOLD & SILVER INC. 302
General maintenance expenses include specialist maintenance software, maintenance manuals, training costs, vendor visits, and control system maintenance and license fees.
21.2.2.6Labour
The labour rates, manning levels and rosters used to determine the labour operating cost estimate have been provided by Aya Gold & Silver.
The plant labour cost includes all labour costs associated with site-based administration, plant operations, laboratory, and maintenance personnel. The plant labour cost excludes all mining personnel (included in the Mining cost category) and all head office (included in the General & Administrative Overheads costs).
The estimate of the labour contingent has been based on a four shift operation (two shifts working 12 hours per day, tow rotation shifts), to provide continuous coverage for the plant operation with allowance for leave and absenteeism coverage. Provision has been made in the manning numbers to accommodate annual and sick leave requirements.
21.2.2.7Laboratory Costs
The laboratory cost has been provided by Aya Gold and Silver for a similar operation in the region. The laboratory cost includes, 21,000 mining production samples, 6,000 exploration samples, 4,451 processing plant samples, 177 met lab samples, and 80 environmental samples per month.
21.2.2.8Services and Utilities
Mobile Equipment
Plant mobile equipment requirements have been agreed with Aya Gold and Silver. Mobile equipment costs provide for the rental fees, fuel, and maintenance of the mobile equipment fleet (excluding the mining fleet and mining light vehicles). The purchase cost of this equipment has been included in the capital cost estimate.
The rental fees, fuel, and maintenance costs for the mobile equipment are included in the maintenance cost center.
Water Supply
As informed by Aya Gold & Silver, no direct water supply costs are incurred and allowance have been made related to the mechanical equipment maintenance and associated power consumption for pumping water, which are captured under the respective headings.
21.2.3Site General and Administration
The general and administration costs is based on Lycopodium's internal database, and from information and costs provided by Aya Gold and Silver. Costs were benchmarked with other similar operations by Lycopodium.
The general and administration expenses include the following ongoing operating expenses:
•Site office expenses including communications and communication maintenance, office equipment and supplies, computer supplies and software licenses.
•Insurance expenses covering industrial special risks, third party liability, motor vehicle and security. Labour associated insurances (medical, death and disability and workers liability insurances) are included in the labour costs.
AYA GOLD & SILVER INC. 303
•Financial expenses including banking charges, legal fees, auditing costs and accounting consultants. Concentrate refining and royalties are excluded as they are deducted directly from revenue in a separate cost category.
•Government charges including permits and environmental inspection fees.
•Personnel expenses such as first aid and medical costs, safety supplies, travel and accommodation, expatriate travel, international expat recruiting / relocation costs, training, recreational and local facilities costs, professional memberships and subscriptions, and entertainment allowances. The allowances for expatriate travel (international and regional) and international expat recruiting / relocation include all personnel (mining as well as administration and process plant).
•Contract costs for personnel transport (in country charter flights and on site bussing), camp, catering and cleaning, environmental compliance testing, OH&S and other consultants. The camp catering and cleaning contract cost includes all personnel (mining as well as administration and process plant).
•Community relations expenses including general expenses, community projects and scholarships.
•Infrastructure operating costs
•Co-disposal facility operating costs
21.2.4Concentrate Shipping and Handling Costs
Ground concentrate shipping costs were provided by Aya, and were developed in cooperation with local Moroccan logistics company. These costs were developed based on the concentrate production from the mine plan, and developed from first principles.
The shipping costs include road transportation, handling at the port, and associated port fees. The total of these costs were estimated to be 479 MAD/t, or $52.22 /t.
Maritime shipping costs were estimated at $25/t based on costs for similar operations and publicly available data for bulk transportation of concentrates along similar shipping routes.
21.2.5TSF Opex
The OPEX of $6.8M (64.7M MAD) over the life of mine for the TSF comprises:
•$2.4M (22.7M MAD) over the life of mine for maintenance of the piping, TSF and equipment,
•$0.5M (5M MAD) over the life of mine for pumping of recovering water,
•$1.0M (10M MAD) over the life of mine for operational management, pipeline management and equipment maintenance, and
•$2.8M (27.0M MAD) over the life of mine for quarterly inspections, monitoring and quarterly reports by the design engineer.
AYA GOLD & SILVER INC. 304
22.0ECONOMIC ANALYSIS
22.1Introduction
The preliminary economic assessment is preliminary in nature, it includes Inferred Mineral Resources that are considered too speculative geologically to have the economic considerations applied to them that would enable them to be categorized as Mineral Reserves, and there is no certainty that the preliminary economic assessment would be realized. Mineral Resources are not Mineral Reserves and do not have demonstrated economic viability.
A preliminary economic analysis has been carried out for the Project using a cash flow model. The model is constructed using annual cash flows by taking into account annual processed tonnages and grades. The associated process recoveries, metal prices, operating costs and refining charges, royalties and capital expenditures (both initial and sustaining) were also taken into account. The financial model was completed on a 100% project basis and includes a 3% gross royalty to the ONHYM (Office National des Hydrocarbures et des Mines). As a general rule, the financial assessment of projects of this nature is carried out on a ‘100% equity’ basis, i.e. the debt and equity sources of capital funds are ignored. No provision is made for the effects of inflation. Results are given before and after taxation. All amounts in this chapter are presented in United States Dollars (US$) and unless otherwise stated, are referred to ‘$’.
The model reflects the base case and technical assumptions shown in the preceding chapters of this report. Discounting has been applied from the first year of mine construction (Year 0 onward).
According to Canadian securities law, the outcomes of the economic assessments mentioned in this section constitute forward-looking information. Results depend on inputs that could differ considerably from those predicted here due to known and unknowable risks, uncertainties, and other factors
22.2Fiscal and Economic Parameters
22.2.1Royalties and Duties
The economic analysis incorporates royalties due to the ONHYM. The Government of Morocco also collects various taxes and duties on the importation of fuels, supplies, equipment, and outside services as specified in the Mining Code.
The ONHYM is entitled to collect a 3% royalty on the total revenues from metal production.
22.2.2Taxes
Aya’s understanding of current Morocco tax regulations are applied to assess the tax liabilities. Taxation calculations are based on a 35% corporate tax rate as prescribed by Moroccan tax regulations. It also includes a mining tax rate of $0.32/t extracted. It is also anticipated that the project is eligible to receive a tax holiday period of 5 years.
Depreciation allowance uses a linear method based on life of mine (14 years) for initial investment as prescribed by Moroccan tax regulations. Investments made during the course of the operations are amortized on the remaining years of life.
AYA GOLD & SILVER INC. 305
22.2.3Economic Parameters
All costs have been estimated in US Dollars. All capital and operating costs are provided in Q3 2026 money terms. Inflation rates have not been applied in the financial model as the evaluation has been carried out on a real terms constant money basis.
No price escalation has been applied to the model, and cost input parameters were considered fixed for the life-of-mine for the purposes of this financial valuation.
No salvage value has been considered within the economic model for the Project equipment or infrastructure such as buildings, earth works, or remediation works.
The financial valuation has been completed using base-case prices shown in Table 22-1 below for the various metals produced, with a sensitivity analysis provided for Gold and Silver.
Table 22-1 Base Case Prices and Sensitivity Ranges
| | | | | | | | | | | |
| Metal Prices | Units | Base Case Price | Sensitivity Range |
| Gold Price | $/oz | $3,500 | $1704 - $5250 |
| Silver Price | $/oz | $50 | $24 - $75 |
| Zinc Price | $/lb | $1.37 | $0.90 - $1.71 |
| Lead Price | $/lb | $0.90 | $0.60 - $1.13 |
22.3Project Timing
Key assumptions with respect to project timing used in developing the financial model are:
•For the purposes of the financial valuation, project capital expenditure is spent over 2 years prior to production (Year 0). In the actual planned ramp up, it is estimated that 40% of the capital cost is likely to be incurred in Year -1 (2 years before production) of the implementation period, and the remaining 60% of the capital cost incurred in Year 0.
•For the financial valuation it has been assumed that the capital expenditure is incurred in full during the period prior to project commissioning and ramp-up.
•Commissioning, ramp-up and initial mining occurs during Year 1 of the schedule.
•Process plant commissioned and first material in the plant in Year 1 of the schedule.
•It is assumed that the project will reach 100% of name plate capacity within six (6) months of commissioning, in line with experience at other similar projects that have been constructed by Lycopodium elsewhere in Africa during the last few years.
22.4Financial Modelling
The financial assessment of the Project was carried out on a 100% equity basis, not accounting for potential sources of funding which may include debt. The technical parameters and key assumptions described elsewhere in this report are reflected in the financial model, with the LOM Project cash flow shown in Table 22-2.
AYA GOLD & SILVER INC. 306
Table 22-2 Key PEA Assumptions and Economic Parameters
| | | | | | | | | | | |
| Parameter | Units | Value | Source |
| General |
| Tonnes per day processed | tpd | 8,000 | Aya |
| Process Plant Capacity Year 1 | % | 75% | Aya / Lycopodium |
| Process Plant Capacity Subsequent Years | % | 100% | Aya / Lycopodium |
| Shipping Capacity Year 1 | % | 75% | Aya / Lycopodium |
| Shipping Capacity Subsequent Years | % | 100% | Aya / Lycopodium |
| Process Plant CAPEX year 1 Split | % | 40% | Aya |
| Metal Prices |
| Gold Price | $/oz | $3,500 | Aya/Lycopodium |
| Silver Price | $/oz | $50 | Aya/Lycopodium |
| Zinc Price | $/lb | $1.37 | Aya/Lycopodium |
| Lead Price | $/lb | $0.90 | Aya/Lycopodium |
| Other Expenses |
| ONHYM Royalties | % | 3.00% | Aya |
| Aya Technical Assistance | % | 2.75% | Aya |
| Mining Tax (per mineralized tonne) | $/t | 0.32 | Moroccan Tax Law |
| Income Taxes | % | 35.0% | Moroccan Tax Law |
| Payables |
| Lead Concentrate |
| Pb Payable | % | 95 | Prel. off-taker terms |
| Pb Minimum Deductible | % | 3 | Prel. off-taker terms |
| Au Payable | % | 95 | Prel. off-taker terms |
| Au Minimum Deductible | g/t | 1 | Prel. off-taker terms |
| Ag Payable | % | 95 | Prel. off-taker terms |
| Ag Minimum Deductible | g/t | 50 | Prel. off-taker terms |
| Zinc Concentrate |
| Zn Payable | % | 85 | Prel. off-taker terms |
| Zn Minimum Deductible | % | 8 | Prel. off-taker terms |
| Au Deduction | g/t | 1 | Prel. off-taker terms |
| Au Payable (After Deduction) | % | 70 | Prel. off-taker terms |
| Ag Deduction | g/t | 93.3 | Prel. off-taker terms |
| Ag Payable (After Deduction) | % | 70 | Prel. off-taker terms |
| Pyrite Concentrate |
| Au Payable Level 1 | | | |
| Au Minimum Grade | g/t | 2 | Prel. off-taker terms |
| Au Payable | % | 77 | Prel. off-taker terms |
| Au Payable Level 2 | | | |
| Au Minimum Grade | g/t | 3 | Prel. off-taker terms |
| Au Payable | % | 78 | Prel. off-taker terms |
| Au Payable Level 3 | | | |
| Au Minimum Grade | g/t | 4 | Prel. off-taker terms |
| Au Payable | % | 79 | Prel. off-taker terms |
| Ag Payable | | | |
| Ag Minimum Grade | g/t | 30 | Prel. off-taker terms |
| Au Payable | % | 78 | Prel. off-taker terms |
| Deductables |
AYA GOLD & SILVER INC. 307
| | | | | | | | | | | |
| Parameter | Units | Value | Source |
| Lead Concentrate |
| Treatment Charge | $/t | 100 | Estimated based on historical TC Values |
| Au Refining Charge | $/oz | 20 | Prel. off-taker terms |
| Ag Refining Charge | $/oz | 1.5 | Prel. off-taker terms |
| Zinc Concentrate |
| Treatment Charge | $/t | 200 | Estimated based on historical TC Values |
| Au Refining Charge | $/oz | 20 | Prel. off-taker terms |
| Ag Refining Charge | $/oz | 1.5 | Prel. off-taker terms |
| Penalties |
| Lead Concentrate |
| Arsenic Penalty Level 1 | | | |
| As grade threshold | % | 0.6 | Prel. off-taker terms |
| As penalty interval | % | 0.1 | Prel. off-taker terms |
| As penalty per interval | $ | 2.5 | Prel. off-taker terms |
| Zinc Concentrate |
| Arsenic Penalty Level 1 | | | |
| As grade threshold | % | 0.6 | Prel. off-taker terms |
| As penalty interval | % | 0.1 | Prel. off-taker terms |
| As penalty per interval | $ | 2.5 | Prel. off-taker terms |
| Cadmium Penalty Level 1 | | | |
| Cd grade threshold | % | 0.3 | Prel. off-taker terms |
| Cd penalty interval | % | 0.1 | Prel. off-taker terms |
| Cd penalty per interval | $ | 2.5 | Prel. off-taker terms |
| Pyrite Concentrate |
| Arsenic Penalty Level 1 | | | |
| As grade threshold | % | 1 | Prel. off-taker terms |
| As penalty | $ | 0 | Prel. off-taker terms |
AYA GOLD & SILVER INC. 308
Table 22-3 Cash Flow Model
| | | | | | | | | | | | | | | | | | | | | | | | | | | | | | | | | | | | | | | | | | | | | | | | | | | | | | | | | | | | | | | | | | | | |
| Parameter | Unit | yr -1 | yr 0 | yr 1 | yr 2 | yr 3 | yr 4 | yr 5 | yr 6 | yr 7 | yr 8 | yr 9 | yr 10 | yr 11 | yr 12 | yr 13 | yr 14 | yr 15 | yr 16 | yr 17 | yr 18 | Total |
| Mining |
| Open Pit Mining |
Mineralized Material | kt | - | 1,333 | 2,504 | 1,811 | 2,258 | 3,426 | 1,978 | 2,383 | 853 | 1,208 | 2,726 | 1,874 | - | - | - | - | - | - | - | - | 22,354 |
Waste | kt | - | 18,650 | 42,487 | 53,186 | 52,725 | 51,573 | 53,001 | 52,613 | 54,114 | 53,788 | 48,423 | 23,897 | - | - | - | - | - | - | - | - | 504,457 |
Strip Ratio | | - | 14.0 | 17.0 | 29.4 | 23.3 | 15.1 | 26.8 | 22.1 | 63.4 | 44.5 | 17.8 | 12.8 | - | - | - | - | - | - | - | - | 22.6 |
| Underground Mining |
Mineralized Material | kt | - | - | - | - | 567 | 825 | 1,472 | 1,518 | 1,875 | 1,845 | 2,000 | 1,936 | 2,000 | 2,000 | 2,000 | 857 | - | - | - | - | 18,895 |
Waste to Surface | kt | - | - | - | 249 | 335 | 496 | 411 | 515 | 505 | 605 | 714 | 663 | 690 | 690 | 496 | 5 | - | - | - | - | 6,373 |
| Processing |
| Feed to Processing Plant | kt | - | - | 2,190 | 2,920 | 2,920 | 2,920 | 2,920 | 2,920 | 2,920 | 2,920 | 2,920 | 2,920 | 2,920 | 2,920 | 2,920 | 2,920 | 1,099 | - | - | - | 41,249 |
| Pb | % | - | - | 0.59 | 0.81 | 1.10 | 0.99 | 0.80 | 0.67 | 0.55 | 0.44 | 0.45 | 0.36 | 0.41 | 0.31 | 0.36 | 0.36 | 0.30 | - | - | - | 0.58 |
| Zn | % | - | - | 2.41 | 2.24 | 2.34 | 1.56 | 1.76 | 1.65 | 1.43 | 1.17 | 1.05 | 0.76 | 1.04 | 0.72 | 0.76 | 0.81 | 0.68 | - | - | - | 1.37 |
| Au | g/t | - | - | 3.31 | 1.50 | 1.30 | 2.85 | 1.59 | 1.72 | 1.31 | 1.53 | 2.24 | 3.02 | 1.34 | 1.40 | 1.15 | 1.12 | 1.14 | - | - | - | 1.77 |
| Ag | g/t | - | - | 93 | 80 | 121 | 119 | 92 | 77 | 40 | 39 | 58 | 45 | 30 | 32 | 43 | 36 | 34 | - | - | - | 63 |
| Lead Concentrate | kt | - | - | 36 | 66 | 89 | 80 | 65 | 54 | 44 | 36 | 36 | 29 | 33 | 25 | 29 | 29 | 9 | - | - | - | 660 |
| Pb Grade | % | - | - | 29.6 | 29.6 | 29.6 | 29.6 | 29.6 | 29.6 | 29.6 | 29.6 | 29.6 | 29.6 | 29.6 | 29.6 | 29.6 | 29.6 | 29.6 | - | - | - | 29.6 |
| Au Grade | g/t | - | - | 48.0 | 15.8 | 10.1 | 24.8 | 17.0 | 22.2 | 20.5 | 29.7 | 43.0 | 72.3 | 27.7 | 39.3 | 27.4 | 26.5 | 32.4 | - | - | - | 26.2 |
| Ag Grade | g/t | - | - | 2,877 | 1,794 | 1,990 | 2,198 | 2,103 | 2,107 | 1,321 | 1,623 | 2,362 | 2,297 | 1,340 | 1,927 | 2,178 | 1,802 | 2,049 | - | - | - | 1,999 |
| As Grade | % | - | - | 2.2 | 1.0 | 0.6 | 0.9 | 1.5 | 2.2 | 2.2 | 2.0 | 2.3 | 3.1 | 2.0 | 2.9 | 2.0 | 1.6 | 1.7 | - | - | - | 1.7 |
| Zinc Concentrate | kt | - | - | 69 | 85 | 89 | 59 | 67 | 63 | 54 | 45 | 40 | 29 | 40 | 27 | 29 | 31 | 10 | - | - | - | 736 |
| Zn Grade | % | - | - | 57.4 | 57.4 | 57.4 | 57.4 | 57.4 | 57.4 | 57.4 | 57.4 | 57.4 | 57.4 | 57.4 | 57.4 | 57.4 | 57.4 | 57.4 | - | - | - | 57.4 |
| Au Grade | g/t | - | - | 1.1 | 0.5 | 0.4 | 1.4 | 0.7 | 0.8 | 0.7 | 1.0 | 1.6 | 3.0 | 1.0 | 1.5 | 1.2 | 1.1 | 1.3 | - | - | - | 1.0 |
| Ag Grade | g/t | - | - | 137 | 127 | 182 | 271 | 185 | 165 | 98 | 119 | 194 | 209 | 103 | 159 | 201 | 157 | 176 | - | - | - | 164 |
| As Grade | % | - | - | 0.1 | 0.1 | 0.1 | 0.2 | 0.2 | 0.2 | 0.2 | 0.2 | 0.3 | 0.4 | 0.2 | 0.3 | 0.3 | 0.2 | 0.2 | - | - | - | 0.2 |
| Pyrite Concentrate | kt | | | 970 | 1,041 | 1,026 | 1,111 | 1,026 | 1,038 | 866 | 847 | 1,048 | 1,148 | 846 | 1,001 | 883 | 894 | 369 | - | - | - | 14,113 |
| Au Grade | g/t | - | - | 5.3 | 3.0 | 2.6 | 5.3 | 3.2 | 3.5 | 3.1 | 3.8 | 4.4 | 5.5 | 3.3 | 2.9 | 2.7 | 2.6 | 2.4 | - | - | - | 3.7 |
| Ag Grade | g/t | - | - | 87 | 93 | 142 | 130 | 109 | 90 | 55 | 56 | 67 | 48 | 43 | 39 | 59 | 49 | 42 | - | - | - | 77 |
| As grade | % | - | - | 1.5 | 1.2 | 1.0 | 1.2 | 1.7 | 2.1 | 2.0 | 1.5 | 1.5 | 1.5 | 1.5 | 1.3 | 1.2 | 1.0 | 0.8 | - | - | - | 1.4 |
| S Grade | % | - | - | 44.3 | 44.3 | 44.3 | 44.3 | 44.3 | 44.3 | 44.3 | 44.3 | 44.3 | 44.3 | 44.3 | 44.3 | 44.3 | 44.3 | 44.3 | - | - | - | 44.3 |
| Metal Profile |
| Metal Produced |
| Pb | kt | - | - | 11 | 19 | 26 | 24 | 19 | 16 | 13 | 11 | 11 | 9 | 10 | 7 | 9 | 9 | 3 | - | - | - | 195 |
Pb - Pb Concentrate | kt | - | - | 11 | 19 | 26 | 24 | 19 | 16 | 13 | 11 | 11 | 9 | 10 | 7 | 9 | 9 | 3 | - | - | - | 195 |
| Zn | kt | - | - | 39 | 49 | 51 | 34 | 38 | 36 | 31 | 26 | 23 | 17 | 23 | 16 | 17 | 18 | 6 | - | - | - | 422 |
Zn - Zn Concentrate | kt | - | - | 39 | 49 | 51 | 34 | 38 | 36 | 31 | 26 | 23 | 17 | 23 | 16 | 17 | 18 | 6 | - | - | - | 422 |
| Au | koz | - | - | 224 | 135 | 118 | 257 | 143 | 156 | 118 | 138 | 202 | 273 | 120 | 127 | 104 | 101 | 39 | - | - | - | 2,254 |
Au - Pb Concentrate | koz | - | - | 55 | 33 | 29 | 64 | 35 | 38 | 29 | 34 | 50 | 67 | 30 | 31 | 26 | 25 | 10 | - | - | - | 557 |
Au - Zn Concentrate | koz | - | - | 2 | 1 | 1 | 3 | 1 | 2 | 1 | 1 | 2 | 3 | 1 | 1 | 1 | 1 | 0 | - | - | - | 23 |
Au - Py Concentrate | koz | - | - | 166 | 100 | 87 | 191 | 106 | 116 | 87 | 103 | 150 | 203 | 89 | 94 | 77 | 75 | 29 | - | - | - | 1674 |
| Ag | koz | - | - | 6,341 | 7,266 | 10,913 | 10,795 | 8,369 | 6,978 | 3,594 | 3,572 | 5,240 | 4,099 | 2,755 | 2,936 | 3,908 | 3,246 | 1,156 | - | - | - | 81,167 |
Ag - Pb Concentrate | koz | - | - | 3,315 | 3,799 | 5,705 | 5,644 | 4,375 | 3,648 | 1,879 | 1,868 | 2,739 | 2,143 | 1,440 | 1,535 | 2,043 | 1,697 | 604 | - | - | - | 42,436 |
Ag - Zn Concentrate | koz | - | - | 303 | 347 | 521 | 515 | 399 | 333 | 172 | 170 | 250 | 196 | 131 | 140 | 187 | 155 | 55 | - | - | - | 3,873 |
Ag - Py Concentrate | koz | - | - | 2,723 | 3,121 | 4,687 | 4,636 | 3,594 | 2,997 | 1,544 | 1,534 | 2,250 | 1,760 | 1,183 | 1,261 | 1,679 | 1,394 | 496 | - | - | - | 34,858 |
Au-eq1 | koz | - | - | 354 | 292 | 333 | 454 | 307 | 295 | 203 | 217 | 303 | 351 | 185 | 186 | 179 | 167 | 62 | - | - | - | 3,889 |
Ag-eq1 | koz | - | - | 24,806 | 20,460 | 23,284 | 31,790 | 21,483 | 20,681 | 14,236 | 15,224 | 21,177 | 24,547 | 12,952 | 13,033 | 12,517 | 11,722 | 4,308 | - | - | - | 272,219 |
| Metal Payable |
AYA GOLD & SILVER INC. 309
| | | | | | | | | | | | | | | | | | | | | | | | | | | | | | | | | | | | | | | | | | | | | | | | | | | | | | | | | | | | | | | | | | | | |
| Parameter | Unit | yr -1 | yr 0 | yr 1 | yr 2 | yr 3 | yr 4 | yr 5 | yr 6 | yr 7 | yr 8 | yr 9 | yr 10 | yr 11 | yr 12 | yr 13 | yr 14 | yr 15 | yr 16 | yr 17 | yr 18 | Total |
| Pb | kt | - | - | 10 | 18 | 24 | 21 | 17 | 14 | 12 | 10 | 10 | 8 | 9 | 7 | 8 | 8 | 2 | - | - | - | 176 |
Pb - Pb Concentrate | kt | - | - | 10 | 18 | 24 | 21 | 17 | 14 | 12 | 10 | 10 | 8 | 9 | 7 | 8 | 8 | 2 | - | - | - | 176 |
| Zn | kt | - | - | 69 | 85 | 89 | 59 | 67 | 63 | 54 | 45 | 40 | 29 | 40 | 27 | 29 | 31 | 10 | - | - | - | 736 |
Zn - Zn Concentrate | kt | - | - | 69 | 85 | 89 | 59 | 67 | 63 | 54 | 45 | 40 | 29 | 40 | 27 | 29 | 31 | 10 | - | - | - | 736 |
| Au | koz | - | - | 184 | 110 | 93 | 212 | 116 | 127 | 96 | 113 | 166 | 225 | 98 | 102 | 84 | 82 | 31 | - | - | - | 1,839 |
Au - Pb Concentrate | koz | - | - | 53 | 31 | 26 | 60 | 33 | 37 | 28 | 32 | 47 | 64 | 28 | 30 | 24 | 24 | 9 | - | - | - | 527 |
Au - Zn Concentrate | koz | - | - | 0 | 0 | 0 | 1 | 0 | 0 | 0 | 0 | 1 | 1 | 0 | 0 | 0 | 0 | 0 | - | - | - | 3 |
Au - Py Concentrate | koz | - | - | 131 | 78 | 67 | 151 | 83 | 90 | 68 | 80 | 118 | 160 | 70 | 72 | 59 | 58 | 22 | - | - | - | 1,309 |
| Ag | koz | - | - | 5,341 | 6,107 | 9,253 | 9,214 | 7,098 | 5,904 | 2,995 | 2,997 | 4,448 | 3,485 | 2,300 | 2,482 | 3,321 | 2,743 | 979 | - | - | - | 68,668 |
Ag - Pb Concentrate | koz | - | - | 3,149 | 3,609 | 5,420 | 5,362 | 4,156 | 3,466 | 1,785 | 1,774 | 2,602 | 2,036 | 1,368 | 1,458 | 1,941 | 1,612 | 574 | - | - | - | 40,314 |
Ag - Zn Concentrate | koz | - | - | 67 | 64 | 177 | 236 | 139 | 101 | 6 | 26 | 91 | 76 | 9 | 41 | 70 | 44 | 18 | - | - | - | 1,165 |
Ag - Py Concentrate | koz | - | - | 2,124 | 2,434 | 3,655 | 3,616 | 2,803 | 2,337 | 1,204 | 1,197 | 1,755 | 1,373 | 923 | 983 | 1,309 | 1,087 | 387 | - | - | - | 27,189 |
Au-eq1 | koz | - | - | 294 | 243 | 277 | 380 | 256 | 246 | 168 | 180 | 252 | 292 | 153 | 153 | 148 | 138 | 51 | - | - | - | 3,229 |
Ag-eq1 | koz | - | - | 20,613 | 16,986 | 19,362 | 26,627 | 17,899 | 17,189 | 11,769 | 12,571 | 17,650 | 20,428 | 10,682 | 10,715 | 10,346 | 9,660 | 3,550 | - | - | - | 226,049 |
| Revenue |
| Lead Concentrate | $M | - | - | 350 | 312 | 392 | 504 | 344 | 316 | 200 | 213 | 305 | 332 | 178 | 183 | 190 | 173 | 63 | - | - | - | 4,055 |
| Pb | $M | - | - | 19 | 35 | 47 | 42 | 34 | 28 | 23 | 19 | 19 | 15 | 18 | 13 | 15 | 16 | 5 | - | - | - | 349 |
| Au | $M | - | - | 184 | 110 | 92 | 211 | 117 | 128 | 97 | 114 | 166 | 224 | 99 | 104 | 85 | 83 | 32 | - | - | - | 1,845 |
| Ag | $M | - | - | 158 | 181 | 271 | 268 | 208 | 173 | 89 | 89 | 130 | 102 | 68 | 73 | 97 | 81 | 29 | - | - | - | 2,016 |
| Penalties | $M | - | - | -1 | -1 | 0 | -1 | -1 | -2 | -2 | -1 | -2 | -2 | -1 | -1 | -1 | -1 | 0 | - | - | - | -17 |
| Deductions | $M | - | - | -6 | -6 | -9 | -9 | -7 | -6 | -3 | -3 | -5 | -4 | -3 | -3 | -3 | -3 | -1 | - | - | - | -71 |
| TC | $M | - | - | -4 | -7 | -9 | -8 | -7 | -5 | -4 | -4 | -4 | -3 | -3 | -3 | -3 | -3 | -1 | - | - | - | -66 |
| Zinc Concentrate | $M | - | - | 91 | 111 | 122 | 88 | 92 | 85 | 69 | 58 | 57 | 45 | 51 | 38 | 40 | 41 | 14 | - | - | - | 1,000 |
| Zn | $M | - | - | 101 | 125 | 131 | 87 | 99 | 93 | 80 | 66 | 59 | 43 | 58 | 40 | 42 | 45 | 14 | - | - | - | 1,084 |
| Au | $M | - | - | 0 | 0 | 0 | 2 | 0 | 0 | 0 | 0 | 2 | 5 | 0 | 1 | 0 | 0 | 0 | - | - | - | 11 |
| Ag | $M | - | - | 3 | 3 | 9 | 12 | 7 | 5 | 0 | 1 | 5 | 4 | 0 | 2 | 4 | 2 | 1 | - | - | - | 58 |
| Penalties | $M | - | - | 0 | -1 | -1 | 0 | 0 | 0 | 0 | 0 | 0 | 0 | 0 | 0 | 0 | 0 | 0 | - | - | - | -4 |
| Deductions | $M | - | - | 0 | 0 | 0 | 0 | 0 | 0 | 0 | 0 | 0 | 0 | 0 | 0 | 0 | 0 | 0 | - | - | - | -2 |
| TC | $M | - | - | -14 | -17 | -18 | -12 | -13 | -13 | -11 | -9 | -8 | -6 | -8 | -6 | -6 | -6 | -2 | - | - | - | -147 |
| Pyrite Concentrate | $M | - | - | 566 | 396 | 418 | 709 | 431 | 432 | 299 | 340 | 502 | 629 | 290 | 302 | 273 | 257 | 97 | - | - | - | 5,941 |
| Au | $M | - | - | 459 | 274 | 235 | 528 | 290 | 315 | 239 | 281 | 414 | 560 | 244 | 253 | 208 | 202 | 77 | - | - | - | 4,581 |
| Ag | $M | - | - | 106 | 122 | 183 | 181 | 140 | 117 | 60 | 60 | 88 | 69 | 46 | 49 | 66 | 54 | 19 | - | - | - | 1,360 |
| Penalties | $M | - | - | 0 | 0 | 0 | 0 | 0 | 0 | 0 | 0 | 0 | 0 | 0 | 0 | 0 | 0 | 0 | - | - | - | 0 |
| Deductions | $M | - | - | 0 | 0 | 0 | 0 | 0 | 0 | 0 | 0 | 0 | 0 | 0 | 0 | 0 | 0 | 0 | - | - | - | 0 |
| TC | $M | - | - | 0 | 0 | 0 | 0 | 0 | 0 | 0 | 0 | 0 | 0 | 0 | 0 | 0 | 0 | 0 | - | - | - | 0 |
| Total Revenues | $M | - | - | 1,006 | 818 | 932 | 1,301 | 866 | 833 | 568 | 611 | 864 | 1,006 | 519 | 523 | 504 | 470 | 173 | - | - | - | 10,995 |
| Operating Expenditures |
| Open Pit Mining Cost | $M | - | - | 98 | 116 | 117 | 120 | 117 | 118 | 114 | 115 | 108 | 60 | 0 | 0 | 0 | 0 | 0 | - | - | - | 1,082 |
| UG Mining Cost | $M | - | - | 5 | 8 | 36 | 43 | 55 | 61 | 69 | 72 | 74 | 69 | 76 | 67 | 63 | 25 | 0 | - | - | - | 721 |
| Processing Charges | $M | - | - | 42 | 52 | 52 | 52 | 52 | 52 | 52 | 52 | 52 | 52 | 52 | 52 | 52 | 52 | 20 | - | - | - | 741 |
| G&A | $M | - | - | 16 | 16 | 16 | 16 | 16 | 16 | 16 | 16 | 16 | 16 | 16 | 16 | 16 | 16 | 8 | - | - | - | 225 |
TSF | $M | - | - | 0 | 0 | 0 | 0 | 0 | 0 | 0 | 0 | 0 | 0 | 0 | 0 | 0 | 0 | 0 | - | - | - | 7 |
| Raw water cost | $M | - | - | 1 | 1 | 1 | 1 | 1 | 1 | 1 | 1 | 1 | 1 | 1 | 1 | 1 | 1 | 1 | - | - | - | 14 |
| Concentrate Shipping | $M | - | - | 98 | 109 | 110 | 114 | 106 | 105 | 88 | 85 | 103 | 110 | 84 | 96 | 86 | 87 | 36 | - | - | - | 1,416 |
| Total Costs | $M | - | - | 259 | 302 | 332 | 346 | 346 | 353 | 340 | 340 | 354 | 308 | 229 | 232 | 218 | 182 | 64 | - | - | - | 4,205 |
| ONHYM Royalties (on sales) | $M | - | 0 | 30 | 25 | 28 | 39 | 26 | 25 | 17 | 18 | 26 | 30 | 16 | 16 | 15 | 14 | 5 | - | - | - | 330 |
| Mining Taxes | $M | - | 0 | 1 | 1 | 1 | 1 | 1 | 1 | 1 | 1 | 2 | 1 | 1 | 1 | 1 | 0 | 0 | - | - | - | 13 |
AYA GOLD & SILVER INC. 310
| | | | | | | | | | | | | | | | | | | | | | | | | | | | | | | | | | | | | | | | | | | | | | | | | | | | | | | | | | | | | | | | | | | | |
| Parameter | Unit | yr -1 | yr 0 | yr 1 | yr 2 | yr 3 | yr 4 | yr 5 | yr 6 | yr 7 | yr 8 | yr 9 | yr 10 | yr 11 | yr 12 | yr 13 | yr 14 | yr 15 | yr 16 | yr 17 | yr 18 | Total |
| Aya technical assistance | $M | - | 0 | 28 | 23 | 26 | 36 | 24 | 23 | 16 | 17 | 24 | 28 | 14 | 14 | 14 | 13 | 5 | - | - | - | 302 |
| Total of Expenses | $M | - | 0 | 318 | 350 | 387 | 422 | 397 | 402 | 374 | 376 | 405 | 367 | 259 | 263 | 248 | 209 | 74 | - | - | - | 4,850 |
| Taxes (Excluding Interest) |
| EBITDA | $M | - | - | 688 | 469 | 545 | 879 | 470 | 431 | 194 | 235 | 459 | 639 | 259 | 260 | 256 | 261 | 100 | - | - | - | 6,145 |
| Amortization | $M | - | - | 47 | 50 | 53 | 57 | 61 | 66 | 71 | 76 | 83 | 92 | 102 | 116 | 127 | 127 | 0 | - | - | - | - |
| Use of LCF | $M | - | - | 0 | 0 | 0 | 0 | 0 | 0 | 0 | 0 | 0 | 0 | 0 | 0 | 0 | 0 | 0 | - | - | - | - |
| Taxable income | $M | - | - | 641 | 419 | 493 | 822 | 409 | 365 | 123 | 159 | 376 | 548 | 158 | 145 | 129 | 134 | 100 | - | - | - | - |
| VAT | $M | - | - | 47 | 8 | 6 | 2 | 0 | 1 | -2 | 0 | 2 | -8 | -14 | 1 | -3 | -7 | -21 | - | - | - | - |
| Taxes payable | $M | - | - | 47 | 8 | 6 | 2 | 0 | 129 | 41 | 56 | 134 | 184 | 41 | 51 | 43 | 40 | 14 | - | - | - | 783 |
| Capital Expenditures |
Initial Capital Expenditure | $M | 162 | 301 | - | - | - | - | - | - | - | - | - | - | - | - | - | - | - | | | | 446 |
Sustaining Capital Expenditure | $M | - | - | 30 | 36 | 34 | 45 | 43 | 41 | 43 | 38 | 43 | 41 | 40 | 42 | 23 | 0 | 0 | 4 | 4 | 4 | 340 |
Total Capital Expenditure | $M | 162 | 301 | 30 | 36 | 34 | 45 | 43 | 41 | 43 | 38 | 43 | 41 | 40 | 42 | 23 | 0 | 0 | 4 | 4 | 4 | 970 |
| Cashflow Statement |
| Revenue | $M | 0 | 0 | 1,006 | 818 | 932 | 1,301 | 866 | 833 | 568 | 611 | 864 | 1,006 | 519 | 523 | 504 | 470 | 173 | 0 | 0 | 0 | 10,995 |
| Production Costs | $M | 0 | 0 | 259 | 302 | 332 | 346 | 346 | 353 | 340 | 340 | 354 | 308 | 229 | 232 | 218 | 182 | 64 | 0 | 0 | 0 | 4,205 |
Royalties | $M | 0 | 0 | 30 | 25 | 28 | 39 | 26 | 25 | 17 | 18 | 26 | 30 | 16 | 16 | 15 | 14 | 5 | 0 | 0 | 0 | 330 |
| Mining Taxes | $M | 0 | 0 | 1 | 1 | 1 | 1 | 1 | 1 | 1 | 1 | 2 | 1 | 1 | 1 | 1 | 0 | 0 | 0 | 0 | 0 | 13 |
| Aya technical assistance | $M | 0 | 0 | 28 | 23 | 26 | 36 | 24 | 23 | 16 | 17 | 24 | 28 | 14 | 14 | 14 | 13 | 5 | 0 | 0 | 0 | 302 |
| Taxes PaId | $M | 0 | 0 | 47 | 8 | 6 | 2 | 0 | 129 | 41 | 56 | 134 | 184 | 41 | 51 | 43 | 40 | 14 | -11 | 0 | 0 | 783 |
| Capex | $M | 162 | 301 | 30 | 36 | 34 | 45 | 43 | 41 | 43 | 38 | 43 | 41 | 40 | 42 | 23 | 0 | 0 | 4 | 4 | 4 | 970 |
Pre-Tax Free Cash Flow | $M | -162 | -301 | 686 | 456 | 537 | 870 | 450 | 413 | 167 | 214 | 441 | 626 | 233 | 233 | 248 | 274 | 104 | -4 | -4 | -4 | 5,477 |
Pre-Tax Free Cash Flow - 5% Discount | $M | -162 | -301 | 670 | 424 | 475 | 734 | 361 | 316 | 122 | 149 | 291 | 394 | 140 | 133 | 135 | 142 | 51 | -2 | -2 | -2 | 4,066 |
Post-Tax Free Cash Flow | $M | -162 | -301 | 640 | 448 | 532 | 868 | 450 | 284 | 126 | 159 | 307 | 443 | 192 | 182 | 205 | 234 | 91 | 7 | -4 | -4 | 4,694 |
Post-Tax Free Cash Flow - 5% | $M | -162 | -301 | 624 | 417 | 471 | 732 | 361 | 217 | 92 | 110 | 203 | 278 | 115 | 104 | 111 | 121 | 45 | 4 | -2 | -2 | 3,537 |
1Au-Eq and Ag-Eq are calculated at metal prices of Au = $3500oz, Ag = $50/oz, Pb = $0.90/lb, Zn = $1.37/lb
AYA GOLD & SILVER INC. 311
Figure 22-1 Boumadine Project - Annual Free Cash Flow Profile
22.5Results
22.5.1Key Economic Results
On a pre-tax basis, the Project has a Net Present Value (NPV) of $4,066 M at a discount rate of 5%, an Internal Rate of Return (IRR) of 97%, and a payback period of 0.7 years. On an post-tax basis, the NPV is $3,537 at a discount rate of 5%, the IRR is 93%, and the payback period is 0.7 years. The payback period corresponds to the time at which the cumulative cash flow becomes positive.
The key economic results of the PEA for the Boumadine Project are presented in the tables below.
Table 22-4 Key Economic Results
| | | | | | | | | | | |
| Project Economics | Units | Base Case |
| Pre-tax | Post-tax |
| NPV5% | $B | 4.1 | 3.5 |
| IRR | % | 0.97 | 0.93 |
| Payback | Years | 0.7 | 0.7 |
| NPV: Capex1 | - | 8.8 | 7.6 |
| Revenue LOM | $B | 11.0 | - |
| Avg. Annual Revenue | $M/y | 765 | - |
| EBITDA LOM | $B | 6.1 | - |
| Avg. Annual EBITDA | $M/y | 427 | - |
| Cumulative FCF LOM | $B | 5.5 | 4.7 |
| Avg. Annual FCF | $M/y | 381 | 327 |
1.NPV:Capex ratio is the ratio of Net Present Value, discounted at 5%, to the initial capital expenditure.
AYA GOLD & SILVER INC. 312
Table 22-5 Additional Economic Model Outputs
| | | | | | | | | | | |
| Item | Units | Year 1-5 | LOM |
| General |
| Total Mine Life | years | | 14.4 |
| Open Pit Strip Ratio1 | - | 21.1 | 22.6 |
| Throughput Capacity | tpd | 8,000 | 8,000 |
| Total Tonnes Processed | Mt | 13.9 | 41.2 |
| Open-pit | Mt | 11.9 | 22.4 |
| Underground | Mt | 2.0 | 18.9 |
| Processed Grade |
| Au | g/t | 2.05 | 1.77 |
| Ag | g/t | 101.6 | 63.5 |
| Zn | % | 2.04 | 1.37 |
| Pb | % | 0.87 | 0.58 |
| Au-eq | g/t | 4.11 | 3.10 |
| Ag-eq | g/t | 287 | 216 |
| Recoveries |
| Au rec (%) | % | 96.1% | 96.1% |
| Ag Rec (%) | % | 96.4% | 96.4% |
| Zn rec (%) | % | 74.7% | 74.7% |
| Pb Rec (%) | % | 82.0% | 82.0% |
| Metal Production |
| Gold Production | koz | 877 | 2,254 |
| Silver Production | koz | 43,683 | 81,167 |
| Zinc Production | Mlbs | 467 | 931 |
| Lead Production | Mlbs | 219 | 431 |
| Gold-Equivalent Production (Au-eq) | koz | 1,740 | 3,889 |
| Silver-Equivalent Production (Ag-eq) | koz | 121,823 | 272,219 |
| Cost per tonne milled |
| Mining | $/t milled | 51.47 | 43.70 |
| Processing | $/t milled | 18.08 | 17.96 |
| G&A | $/t milled | 5.58 | 5.45 |
| Tailings, Environmental and Water Management Costs | $/t milled | 0.47 | 0.50 |
| Total On-site Operating Costs | $/t milled | 75.60 | 67.61 |
| Product shipping | $/t milled | 38.63 | 34.33 |
| Royalties | $/t milled | 10.65 | 8.00 |
| Mining Tax | $/t milled | 0.34 | 0.32 |
| Total Cash Cost | $/t milled | 125.22 | 110.26 |
| OP Sustaining Capital | $/t milled | 3.08 | 1.44 |
| UG Sustaining Capital | $/t milled | 9.41 | 9.85 |
| TSF Sustaining Capital | $/t milled | 0.95 | 1.00 |
| Total Costs including Sustaining | $/t milled | 138.67 | 122.55 |
| Operating Cost per Ounce |
Total Cash Costs1 | $/oz AuEq | 998 | 1,169 |
Total AISC2 | $/oz AuEq | 1,105 | 1,300 |
AYA GOLD & SILVER INC. 313
1.Cash costs include mine-site operating costs such as mining, processing, and direct site G&A, as well as product shipping, royalties and mining taxes.
2.AISC is calculated as the sum of treatment and refining charges, onsite operating costs, sustaining capital costs, and closure costs, divided by the quantity of ounces equivalent produced.
22.5.2Life of Mine Cash Flow Analysis
Figure 22-2 shows the cumulative and annual cash flow for the project at a base case metal prices.
The cash flows starting for years 13 through 15 relate to closure and environmental monitoring.
Figure 22-2 Annual Free Cash Flow
22.5.3Project Parameter Sensitivities
Sensitivity analysis was carried out to determine the effect of changes to input parameters on the base-case financial model. Each sensitivity analysis was performed independent of others.
An overall Projects Economic Sensitivity based on Gold and Silver Price is shown in Table 22-6 below. The objective was to show a range of possible prices for gold and silver to best show the range of economic viability.
AYA GOLD & SILVER INC. 314
Table 22-6 Project Economics Sensitivity - Gold and Silver Price
| | | | | | | | | | | | | | | | | | | | |
| Parameter | Units | Break-Even1 | - 25% | Base Case | Spot Price2 | Upside |
| Gold Price | $/oz | 1,704 | 2,625 | 3,500 | 4,472 | 5,250 |
| Silver Price | $/oz | 24 | 38 | 50 | 66.85 | 75 |
| Zinc Price | $/lb | 0.90 | 1.03 | 1.37 | 1.77 | 1.71 |
| Lead Price | $/lb | 0.60 | 0.68 | 0.90 | 0.85 | 1.13 |
| NPV5% Post-Tax | $M | 0 | 1,808 | 3,537 | 5,525 | 6,764 |
| IRR Post-Tax | % | - | 57% | 93% | 128% | 147% |
| LOM Revenue | $M | 5,441 | 8,169 | 10,995 | 14,237 | 16,288 |
| LOM EBITDA | $M | 910 | 3,482 | 6,145 | 9,200 | 11,133 |
| FCF-Unlevered Post-Tax | $M | 89 | 2,467 | 4,694 | 7,253 | 8,860 |
| Payback Period Post-Tax | Years | - | 1.3 | 0.7 | 0.5 | 0.4 |
| Capital Efficiency Ratio | - | 0.0 | 3.9 | 7.6 | 11.9 | 14.6 |
1.Gold and silver prices at which NPV5% - post-tax is equal to $0M.
2.Assumed Spot Prices as of September 3, 2026
AYA GOLD & SILVER INC. 315
22.5.3.1Gold and Silver Price Sensitivity Based Parameters
A series of sensitivity analyses were performed at different combinations of gold and silver prices. The ranges are shown in Table 22-6.
Table 22-7 Base Case Prices and Sensitivity Ranges | | | | | | | | | | | |
| Metal Prices | Units | Base Case Price | Sensitivity Range |
| Gold Price | $/oz | $3,500 | $2,750 - $4,250 |
| Silver Price | $/oz | $50 | $28 - $62 |
| Zinc Price | $/lb | $1.37 | - |
| Lead Price | $/lb | $0.90 | - |
The results are shown in Tables 22-7 to 22-10.
Table 22-8 Gold and Silver Price Based IRR - Pre-Tax
| | | | | | | | | | | | | | | | | | | | | | | | | | |
| | Au Price |
| Ag Price | | 2,750 | | 3,000 | | 3,250 | | 3,500 | | 3,750 | | 4,000 | | 4,250 | |
| 38 | 70 | % | 76 | % | 81 | % | 87 | % | 92 | % | 97 | % | 102 | % |
| 42 | 74 | % | 80 | % | 85 | % | 90 | % | 95 | % | 100 | % | 105 | % |
| 44 | 76 | % | 81 | % | 87 | % | 92 | % | 97 | % | 102 | % | 107 | % |
| 50 | 82 | % | 87 | % | 92 | % | 97 | % | 102 | % | 107 | % | 111 | % |
| 54 | 85 | % | 90 | % | 95 | % | 100 | % | 105 | % | 110 | % | 115 | % |
| 58 | 89 | % | 94 | % | 99 | % | 103 | % | 108 | % | 113 | % | 118 | % |
| 62 | 92 | % | 97 | % | 102 | % | 107 | % | 111 | % | 116 | % | 120 | % |
Table 22-9 Gold and Silver Price Based IRR - Post-Tax
| | | | | | | | | | | | | | | | | | | | | | | | | | |
| | Au Price |
| Ag Price | | 2,750 | | 3,000 | | 3,250 | | 3,500 | | 3,750 | | 4,000 | | 4,250 | |
| 38 | 66 | % | 72 | % | 77 | % | 83 | % | 88 | % | 93 | % | 98 | % |
| 42 | 70 | % | 76 | % | 81 | % | 86 | % | 91 | % | 96 | % | 101 | % |
| 44 | 72 | % | 77 | % | 83 | % | 88 | % | 93 | % | 98 | % | 103 | % |
| 50 | 78 | % | 83 | % | 88 | % | 93 | % | 98 | % | 103 | % | 108 | % |
| 54 | 81 | % | 86 | % | 91 | % | 96 | % | 101 | % | 106 | % | 111 | % |
| 58 | 85 | % | 90 | % | 95 | % | 100 | % | 104 | % | 109 | % | 114 | % |
| 62 | 88 | % | 93 | % | 98 | % | 103 | % | 107 | % | 112 | % | 117 | % |
Table 22-10 Gold and Silver Price Based NPV5% Pre-Tax in $M
| | | | | | | | | | | | | | | | | | | | | | | | | | |
| | Au Price |
| Ag Price | | 2,750 | | 3,000 | | 3,250 | | 3,500 | | 3,750 | | 4,000 | | 4,250 | |
| 38 | 2,466 | 2,794 | 3,122 | 3,450 | 3,778 | 4,106 | 4,434 |
| 42 | 2,671 | 2,999 | 3,327 | 3,655 | 3,983 | 4,311 | 4,640 |
| 44 | 2,774 | 3,102 | 3,430 | 3,758 | 4,086 | 4,414 | 4,742 |
| 50 | 3,082 | 3,410 | 3,738 | 4,066 | 4,394 | 4,722 | 5,050 |
| 54 | 3,288 | 3,616 | 3,944 | 4,272 | 4,600 | 4,928 | 5,256 |
| 58 | 3,493 | 3,821 | 4,149 | 4,477 | 4,805 | 5,133 | 5,461 |
| 62 | 3,698 | 4,027 | 4,355 | 4,683 | 5,011 | 5,339 | 5,667 |
AYA GOLD & SILVER INC. 316
Table 22-11 Gold and Silver Price Based NPV5% Post-Tax in $M
| | | | | | | | | | | | | | | | | | | | | | | | | | |
| | Au Price |
| Ag Price | | 2,750 | | 3,000 | | 3,250 | | 3,500 | | 3,750 | | 4,000 | | 4,250 | |
| 38 | 2,194 | 2,463 | 2,732 | 3,001 | 3,270 | 3,539 | 3,808 |
| 42 | 2,373 | 2,642 | 2,911 | 3,179 | 3,448 | 3,717 | 3,986 |
| 44 | 2,462 | 2,731 | 3,000 | 3,269 | 3,538 | 3,807 | 4,076 |
| 50 | 2,730 | 2,999 | 3,268 | 3,537 | 3,805 | 4,074 | 4,343 |
| 54 | 2,908 | 3,177 | 3,446 | 3,715 | 3,984 | 4,253 | 4,522 |
| 58 | 3,087 | 3,356 | 3,625 | 3,894 | 4,163 | 4,431 | 4,700 |
| 62 | 3,265 | 3,534 | 3,803 | 4,072 | 4,341 | 4,610 | 4,879 |
22.5.3.2CAPEX and OPEX Sensitivity Based Parameters
Sensitivity analyses were also evaluated based on capital expenditures and operating expenses.
The results are shown in Tables 22-11 to 22-14.
Table 22-12 CAPEX and OPEX Based IRR - Pre-Tax
| | | | | | | | | | | | | | | | | | | | | | | | | | |
| | CAPEX |
| | -30% | -20% | -10% | 0% | 10% | 20% | 30% |
| OPEX | -30% | 145 | % | 130 | % | 118 | % | 108 | % | 100 | % | 92 | % | 86 | % |
| -20% | 141 | % | 126 | % | 114 | % | 105 | % | 96 | % | 89 | % | 83 | % |
| -10% | 136 | % | 122 | % | 110 | % | 101 | % | 93 | % | 86 | % | 80 | % |
| 0% | 131 | % | 118 | % | 106 | % | 97 | % | 89 | % | 82 | % | 76 | % |
| 10% | 127 | % | 113 | % | 102 | % | 93 | % | 85 | % | 79 | % | 73 | % |
| 20% | 122 | % | 108 | % | 98 | % | 89 | % | 81 | % | 75 | % | 69 | % |
| 30% | 117 | % | 104 | % | 93 | % | 85 | % | 77 | % | 71 | % | 65 | % |
Table 22-13 CAPEX and OPEX Based IRR - Post-Tax
| | | | | | | | | | | | | | | | | | | | | | | | | | |
| | CAPEX |
| | -30% | -20% | -10% | 0% | 10% | 20% | 30% |
| OPEX | -30% | 142 | % | 127 | % | 115 | % | 105 | % | 97 | % | 90 | % | 84 | % |
| -20% | 137 | % | 122 | % | 111 | % | 101 | % | 93 | % | 86 | % | 80 | % |
| -10% | 131 | % | 118 | % | 107 | % | 97 | % | 89 | % | 82 | % | 76 | % |
| 0% | 126 | % | 113 | % | 102 | % | 93 | % | 85 | % | 79 | % | 73 | % |
| 10% | 121 | % | 108 | % | 97 | % | 89 | % | 81 | % | 75 | % | 69 | % |
| 20% | 115 | % | 103 | % | 93 | % | 84 | % | 77 | % | 71 | % | 65 | % |
| 30% | 110 | % | 98 | % | 88 | % | 80 | % | 73 | % | 67 | % | 61 | % |
AYA GOLD & SILVER INC. 317
Table 22-14 CAPEX and OPEX Based NPV5% Pre-Tax in $M
| | | | | | | | | | | | | | | | | | | | | | | | | | |
| | CAPEX |
| OPEX | | -30% | -20% | -10% | 0% | 10% | 20% | 30% |
| -30% | 5,244 | 5,161 | 5,077 | 4,994 | 4,910 | 4,827 | 4,743 |
| -20% | 4,935 | 4,851 | 4,768 | 4,685 | 4,601 | 4,518 | 4,434 |
| -10% | 4,626 | 4,542 | 4,459 | 4,375 | 4,292 | 4,209 | 4,125 |
| 0% | 4,317 | 4,233 | 4,150 | 4,066 | 3,983 | 3,899 | 3,816 |
| 10% | 4,008 | 3,924 | 3,841 | 3,757 | 3,674 | 3,590 | 3,507 |
| 20% | 3,698 | 3,615 | 3,531 | 3,448 | 3,365 | 3,281 | 3,198 |
| 30% | 3,389 | 3,306 | 3,222 | 3,139 | 3,055 | 2,972 | 2,889 |
Table 22-15 CAPEX and OPEX Based NPV5% Post-Tax in $M
| | | | | | | | | | | | | | | | | | | | | | | | | | |
| | CAPEX |
| | -30% | -20% | -10% | 0% | 10% | 20% | 30% |
| OPEX | -30% | 4,544 | 4,461 | 4,377 | 4,294 | 4,210 | 4,127 | 4,044 |
| -20% | 4,292 | 4,208 | 4,125 | 4,041 | 3,958 | 3,875 | 3,791 |
| -10% | 4,039 | 3,956 | 3,872 | 3,789 | 3,706 | 3,622 | 3,539 |
| 0% | 3,787 | 3,703 | 3,620 | 3,537 | 3,453 | 3,370 | 3,286 |
| 10% | 3,534 | 3,451 | 3,367 | 3,284 | 3,201 | 3,117 | 3,034 |
| 20% | 3,282 | 3,198 | 3,115 | 3,032 | 2,948 | 2,865 | 2,781 |
| 30% | 3,029 | 2,946 | 2,863 | 2,779 | 2,696 | 2,612 | 2,529 |
22.6Conclusion
An economic analysis of the mine schedule at the metal base prices shown earlier in Table 22-6 shows the project is financially viable. The project is highly sensitive to the metal price and recovery. However, the project remains economically viable in all sensitivity cases shown in this section.
On a pre-tax basis, the Project has a Net Present Value (NPV) of $4,066M at a discount rate of 5%, an Internal Rate of Return (IRR) of 97%, and a payback period of 0.7 years.
On a post-tax basis, the NPV is $3,537M at a discount rate of 5%, the IRR is 93%, and the payback period is 0.7 years.
AYA GOLD & SILVER INC. 318
23.0ADJACENT PROPERTIES
The following information has been summarised from publicly available information as well as from Aya 2025 PEA.
Several vein occurrences containing Ba, Pb, Cu and Zn, which vary in size and thickness, are recognized regionally. Some of these veins are subject to artisanal exploitation by individuals or small Moroccan companies, as shown in Figure 23‑1. Regionally, the Boumadine Project is located near several mineral deposits and exploration properties that have been historically exploited, are currently in production, under development or subject to ongoing exploration.
The Zgounder Ag Mine, owned and operated by Aya, within the Moroccan Anti-Atlas region, comprises structurally controlled Ag mineralization, with Ag occurring principally as native Ag and Ag-bearing minerals within a structurally complex hydrothermal system. The current NI 43-101 Mineral Resource Estimate, effective 30 June 2025, reports approximately 18.94 Mt of Measured and Indicated Mineral Resources containing approximately 100.3 Moz Ag, together with 0.41 Mt of Inferred Mineral Resources containing approximately 4.5 Moz Ag for both open pit and underground Mineral Resources.
The Imiter Ag Mine, located on the northern side of the Saghro Massif approximately 80 km west of the Boumadine Property, is operated by Société Métallurgique d'Imiter (SMI), a subsidiary of the Managem Group. Imiter comprises structurally controlled, epithermal-style Ag mineralization hosted principally by vein structures.
Publicly available information reported by Managem in its 2024 Annual Financial Report indicates Measured and Indicated Mineral Resources of approximately 11.45 Mt at 407 g/t Ag, together with approximately 14.52 Mt at 98 g/t Ag of Inferred Mineral Resources. The deposit is mined by underground mining methods, however Managem is also developing the Imiter Centre open-pit project.
The Imiter Bis property, located approximately 5 km south of the Imiter Mine, is a separate exploration property comprising two mining licenses covering approximately 27.6 km² and is 100% owned by Aya. Exploration has identified an approximately 4 km-long, structurally controlled polymetallic vein system, typically between 1.5 and 2.0 m thick, but locally reaching up to 10 m, with mineralization comprising Au, Ag, Pb, Zn and Cu. Drilling undertaken during 2021 and 2022 confirmed Au and Ag mineralization across several zones; however, no Mineral Resource Estimate has currently been reported for the property.
The Azegour deposit, located in the Western High Atlas approximately 60 km south of Marrakech, is a historical Cu-Mo-W skarn deposit associated with the intrusion of the Permian Azegour granite into Lower Cambrian carbonate and volcano-sedimentary rocks. Mineralization is hosted principally within metasomatically altered carbonate rocks and comprises molybdenite, chalcopyrite and scheelite, with sulphide mineralization developed predominantly during the retrograde stages of skarn formation. Historical mining produced approximately 900,000 t of ore grading 1.4–2.8% Cu, 0.2–0.7% MoS₂ and approximately 0.35% WO₃. Mining ceased in 1971, although subsequent exploration was undertaken by BRPM. No current Mineral Resource Estimate prepared in accordance with CIM Definition Standards or NI 43-101 has been identified.
The deposits and exploration properties described above demonstrate the variety of precious- and base-metal mineralization present within the broader region, ranging from structurally controlled Ag and polymetallic vein systems at Imiter and Imiter Bis, sediment-hosted stratiform Cu-Ag mineralization at Tirzzit, to intrusion-related skarn mineralization at Azegour.
The Qualified Person has not independently verified the information relating to the adjacent and regional properties described above, and mineralization or Mineral Resources reported for these properties.
AYA GOLD & SILVER INC. 319
Figure 23-1 Location of the Imiter Mine
Source: Aya 2025 PEA
AYA GOLD & SILVER INC. 320
24.0OTHER RELEVANT DATA AND INFORMATION
24.1Project Execution Schedule
The Project Execution Schedule was developed to provide a high level overview of all activities required to complete the project. The project execution plan is summarized and presented in Figure 24-1.
Figure 24-1 Project Execution Schedule
Source: Lycopodium 2026
24.2Pyrite Treatment
While not included within this report, Aya has continued to work on the metallurgical development for a pyrite treatment circuit. A portion of the gold and silver included in Boumadine is refractory to direct cyanide leaching. The refractoriness to cyanidation is due to the high sulfur content in the pyrite concentrate. Boumadine’s gold is in the form of fine grains (below 15 µm) and mainly associated with pyrite. A pre-treatment is necessary to oxidize the sulfur of pyrite prior to cyanide leaching.
Internal and external trade-off studies have indicated that roasting is the best option for pyrite pre-treatment prior to conventional cyanidation. Roasting would allow for reduced tailings generation and lower operating costs while also producing sulfuric acid, for which there is a high demand within the Kingdom of Morocco.
Testwork is on-going to determine optimal conditions for operation of a pyrite roasting plant. A flowsheet has been developed, and engineering will continue to be progressed in parallel to the mine and concentrator
AYA GOLD & SILVER INC. 321
designs. This will provide flexibility for Aya to decide whether it will sell all of the pyrite or if a portion can be strategically treated within the country to produce doré ingots and a sulfuric acid byproduct.
AYA GOLD & SILVER INC. 322
25.0INTERPRETATION AND CONCLUSIONS
25.1Geology
The Boumadine Project is hosted within Neoproterozoic volcanic and volcano-sedimentary rocks of the Tiddiline Formation (TTF) and comprises a structurally controlled polymetallic hydrothermal system developed within a shallow volcanic environment. Mineralization is principally controlled by steeply dipping northwest- to north-northwest-trending fault corridors that are spatially associated with felsic subvolcanic intrusions and hydrothermal breccias. Hydrothermal alteration is extensive and comprises quartz-sericite-pyrite (phyllic) alteration within the felsic volcanic sequence and propylitic alteration within the underlying mafic volcanic rocks, reflecting a long-lived hydrothermal system that evolved during repeated episodes of fault movement and magmatism.
Mineralization comprises steeply dipping massive to semi-massive sulphide veins, hydrothermal breccias, replacement sulphides and pyrite stockwork developed within broad alteration halos. The highest-grade mineralization is typically associated with massive sulphide veins dominated by pyrite, sphalerite, galena, arsenopyrite and chalcopyrite, with surrounding zones of disseminated sulphides and quartz-carbonate veining. Recent drilling and geological studies have demonstrated that mineralization extends into both the felsic and mafic volcanic successions and have refined the structural interpretation of the deposit, providing increased confidence in the geological model and continuity of the principal mineralized corridors. Although the precise genetic classification of the deposit remains under investigation, the 2026 MRE is based on the observed geological, structural and mineralization characteristics and does not depend on any specific genetic model.
The Project is at an advanced stage of exploration and geological understanding, supported by drilling and sampling, geological mapping, orientated core, geophysical surveys, historical mine plans as well as previous geological studies. In addition, no significant issues in the sampling and analysis were identified with the analysis of the QAQC programs. These studies provided confidence to the local scale geometry of the mineralization and grade distributions in the resultant Mineral Resources and has allowed SRK to produce a robust geological model with over 158 individual domains modelled. However, there are areas of lower geological confidence, classified as Inferred Mineral Resources and there are some domains SRK was not able to classify due to limited data. SRK notes that there is a degree of uncertainty associated with depletion survey as-builts and that the most significant underground workings are currently inaccessible.
SRK has declared a Mineral Resource Statement for the Boumadine Project. The Mineral Resources are limited to material contained within the conceptualised open pit shell above the NSR reporting cut-off of 60 USD/t and, below the pit shell, to material contained within grade shells (following the removal of isolated shapes) based on a 110 USD/t NSR cut-off that satisfy a minimum 1.5 m mineable thickness. The Mineral Resources are reported within the Boumadine Mining licence on an in-situ, undiluted basis and amount to:
•Indicated Mineral Resources (open pit and underground) of some 8,582 kt, at a mean grade of 121.7 g/t Ag, 1.9 g/t Au, 0.09 % Cu, 1.01 % Pb and 2.19 % Zn; and
•Inferred Mineral Resources (open pit and underground) of some 45,365 kt, at a mean grade of 56.8 g/t Ag, 1.8 g/t Au, 0.08 % Cu, 0.58 % Pb and 1.33 % Zn.
AYA GOLD & SILVER INC. 323
25.2Mining
The OP mine accounts for 54% of the mineralized material mined (22.4 Mt), at an average NSR value of US$232/t. OP mining extends over eleven years (2029 to 2039) from three pit areas (Central, South and North), with a peak total material movement of 55 Mt/y and a LOM stripping ratio of approximately 23:1. Mining will be carried out by a contractor using a conventional truck and shovel fleet, with 10 m benches near surface and 20 m double benches in rock. Mineralized material will be hauled to three surface stockpiles (Low Grade, LG Pyrite and HG Pyrite), which will be used to regulate plant feed according to operational needs and the overall project strategy.
The UG mine accounts for 46% of the mineralized material mined (18.9 Mt), at an average NSR value of US$147/t. UG development starts in 2031, and production runs from 2032 to 2043 from five surface portals. Mining will be carried out using the modified Avoca method, with stopes 20 m high (floor to floor) and 20 m long, and a minimum mining width of 2.0 m. Material will be hauled by 33 t trucks, via ramps, to the surface stockpiles.
Capital lateral and vertical development will be performed by a contractor, while sill development and all stoping activities will be performed by owner crews.
CCE Mining has identified the following risks associated with the mine plan:
•Pit depth and incremental stripping ratio: the selected pit shells carry high stripping ratios (approximately 24:1 for the Central Pit and 30:1 for the South Pit). With a fixed contractor cost, the incremental stripping ratio at the base of the pits does not currently exceed the breakeven with UG mining. However, that might change if the contractor costs are correlated to haulage distance.
•Historical workings: UG mining between 1986 and 1992 extracted approximately 261 kt from four levels. Until these workings are located and surveyed, uncharted voids within or beneath the Central and South pits and near UG infrastructure represent a safety and design risk.
•Geotechnical data: pit slope and stope design parameters are based on quick-logged exploration core and joint mapping. No dedicated geotechnical drilling or laboratory testing has been completed.
•Hydrogeology: no site-specific hydrogeological investigation has been completed, groundwater inflows have not been estimated, and the dewatering system has been sized from typical operating practice.
•Dependence on rock fill availability for the modified Avoca method: the method relies on a consistent supply of RF and CRF, which requires a robust system for managing waste material, whether generated underground or transported from surface.
•Critical pre-production period: the pre-production phase is essential to the overall success of the project, and a detailed, well-coordinated schedule for this period is crucial.
•Shared underground equipment fleet: sharing mobile equipment between five portal areas may lead to inefficiencies due to travel distances.
•Contractor capacity: the peak OP material movement of 55 Mt/y requires a large contractor fleet. Contractor availability and rates have not yet been confirmed by budget quotations.
CCE Mining has identified the following opportunities:
•Optimizing pit depth and the OP to UG transition could reduce waste movement and advance UG access to higher-grade zones.
•Increasing the UG level spacing beyond 20 m could reduce development requirements, subject to geotechnical confirmation.
AYA GOLD & SILVER INC. 324
•Pit slope angles may be steepened once dedicated geotechnical data are available.
•A battery-electric UG fleet could reduce ventilation airflow requirements and diesel consumption.
•Optimizing the cut-off and stockpile strategy could improve the grade profile of plant feed in the early years.
25.2.1Mining Geotechnical
Project risks and opportunities identified during mining geotechnical evaluations are as follows:
Risks:
•Some major faults have been delineated in the Boumadine geological model, however these do not transect intended production areas. The spatial distribution of adverse geological features is an unknown that will have to be resolved to achieve FS level of study.
•The UG mining depths evaluated are shallower than those in the updated mine plan. Stress magnitudes are likely to be more adverse than those estimated in this study.
Opportunities:
•Reasonable conservatism has been applied to the overall pit slope angle recommendations. There may be opportunity to increase slope angles once additional geotechnical data is available.
•Due to data limitations, reasonably conservative global rock strength values to the design evaluations have been applied. Laboratory testing efforts will substantially improve confidence in material strength parameterization and help to resolve geological controls and spatial variability. Opportunity to increase stope sizing (or reduce dilution expectations) may be resolved from more detailed material strength data.
•In situ stress assumptions applied to stope design are somewhat conservative for the depths considered. Later phases of study should rely on numerical stress modelling to improve confidence in likely induced stress conditions. Opportunity to increase stope sizing (or reduce dilution expectations) may be resolved from more detailed estimates of in situ stresses.
•Longitudinal stoping provides operational flexibility to adjust stope panel lengths, thus there is an opportunity for optimizing design for local variances (good or bad) in ground conditions. This flexibility is particularly important where the deposit body is narrow as production performance in narrow zones is likely to be more sensitive to HW and FW dilution.
25.3Processing
Conclusions from the metallurgical and comminution testwork conducted on the Boumadine deposit include:
•The average BWi from two tests was used in the comminution circuit design (13.1 kWh/t), with the remainder of comminution design criteria estimated from OMC’s database.
•Locked cycle flotation tests with three circuits (Pb, Zn and Py) achieved acceptable recoveries with grades in the salable range required. The lead and zinc circuits performed best with regrind after rougher flotation, including three cleaning stages and one cleaner-scavenger stage.
•Sulfur content can be estimated based on the metals’ content in the material, proven via multilinear regression analysis showing a strong correlation between the laboratory and calculated values (R2 = 0.98). By assuming constant concentrate grades and recoveries, the LOM pyrite concentration production could be estimated based on the sulfur content equation for varying metals’ grades in the deposit.
AYA GOLD & SILVER INC. 325
•The Boumadine mineralized material is highly refractory and resistant to direct cyanidation.
Based on the metallurgical testwork completed thus far, the following unit operations have been selected for the PEA flowsheet:
•Single stage primary crushing to reduce the ROM material size to a P80 of 136 mm.
•Crushed rock stockpile with a live capacity of approximately 8,115 tonnes, allowing for 24 hours of live storage and additional capacity for periods of primary crusher maintenance.
•SAB type grinding circuit consisting of a SAG mill and a ball mill to produce a ground product P80 of 58 microns (µm), with hydrocyclones for particle size classification.
•Lead rougher flotation, classification, regrinding and cleaner flotation to produce a lead concentrate of 29.6% grade. The lead concentrate will be thickened, filtered, and bagged prior to shipment.
•Zinc rougher flotation, classification, regrinding and cleaner flotation to produce a zinc concentrate of 57.4% grade. The zinc concentrate will be thickened and filtered for stockpiling prior to shipment.
•Pyrite rougher flotation to produce a pyrite concentrate with 4.2 Au g/t and 81.0 Ag g/t. The pyrite concentrate will be thickened and filtered for stockpiling prior to shipment.
•Tailings thickening and storage in a tailings management facility.
The process plant operating cost estimate was developed in Q3 2025 using data from database projects, studies, and previous operations by Lycopodium, and Aya Gold & Silver. The operating cost estimate conforms to preliminary economic assessment accuracy of +50%/-30%. The estimate covers general and administrative (G&A), and processing costs. The unit operating cost per tonne of material milled is estimated at US$22.44/t processed.
Lycopodium have identified the following risks for the project:
•Additional variability testing is required focussing on specific pit locations to verify material properties used for design parameters and recovery predictions for the deposit body correlates with the established mine plan.
Thickening and filtration tests should be performed to confirm design assumptions and sizing. The selected filtration technology should also conform to required transport moisture limits yet to be determined.
Filtration of ultrafine material can prove to be challenging possibly requiring the use of drying pads to further reduce product moisture content prior to shipment. The additional material handling is not currently costed and has the potential to impact final product quality if not performed well.
25.4Infrastructure
The Project is supported by a fully integrated site layout including open-pit mines, underground access, processing facilities, and support services.
Site access via the N10 highway through Tinejdad; internal haulage and service roads link pits, portals, ROM pad, process plant, and stockpiles.
Process plant facilities include ROM pad, crushing and feed preparation, flotation plant, concentrate handling, reagent storage, laboratories, workshops, fuel storage, and administration buildings.
Water supply relies on pipelines from nearby towns, boreholes, runoff capture, and an on-site water harvesting reservoir; containerized treatment systems ensure process and potable water quality.
AYA GOLD & SILVER INC. 326
Mining facilities include a 1,000 m² truck shop, low-grade stockpile (3.5 Mt), ROM stockpiles, and two waste rock stockpiles (215 Mm³ total) designed with HDPE liners and conservative geotechnical assumptions.
Tailings management uses a single lined Flotation TSF with downstream raises, internal drainage, storm diversion channels, an emergency basin, and a return water system.
Power supply delivered through a new 220 kV line feeding a 40 MVA substation serving all site loads.
Additional infrastructure includes sewage treatment, security fencing, communications, explosives storage, and limited on-site accommodation supplemented by housing in Tinejdad.
Concentrate transport will be contractor-operated, shipping by road to Nador-West Port with a covered 250,000-t storage facility.
The Authors have identified the following risks associated with the project infrastructure:
The supply of water will rely on off-site sources as the area receives little rainfall annually. It will be important to include redundancy and storage capacity to reduce risks associated with water supply.
The transportation of pyrite will require well-coordinated logistics due to the large quantities of material to transport annually.
25.5Environmental and Social
The biophysical and social characteristics of the planned mining area are defined by its semi-arid climate and relatively rural and remote nature. Urban settlements are concentrated along main transport routes with villages located along valleys with access to water resources. Climatic conditions influence local ecosystems and land uses including agriculture, concentrated in areas of water availability.
Limited environmental studies have been completed in the past. As part of the environmental and social work currently being undertaken, an environmental baseline sampling program was initiated by BGM in September 2024 and a high-level screening for critical biodiversity habitat was undertaken by SLR in September 2024.
The baseline sampling, covering soils, air quality and water, was undertaken by AfriLabs, a Moroccan-based laboratory specializing in mineral and environmental analysis.
Additional baseline surveys have been completed during the course of 2026 covering social, biodiversity, soil, water, air quality and noise. The results are being processed to inform the international ESIA process outlined below. Studies covering the topics of biodiversity, hydrology, hydrogeology, soils and sediments, air quality, noise, GHG, climate change, stakeholder engagement, labour and working conditions, community health and safety, and other social elements are ongoing.
The Project will require national permits to support the development of the mine and the requirement to carry out an Environmental Impact Assessment (EIA) under Moroccan Law. The EIA under Moroccan Law, prepared by NOVEC, was completed and submitted in July 2026 to the “Centre Régional d'Investissement” (CRI) (Regional Investment Center). In addition to meeting national permitting requirements, the Project is being undertaken to meet international ESIA lender standards.
A conceptual mine closure plan governed by Aya’s Environmental Policy will be prepared as part of the ESIA.
25.6Capital Cost Estimate
The preliminary economics of the Boumadine Project can be assessed using the capital and operational cost estimates detailed in this PEA Update. The calculations are based on an open pit and underground mining
AYA GOLD & SILVER INC. 327
operation concept, the development of a processing plant, infrastructure, and the Owner's expenses and provisions.
The capital cost estimate conforms to Class 5 guidelines for a preliminary economic assessment level estimate with a +50%/-30% accuracy according to the Association for the Advancement of Cost Engineering International (AACE International). The capital cost estimate was developed in Q3 2025 and escalated to Q3 2026, based on Lycopodium’s in-house database of projects and studies, experience from similar operations and inputs from WSP and Epoch Resources.
The total initial capital cost for the Boumadine Project is $463 M and the life-of-mine sustaining cost is $507 M.
25.7Operating Cost Estimate
The operating cost estimate was developed in Q3 2025 using data from projects, studies, and previous operations from Lycopodium’s internal database and escalated to Q3 2026, excluding mining, concentrate shipping and TSF operation which were developed by their respective consultants. The operating cost estimate conforms to preliminary economic assessment accuracy of +50%/-30%. The estimate covers the general and administrative (G&A), and mining and processing. The unit operating cost per tonne of material milled is $67.61/t.
25.8Economic Analysis
The economic analysis was performed assuming a 5% discount rate typical for silver-gold projects. Cash flows have been discounted to the start of construction, assuming that the project execution decision will be made, and major project financing will be carried out at this time.
The pre-tax NPV discounted at 5% is $4.1B, with a pre-tax IRR of 97% and payback period of 0.7 years. On an after-tax basis, the NPV discounted at 5% is $3.5B, with an after-tax IRR of 93%, and payback period of 0.7 years. Cumulative after-tax unlevered free cash flow totals $4.7B. Tax calculations are based on Aya’s understanding of current Moroccan tax regulations as of the effective date of this report.
Readers are cautioned that the PEA is preliminary in nature. It includes Inferred Mineral Resources that are considered too speculative geologically to have the economic considerations applied to them that would enable them to be categorized as Mineral Reserves and there is no certainty that the PEA will be realized. Mineral Resources are not Mineral Reserves and do not have demonstrated economic viability.
A summary of the project economics is listed in Table 25-1, and after-tax free cash flow is shown graphically in Figure 25-1.
Table 25-1 Key Economic Results
| | | | | | | | | | | |
| Project Economics | Units | Base Case |
| Pre-tax | Post-tax |
NPV5% | $B | 4.1 | 3.5 |
| IRR | % | 0.97 | 0.93 |
| Payback | Years | 0.7 | 0.7 |
| NPV: Capex | - | 8.6 | 7.6 |
| Revenue LOM | $B | 11.0 | - |
| Avg. Annual Revenue | $M/y | 765 | - |
| EBITDA LOM | $B | 6.1 | - |
| Avg. Annual EBITDA | $M/y | 427 | - |
AYA GOLD & SILVER INC. 328
| | | | | | | | | | | |
| Cumulative FCF LOM | $B | 5.5 | 4.7 |
| Avg. Annual FCF | $M/y | 381 | 327 |
Figure 25-1 Boumadine Project - Annual Free Cash Flow Profile
25.9Conclusion
The Mineral Resources currently estimated for the Boumadine Polymetallic Project consist of:
•An Indicated Mineral Resource of 8.6 Mt grading 121.7 g/t Ag, 1.92 g/t Au, 2.19% Zn and 1.01% Pb containing an estimated 33.6 Moz of Ag, 532 koz of Au, 188 kt of Zn and 87 kt of Pb;
•An Inferred Mineral Resource of 45.4 Mt grading 56.8 g/t Ag, 1.82 g/t Au, 1.33% Zn and 0.58% Pb containing an estimated 82.8 Moz of Ag, 2.7 Moz of Au, 604 kt of Zn and 265 kt of Pb;
•The Updated PEA provides a base case assessment for developing the Boumadine mineral resource by conventional open pit and underground mining methods, and a crushing-milling-flotation processing plant with a tailings dam.
•The Updated PEA economic analysis shows the Boumadine Polymetallic Project has an after-tax NPV5% of $3.5B, IRR of 93%, and a payback period of 0.7 years. The PEA economics support a decision to continue to advance the Project and carry out additional detailed studies, including a pre-feasibility study.
AYA GOLD & SILVER INC. 329
26.0RECOMMENDATIONS
26.1Summary
The results of the Updtaed PEA are sufficiently positive to warrant advancing the Project to the next study phase. It is recommended that the Project advance from the current PEA stage into the subsequent study phases, including Pre-Feasibility work toward a full Feasibility Study. Table 26-1 summarizes the proposed budget to advance the Project through the Feasibility stage.
Table 26-1 Budget for Advancing Project to Next Stages
| | | | | |
| Area | $M, USD |
| MRE Reporting | 0.3 |
| Metallurgical Testwork | 1.3 |
| Processing Plant | 1.4 |
| Mining Consultant and Geotechnical | 1.5 |
| Tailings Storage Facility and Geotechnical | 0.5 |
| Infrastructure | 0.2 |
| Hydrogeology | 1.0 |
| Environmental Studies, Permitting and Social Considerations | 0.7 |
| Contingency | 0.7 |
| Total | 7.5 |
26.2Geology
SRK considers there to be opportunities to further improve confidence in the geological interpretation, MRE, and supporting datasets for the Boumadine Project. SRK recommends that Aya consider the following:
In relation to drilling and geological understanding:
•All drillholes should be designed to intersect the interpreted mineralized wireframes as close to perpendicular as practicable, thereby maximising representivity and location accuracy.
•Continue the ongoing infill drilling program to improve geological and grade continuity that support the conversion of Inferred Mineral Resources to the Indicated category.
•Complete additional twinned diamond drillholes (DD) at representative locations across the deposit, targeting selected existing RC, MP and DD holes completed between 2018 and 2026. Twin holes should be selected to provide representative coverage of the principal mineralised domains, mineralisation styles and grade ranges, one of the target areas should be where different drilling and sampling methods overlap. The twinning programme should be used to assess drilling and sampling precision, identify any systematic bias between drilling methods, quantify short-scale geological and grade variability (including the nugget effect), and provide additional information to support the confidence assigned to the current MRE.
•Complete additional step-out diamond drilling to test the strike and depth extensions of the known massive sulphide domains, where this remains open.
•Aya should investigate whether whole rock geochemistry will help with the identification and standardisation of the lithologies encountered in the drilling.
AYA GOLD & SILVER INC. 330
•Include total sulphur (S%), and where practicable sulphide/sulphate sulphur analyses, within future drilling programs to improve/confirm definition of the oxidation profile and weathering boundary.
In relation to sampling and core management:
•Record the sample weight for every RC drillhole interval (including rejects) and compare this with the theoretical sample mass based on the logged lithology to identify intervals with poor recovery that may require re-drilling.
•Photograph all available drill core and RC chip trays and incorporate these records into the Imago database to establish a comprehensive digital photographic archive.
•Include all drillcore photographs taken prior to 2024 into the Imago database.
•Continue to maintain and periodically review sampling and QA/QC procedures as exploration progresses.
In relation to density:
•Expand the density measurement program, particularly within the mineralized wireframes and transitional (weathered) mineralized zones, to improve the representativeness of the density dataset and reduce reliance on regression-derived density estimates.
•Collect density measurements from drillholes that currently contain no density information and consider obtaining additional measurements from archived drill core where appropriate.
•Consider the use of plastic film or paraffin wax coatings during density determinations to minimize moisture ingress for friable or fractured core.
•Undertake a representative moisture content sampling program using fresh drill core collected from across the Project to improve future mining and processing studies, particularly for the Feasibility Study.
In relation to QA/QC:
•Expand the duplicate QA/QC database to include the complete analytical suite and include the following assays obtained as a minimum, Cu, Pb and Zn prior to the next Mineral Resource update.
•Introduce pulp duplicate samples into the routine QA/QC program.
•Consider introducing a commercially certified blank material or undertake a round-robin program to better characterise the locally sourced blank material.
•Review duplicate records where assay values are missing or recorded as zero and update the database against the original laboratory certificates where appropriate.
•Investigate and correct anomalous CRM assay values, including the Zn CRM records noting as being in excess of 100%.
•Consider discontinuing OREAS 100A, OREAS 354 and OREAS 994 as these are not certified ted for base metal analysis using Aqua regia or for Au and Ag using fire assay analysis.
•Investigate the small number of CRM sample swaps/mislabels that remain within the QA/QC database, resulting either from the mislabelling of original drill core samples or from other QA/QC samples (including CRMS) being incorrectly assigned, and resolve these where possible.
•Continue the routine umpire laboratory program and consider increasing the proportion of samples submitted to the umpire laboratory, including representative samples from the 2024 drilling program.
•Where practicable, ensure that future umpire analyzes use analytical methods with reporting limits comparable to those of the primary laboratory.
•In relation to surveying
AYA GOLD & SILVER INC. 331
•Incorporate the planned high-resolution pre-mining drone survey into future geological models and associated mining studies.
•Where safe and practicable, resurvey historical underground workings (once mining begins) and surface artisanal excavations to improve confidence in future depletion models.
In relation to Resource Estimation:
•Develop a 3D lithological model, subject to the availability of sufficient geological data, to improve geological understanding and support future Mineral Resource, Mineral Reserve, geotechnical, and mine planning studies.
•Undertake a change-of-support study following additional infill drilling to optimize the parent block dimensions and improve future Mineral Resource estimates.
•Incorporate a Mineable Stope Optimizer (MSO) into future Mineral Resource estimates using parameters representative of the proposed underground mining method for Resource reporting.
•Aya should expand its metallurgical test work program to include the weathered/transitional material in order to demonstrate this has reasonable prospects for eventual economic extraction.
In relation to Net Smelter return Calculation and Equivalent cut-off value calculations:
•Aya should review the NSR royalty calculation in future updates so that royalties are applied directly to the relevant concentrate streams and remain linked to the underlying value drivers.
•SRK recommends that Aya model concentrate penalties and deductions separately from treatment charges, using concentrate grades as inputs.
•Aya should consider incorporating freight costs within the NSR calculation in future updates, rather than operating costs, to link these costs directly to the salable concentrate mass.
•Review the concentrate mass calculation methodology to account for the sequential processing flowsheet. Specifically, Pb concentrate should be based on plant feed grades, Zn concentrate should be based on Pb-circuit tailings grades, and pyrite concentrate should be based on Zn-circuit tailings grades. This would affect the calculated mass pull and therefore shipment costs. The difference is expected to be immaterial for Pb and Zn concentrates but may be more relevant for pyrite concentrate.
•SRK recommends calculating the equivalent Ag and Au grades using NSR factors, opposed to the current approach which uses metal prices and metallurgical recoveries only. This approach will avoid any inconsistency with the NSR framework already in place.
SRK has not prepared a detailed exploration budget for the Project but has reviewed the budget and associated schedules provided by Aya. These principally relate to infill drilling intended to upgrade portions of the currently classified Inferred Mineral Resources to Indicated Mineral Resources and support the proposed 15 year life-of-mine plan. Based on Aya's proposed program, approximately 326 000 m of additional drilling is anticipated, with estimated drilling and sampling costs of approximately US$65 million. This cost estimate excludes the multidisciplinary Feasibility Study (FS) planned by Aya for 2027.
26.3Mining
The PEA study has demonstrated the positive potential of the Boumadine Project. Based on these results, CCE recommends that AYA undertake the following work in preparation for the next phase of the project:
•Conduct further geotechnical investigations to validate the data used for pit slope angles, stope design parameters, and ground support parameters.
AYA GOLD & SILVER INC. 332
•Locate, survey and model the historical workings (the 1986 to 1992 stoping on four levels and earlier development):
•Conduct a geotechnical risk assessment to define the level of effort required, including void detection surveys where warranted
•Incorporate the workings into the pit and UG designs and the production schedule
•Conduct a hydrogeological investigation to develop a numerical groundwater model to estimate inflows, size the dewatering system and assess pit slope depressurization requirements.
•Confirm the backfill design:
•Determine the strength parameters required for the CRF and develop an optimized mix design that meets the specified mechanical performance and stability criteria
•Build a year-by-year balance of RF and CRF demand against development and OP waste, assessing backhauling and cement logistics costs and the use of surface backfill raises
•Perform mining method trade-off studies, evaluating the following mining methods against modified Avoca:
•Standard Avoca Method
•Longitudinal longhole stoping with paste fill (top-down sequence and bottom-up sequence), including paste plant and tailings requirements
•Validate development advance rates, stope cycle times, and equipment availability and utilization against Zgounder actuals and industry benchmarks and refine crew sizes accordingly.
•Refine estimates of unplanned dilution and mining recovery for the UG mine based on the selected mining method, site-specific geotechnical conditions and backfill properties.
•Complete an OP dilution and mining recovery study:
•Define grade control drilling and blast movement monitoring practices
•Evaluate options to improve selectivity, such as bench height and equipment size, depending on the outcome of the geotechnical study
•Evaluate the UG level spacing (20 m against 25 m and 30 m), considering development requirements, potential rib pillars, dilution and stope stability.
•Conduct a haulage simulation to confirm truck cycle times, fleet size and ramp capacity over the LOM:
•Include all ramp traffic, ramp designs, and shift and blasting constraints
•Confirm the design haul truck and the corresponding haul road widths
•Identify alternatives to improve production, such as truck bypasses, mineralized material and waste passes for mineralized material, haulage levels or shafts
•Define haulage constraints per pit and portal, and refine haulage costs based on the outcome
•Conduct an OP to UG interface trade-off study, evaluating final pit limit against the selected UG mining method, crown pillar location and the incremental stripping ratio, using the finalized parameters from the work described above.
•Conduct a battery-electric versus diesel trade-off study for the UG fleet, considering ventilation demand, electrical consumption, and capital and operating costs.
AYA GOLD & SILVER INC. 333
•Conduct geochemical testing of the waste rock, including acid-base accounting (ABA), net acid generation (NAG) and kinetic testing.
26.4Processing
The following testwork is recommended to progress the design to the next phase:
•Sample Requirement:
•Spatial composites to represent different physical locations throughout the deposit
•Samples from different zones and depths for variability testing.
•Sufficient sample sizes to conduct downstream testwork.
•Number of representative samples to be determined by AGS.
•Sufficient sample size to generate representative concentrate samples for off-taker evaluation.
•Comminution Testwork:
•Additional tests to determine:
•Crushing work index (CWi)
•SMC parameters: abrasivity (Ai) and impact breakage (A x b)
•BWi (confirmatory)
•Variability of these parameters throughout the deposit and determine correlations to lithology.
•Flotation regrind tests to determine specific energy; engage with vendors for criteria relating to equipment sizing and specifications.
•Ore Characterization Testwork:
•Assess material variability by assaying samples from different zones without blending according to mine plan and to create design ranges.
•Particle size distribution of ROM material and of final concentrates in support of dewatering testwork.
•Rheology testwork to determine apparent viscosities at varying shear rates and varying slurry % solids in support of slurry pipe and pump design.
•Physical characteristics impacting material handling, such as feed moisture content, specific gravity, bulk density, and stacking and clumping / compaction properties.
•Flotation Testwork:
•Variability testing – open circuit and locked cycle to determine the impacts of feed variance and process upsets on grades and recoveries. Develop relations between open circuit and locked cycle results
•Produce enough of each concentrate to support dewatering testwork and further pyrite concentrate treatment testwork.
•Dewatering Testwork:
•Particle settling testwork to determine the flux rate for thickener sizing.
•Flocculant screening tests.
AYA GOLD & SILVER INC. 334
•Filtration testwork to determine:
•Filter type
•Optimum feed pulp density
•Achievable cake moisture levels
•Transport moisture limit targets
•Filter cycle times
•If any filter aids are required.
•Pyrite Concentrate Treatment Testwork:
•Continue development of pyrite oxidation option.
Assess variability of pyrite concentrate via spatial composites and variability testing.
•Water Analysis:
•Surface water quality analysis.
•Ground water quality analysis.
26.5Tailings Storage Facility
The following recommendations were made that are applicable to the next stage of the study, which have begun since the last PEA update and are currently in progress:
•As per Requirement 5.1, a Multiple Accounts Analysis (MAA) should be conducted to assess alternative tailings technologies in the design of the TSF. The selection of an alternative technology to that described in the PEA may alter the cost estimates for the TSF, as well as for that of the tailings processing and TSF conveyance system.
•The appropriate site location selected for the TSF should be confirmed during the MAA, incorporating the input from experts in the relevant fields, including environmental, social, process, etc, to assess the consequences of hazards posed by the TSF. The selection of an alternative site location to that described in the PEA may alter the cost estimates for the TSF, as well as that of the tailings conveyance system.
The following recommendations are made that are applicable to the next stage of the study, following the MAA:
•The following design aspects of TSF, documented by GCIM, may be reviewed in the next stage of the study and may impact the TSF CAPEX estimate:
•Investigate the suitability of a single 2mm HDPE liner, incorporating the consideration of the permeability of the material upon which it is installed, to mitigate seepage in the case of a liner leak,
•Investigate the suitability of the inclusion of the geotextile beneath the liner. This entails considering both the use as a liner protection measure as well as the resulting seepage in the case of a liner leak,
•Significant floods are generated by the catchments upstream of the TSF. As stated by GCIM, the design of the storm diversion channels is required, adequately sized to cater for the design floods, and
•Sizing of the return water and emergency basins based on a monthly TSF pool water balance.
AYA GOLD & SILVER INC. 335
26.6Environmental and Social
As part of the ESIA, potential impacts associated with the Project will be identified and assessed in a systematic approach. The impact assessment will inform a comprehensive Environmental and Social Management and Monitoring Plan to be developed for the Project. It will include:
•Mitigation measures for construction, operations and decommissioning
•Framework management plans covering biodiversity, erosion and sediments, waste, air and noise, water, community health and safety, community development and investment, supply chain, cultural heritage, rehabilitation and closure
•Stakeholder engagement plan including grievance management
•Monitoring plans for Project performance and the receiving environment (water, air, noise and biodiversity) including social aspects
Water management planning will continue to include the following elements:
•Characterization of the groundwater systems on site
•Environmental testwork to understand the geochemical composition and acid generating potential of the host rock and mineral residues
•Development of a site-wide climatic water balance to understand the water circuit and confirm water use, storage and discharge volume requirements.
•Establishment of an engineered stormwater runoff system catering for the diversion of clean water runoff around Project sites, separation of clean and potentially dirty water runoff on site, storage of potentially dirty water runoff in appropriately designed and engineered facilities, and collection and re-use of potentially dirty water runoff.
•Flood protection analysis and measures, if needed.
•Prioritizing water reuse and recycling.
•Water treatment for potable water supply, raw water supply, and discharge to the environment (if discharge is required).
26.7Project Next Phases
To progress the project, it is recommended to conduct pre-feasibility level trade offs, design, and engineering to improve the accuracy of cost estimation. This shall include optimizing the mine plan, updating the process design using results from additional metallurgical test data, and conduct engineering of other disciplines such as mechanical, civil, structural and electrical engineering producing MTOs. The information from this phase of project will then feed into a Feasibility Study.
The advancement to a Feasibility Study will be dependent on project economics from pre-feasibility level designs and progress of drilling to advance classification of resources.
AYA GOLD & SILVER INC. 336
27.0REFERENCES
•Abia, E.H., Nachit, H., Ibhi, A. and Baroudi, Z. 1999. Les Minéralisations Filoniennes à Pb, Zn et Cu de la Boutonnière de l'Ougnat. Relations avec les Déformations et Essai de Calage Chronologique. Chronique Recherche Minière 536, p. 83-95.
•Abia, E.H., Nachit, H., Christian Marignac, C., Abderrahmane, I. and Saadi, S.A. 2003. The Polymetallic Au–Ag-Bearing Veins of Bou Madine (Jbel Ougnat, eastern Anti-Atlas, Morocco): Tectonic Control and Evolution of a Neoproterozoic Epithermal Deposit. Journal of African Earth Sciences 36, 251-271.
•Ait Saadi. 1992. Contribution à l’étude de l’environnement paléovolcanique du Protérozoique Supérieur (PIII) et du mode de genèse des concentrations polymétalliques (Zn, Pb, Cu, Ag, Au) de Bou Madine (Ougnat, Anti-Atlas oriental, Maroc). Unpublished Thesis, University of INPL, Nancy, p. 218.
•Alansari A. and Sagon JP. 1997. Le gisement de Tiouit (Jebel Saghro, Anti-Atlas, Maroc): un système mésothermal polyphasé à sulfures-or et hématite-or dans une granodiorite potassique d’âge Protérozoîque. Chron Recherche Minière 527, 3-25.
•Alfieris, D. Voudouris, P. and Spry, P.G. 2013. Shallow submarine epithermal Pb-Zn-Cu-Au-Ag-Te mineralization on western Milos Island, Aegean Volcanic Arc, Greece: Mineralogical, geological and geochemical constraints. Ore Geology Reviews 53, 159-180.
•Aya Gold & Silver 2025. NI 43-101 Technical Report and Updated Mineral Resource Estimate of the Boumadine Polymetallic Project, Kingdom of Morocco. Prepared for Aya Gold & Silver Inc. by Lalonde, D, and Pérez, P. Effective Date: February 24, 2025. Issue Date : March 31, 2025. 193 p.
•Aya Gold & Silver 2025b. NI 43-101 Technical Report. Preliminary Economic Assessment for the Boumadine Polymetallic Project, Kingdom of Morrocco. Prepared for Aya Gold & Silver Inc. Prepared by Lalonde, D, Pérez, P, Beaudoin, R, Humphrey, Nayak, P., Venter, R., Shaikh, Z., Berson, B., Pheiffer, A., Papageorgiou, G., Puritch, E., Yassa, A., Brown, F., Barry, J., Stone, W. and Palleske, C R. Effective Date: November 4, 2025. Issue Date: December 18, 2025. 343 p.
•Aya Gold & Silver 2025b. NI 43-101 Technical Report. Updated Mineral Resource and ineral Reserve Assessment for the Zgounder Silver Mine Operation, Kingdom of Morrocco. Prepared for Aya Gold & Silver Inc. Prepared by Lalonde, D, Pérez, P, Beaudoin, R, Humphrey, S, vilder, D, Preetham, N, Venter, R. Issue Date: December 16, 2025.. 337 p.
•Aya Gold & Silver Inc. 2026. Imiter Bis Project. Company website, accessed September 2026.
•Aya Gold & Silver Inc. 2026. Zgounder Silver Mine. Company website, accessed September 2026.
•BGRIMM Technology Group. 2025. Research Report on the Small-Scale Test Project on Roasting and Cyanidation of Boumadine Pyrite Concentrate. Prepared for Boumadine Global Mining S.A. Dated October 22, 2025. 67 pages.
•Boily, M. 2014. The Boumadine Polymetallic (Au, Ag, Zn, Pb, Cu) Deposit Errachidia Province, Kingdom of Morocco. Prepared for Maya Gold and Silver Inc. by Michel Boily, Ph.D., P.Geo. of Geon Ltee, dated April 2, 2014. 217 pages.
•Bouabdellah, M., Chekroun, F., Alansari, A. and Margoum, D. 2016. The Granitoid-Related Tiouit Gold Deposit, Saghro Inlier, Eastern Anti-Atlas (Morocco): Neoproterozoic Mineralization by a polyphase Late-Magmatic to Hydrothermal System. In M. Bouabdellah and J.F. Slack (eds), Mineral Deposits of North Africa.
•Bouabdellah, M. and Levresse, G. 2016. The Boumâadine Polymetallic Ore Deposit, Eastern Anti-Atlas, Morocco: Evolution from massive Fe-As-Sn to epithermal Au-Ag-Zn±Cu mineralization in a Neoproterozoic
AYA GOLD & SILVER INC. 337
resurgent Caldera environment. In Mineral Deposits of North Africa: Cham, Switzerland, Springer International Publishing, 133–142.
•Boumadine PEA Recommandation Technique : Sélection de Méthode de minage – Open Pit vs Underground. Submitted to Aya Silver & Gold Inc. on 28 July 2025.
•Boumadine_ Mining_Design Basis & Criteria. Submitted to Aya Silver & Gold Inc. on 24 September 2025
•BRPM. 1998. Gisement Polymétallique de Boumadine. Géologie et États des Réserves. BRPM, 30 p.
•Broothaers, L. 1977. Etude metallogenique du minerai de fer oolithique ordovicien de Imi N’Tourza (Sud Marocain). Notes Mem. Serv. Geol. Maroc, 263, 114 p.
•Chaker, M. 1997. Géochimie et Métallogénie de la mine d’or de Tiouit, Anti-Atlas oriental, Sud du Maroc. Thèse doctorat de 3ème cycle, Université de Quebec à Chicoutimi, 276 p.
•Cheilletz, A., Levresse, G., Gasquet, D., Azizi Samir, M.R., Zyadi, R. and Archibald, D. 2002. The Imiter epithermal silver deposit: a giant Neoproterozoic epithermal mineralization in the Anti-Atlas, Morocco. Mineralium Deposita 37, 772–781.
•Choubert G. 1947. GEOLOGIE-L’ACCIDENT MAJEUR DE L’ANTI-ATLAS. C R Hebd Seances Acad Sci 224, 1172–1173.
•Choubert G. 1963. Histoire géologique du Précambrien de l’Anti-Atlas. Notes et Mémoires du Service Géologique. Rabat, Morocco.
•CINF Engineering Co. Ltd. 2017. Morocco Au Leaching Test Report
•Corbett, G. 2009. Anatomy of Porphyry-related Au-Cu-Ag-Mo Mineralised Systems: Some Exploration Implications: Australian Institute of Geoscientists North Queensland Exploration Conference, dated June 2009.
•El Hadi H, Simancas JF, Martínez-Poyatos D et al. 2010. Structural and geochronological constraints on the evolution of the Bou Azzer Neoproterozoic ophiolite (Anti-Atlas, Morocco). Precambrian Res 182: p. 1–14. Doi:10.1016/j.precamres.2010.06.011.
•Epoch, Pre-Economic Assessment of the Boumadine Tailings Storage Facilities, Report No.: 255-100-REP-0-02-10-2024, Submitted to Aya Silver & Gold Inc. on December 9, 2024.
•Epoch, Updated to the Pre-Economic Assessment of the Boumadine Tailings Storage Facilities, Report No.: 255-100-REP-0-02-10-2024, Submitted to Aya Silver & Gold Inc. on November 20, 2025.
•Freton, R. 1988. Contribution à l’Étude Métallogénique ou District de Bou-Madine Anti-Atlas, Maroc, Environnement Tectonique et Concentrations Épithermales B.P.G.C à Ag et Au. Thèse de Doctorat, Institut National Polytechnique de Lorraine de Géologie Appliquée et de Prospection Minière, 63 pages.
•Gaboury, D. (2022a). Gisement polymétallique Boumadine (Au-Ag-Zn-Pb), Maroc : Contexte géologique et implications pour l’exploration. Rapport interne soumis à Aya Gold and Silver, 12 May 2022, 40 p.
•Gaboury, D. (2022b). Gisement polymétallique Boumadine (Au-Ag-Zn-Pb), Maroc : Revue de sondages sélectionnés de 2022 et bordures Sud et Ouest de la caldeira. Rapport interne soumis à Aya Gold and Silver, 15 December 2022, 52 p
•Gaboury, D. (2023a). Gisement polymétallique Boumadine (Au-Ag-Zn-Pb), Maroc : facteurs d’enrichissement en Zn et Au des minéralisations à sulfures. Report prepared for Aya Gold & Silver Inc., final version dated 5 August 2023, 50 p.
AYA GOLD & SILVER INC. 338
•Gaboury, D. (2023b). Modèle régional de minéralisation à proximité du gisement polymétallique Boumadine (Au-Ag-Zn-Pb), Maroc. Report prepared for Aya Gold & Silver Inc., first version dated 22 November 2023, 40 p.
•Gaboury, D. (2023c). Transition latérale des styles de minéralisations polymétalliques, gisement Boumadine (Au-Ag-Zn-Pb), Maroc. Report prepared for Aya Gold & Silver Inc., second version dated 29 December 2023, 31 p.
•Gaboury, D. (2025a). Rapport sur les forages aux extrêmes Nord, Sud et Ouest, et en périphérie du BOU-DD22-036, gisement Boumadine (Au-Ag-Zn-Pb), Maroc. Report prepared for Aya Gold & Silver Inc., final version dated 5 June 2025, 28 p.
•Gaboury, D. (2025b). Étude des forages : BOU-DD25-600 (exploration Tanda), BOU-DD25-564 (forage profond zone centre), BOU-DD24-461, 463 (zones anomaliques en or). Report prepared for Aya Gold & Silver Inc., preliminary version dated 30 June 2025, 24 p.
•Gaboury, D. (2025c). Mise en contexte géologique et potentiel des permis régionaux, projet Boumadine, Maroc. Report prepared for Aya Gold & Silver Inc., final version dated 14 August 2025, 80 p.GCIM, Boumadine Project, TSF Preliminary Economic Assessment - Rapport du PEA du TSF Flottation Option 18.6 MT. September 17, 2025.
•GCIM, Boumadine Project, TSF Preliminary Economic Assessment - Rapport du PEA du TSF Flottation Option 18.6 MT. September 17, 2025
•GCIM, Boumadine Project, Alimentation en eau du Projet Boumadine - Evaluation Économique Préliminaire - Rapport Alimentation en eau. October 31, 2024
•Hannington, M.D., De Ronde, C.E.J. and Petersen, S. 2005. Seafloor Tectonics and Submarine Hydrothermal Systems. Economic Geology 100th Anniversary Volume, 111-142.
•Hefferan K, Soulaimani A, Samson SD et al. 2014. A reconsideration of Pan African orogenic cycle in the Anti-Atlas Mountains, Morocco. Journal of African Earth Sciences 98, 34–46. Doi:10.1016/j. jafrearsci.2014.03.007 Paile Y., Paris XI , Orsay, France, (1983) 290.
•Leistel, J.M. and Qadrouci, A. 1991. Le gisement argentifère d’Imiter (Protérozoîque supérieur de l’Anti-Atlas, Maroc). Contrôles des minéralisations, hypothèse génétique et perspectives pour l’exploration. Chron Rech Min 502, 5–22.
•Lelièvre, J. 2011. Essais minéralurgiques sur les résidus miniers du site Boumadine, Maroc – URSTM Rapport PU-2011-02-586.
•Levresse, G. 2001. Contribution à l’établissement d’un modèle génétique des gisements d’Imiter (Ag–Hg), Bou Madine (Pb –Zn –Cu –Ag–Au) et Bou Azzer (Co –Ni –As–Au –Ag) dans l’Anti-Atlas marocain. Unpubl. Ph.D. thesis, INPL, Nancy, France.
•Levresse, G., Cheilletz, A., Gasquet, D., Reisberg, L., Deloule, E., Marty, B. and Kyser, K. 2004. Osmium, sulphur, and helium isotopic results from the giant Neoproterozoic epithermal Imiter silver deposit, Morocco: evidence for a mantle source. Chemical Geology 207, 59-79.
•Maya – Boumadine – 500 TPD Polymetallic Ore Flotation Processing Flow – PDF File Shandong Xinhai Mining Machinery, No date.
•Mouttaqi, A., Rjimati, E.C. ., Maacha, L., Michard, A., Soulaimani, A. and Ibouh, A. 2001. LES PRINCIPALES MINES DU MAROC/Main Mines of Morocco, NOTES ET MÉMOIRES DU SERVICE GÉOLOGIQUE N° 564 Volume 9.
AYA GOLD & SILVER INC. 339
•Ouguir, H., Macaudière J., Dagallier G., Qadrouci A. and Leistel J.M. 1994. Cadre structural du gîte Ag-Hg d’Imiter (Anti-Atlas, Maroc); Implication métallogénique. Bull. Soc. Géol. Fr. 165, 233–248.
•P&E Mining Consultants Inc. 2024. NI 43-101 Technical Report and updated Mineral Resource Estimate of the Boumadine Polymetallic Project, Kingdom of Morocco. Prepared for Aya Gold & Silver Inc. by Stone, W., Brown, F., Barry, J., Yassa, A., Feasby, G. and Puritch, E. Effective Date: May 08, 2024. Issue Date : May 31, 2024. 214 p.
•Paile, Y. 1983. Etude des séries volcaniques du Précambrien III de l'Ougnat (Anti-Atlas oriental, Maroc) et de ses minéralisations plombo-zincifères complexes associées (Gîte de Bou Madine), Thèse 3ème cycle, Université Paris, Orsay. 290 pages.
•Popov, A. and Belkasmi, A. 1983. Gisement de cuivre d’Oumjrane-Boukerzia. Rapport interne BRPM, 7 p. in Mouttaqi et al., 2001.
•Rapport sur les essais en laboratoire sur les échantillons du résidu de la mine Boumadine au Maroc. Nichromet Extraction Inc. 31 mai 2013.
•Read, J., & Stacey, P. (2009). Guidelines for open pit slope design. 496p. CRC Press/Balkema: Leiden.
•RockEng, Boumadine Project PEA Geomechanics. Report #24017-102. Submitted to Aya Silver & Gold Inc. on 30 January 2025.
•SCX Technology, Étude logistique du transport en vrac de minerai , October 2025
•SGS. 2018a. Memo Report, June 20, 2018.
•SGS. 2018b. An Investigation into the recovery of gold and silver from Boumâadine. Prepared for Maya Gold & Silver Inc - Project 16525-001A and 16525-02 – Final Report – December 18, 2018.
•SGS. 2022. An investigation into Metallurgical Testing of a Main Composite from the Boumadine Deposit. Prepared for Aya Gold & Silver Inc – Project 18098-01 – Final Report – Revision 1. Dated July 14, 2022. 233 pages.
•SGS. 2024. An investigation into the Boumaadine Deposit. Prepared for Boumadine Global Mining - Project 18098-02 - Final Report. Dated July 12, 2024. 287 pages.
•Sillitoe, R.H. 2010. Porphyry copper systems. Economic Geology 105, 3-41.
•Soulaimani A, Michard A, Ouanaimi H et al. 2014. Late Ediacaran–Cambrian structures and their reactivation during the Variscan and Alpine cycles in the Anti-Atlas (Morocco). Journal of African Earth Sciences 98, 94–112. Doi :10.1016/j.jafrearsci.2014.04.025.
AYA GOLD & SILVER INC. 340
28.0CERTIFICATES
AYA GOLD & SILVER INC. 341
AYA GOLD & SILVER INC. 342
AYA GOLD & SILVER INC. 343
AYA GOLD & SILVER INC. 344
AYA GOLD & SILVER INC. 345
AYA GOLD & SILVER INC. 346
AYA GOLD & SILVER INC. 347
AYA GOLD & SILVER INC. 348
AYA GOLD & SILVER INC. 349
AYA GOLD & SILVER INC. 350
AYA GOLD & SILVER INC. 351
AYA GOLD & SILVER INC. 352
AYA GOLD & SILVER INC. 353
AYA GOLD & SILVER INC. 354
AYA GOLD & SILVER INC. 355
Appendix AQAQC CRM PLOTS
CRM plots with certified values include only, includes four acid digestion. In some cases CRM’s with extreme values relating to mis-labelling or sample swaps have been removed from the images below.
AYA GOLD & SILVER INC., BOUMADINE POLYMETALLIC PROJECT 356
AYA GOLD & SILVER INC., BOUMADINE POLYMETALLIC PROJECT 357
AYA GOLD & SILVER INC., BOUMADINE POLYMETALLIC PROJECT 358
AYA GOLD & SILVER INC., BOUMADINE POLYMETALLIC PROJECT 359
AYA GOLD & SILVER INC., BOUMADINE POLYMETALLIC PROJECT 360
AYA GOLD & SILVER INC., BOUMADINE POLYMETALLIC PROJECT 361
AYA GOLD & SILVER INC., BOUMADINE POLYMETALLIC PROJECT 362
AYA GOLD & SILVER INC., BOUMADINE POLYMETALLIC PROJECT 363
AYA GOLD & SILVER INC., BOUMADINE POLYMETALLIC PROJECT 364
AYA GOLD & SILVER INC., BOUMADINE POLYMETALLIC PROJECT 365
AYA GOLD & SILVER INC., BOUMADINE POLYMETALLIC PROJECT 366
AYA GOLD & SILVER INC., BOUMADINE POLYMETALLIC PROJECT 367
AYA GOLD & SILVER INC., BOUMADINE POLYMETALLIC PROJECT 368
AYA GOLD & SILVER INC., BOUMADINE POLYMETALLIC PROJECT 369
AYA GOLD & SILVER INC., BOUMADINE POLYMETALLIC PROJECT 370
AYA GOLD & SILVER INC., BOUMADINE POLYMETALLIC PROJECT 371
AYA GOLD & SILVER INC., BOUMADINE POLYMETALLIC PROJECT 372
AYA GOLD & SILVER INC., BOUMADINE POLYMETALLIC PROJECT 373
AYA GOLD & SILVER INC., BOUMADINE POLYMETALLIC PROJECT 374
AYA GOLD & SILVER INC., BOUMADINE POLYMETALLIC PROJECT 375
AYA GOLD & SILVER INC., BOUMADINE POLYMETALLIC PROJECT 376
AYA GOLD & SILVER INC., BOUMADINE POLYMETALLIC PROJECT 377
AYA GOLD & SILVER INC., BOUMADINE POLYMETALLIC PROJECT 378
AYA GOLD & SILVER INC., BOUMADINE POLYMETALLIC PROJECT 379
AYA GOLD & SILVER INC., BOUMADINE POLYMETALLIC PROJECT 380
AYA GOLD & SILVER INC., BOUMADINE POLYMETALLIC PROJECT 381
AYA GOLD & SILVER INC., BOUMADINE POLYMETALLIC PROJECT 382
AYA GOLD & SILVER INC., BOUMADINE POLYMETALLIC PROJECT 383
AYA GOLD & SILVER INC., BOUMADINE POLYMETALLIC PROJECT 384
AYA GOLD & SILVER INC., BOUMADINE POLYMETALLIC PROJECT 385
AYA GOLD & SILVER INC., BOUMADINE POLYMETALLIC PROJECT 386
AYA GOLD & SILVER INC., BOUMADINE POLYMETALLIC PROJECT 387
AYA GOLD & SILVER INC., BOUMADINE POLYMETALLIC PROJECT 388
AYA GOLD & SILVER INC., BOUMADINE POLYMETALLIC PROJECT 389
AYA GOLD & SILVER INC., BOUMADINE POLYMETALLIC PROJECT 390
AYA GOLD & SILVER INC., BOUMADINE POLYMETALLIC PROJECT 391
AYA GOLD & SILVER INC., BOUMADINE POLYMETALLIC PROJECT 392
AYA GOLD & SILVER INC., BOUMADINE POLYMETALLIC PROJECT 393
AYA GOLD & SILVER INC., BOUMADINE POLYMETALLIC PROJECT 394
AYA GOLD & SILVER INC., BOUMADINE POLYMETALLIC PROJECT 395
AYA GOLD & SILVER INC., BOUMADINE POLYMETALLIC PROJECT 396
AYA GOLD & SILVER INC., BOUMADINE POLYMETALLIC PROJECT 397
AYA GOLD & SILVER INC., BOUMADINE POLYMETALLIC PROJECT 398
AYA GOLD & SILVER INC., BOUMADINE POLYMETALLIC PROJECT 399
AYA GOLD & SILVER INC., BOUMADINE POLYMETALLIC PROJECT 400
AYA GOLD & SILVER INC., BOUMADINE POLYMETALLIC PROJECT 401
AYA GOLD & SILVER INC., BOUMADINE POLYMETALLIC PROJECT 402
AYA GOLD & SILVER INC., BOUMADINE POLYMETALLIC PROJECT 403
AYA GOLD & SILVER INC., BOUMADINE POLYMETALLIC PROJECT 404
AYA GOLD & SILVER INC., BOUMADINE POLYMETALLIC PROJECT 405
AYA GOLD & SILVER INC., BOUMADINE POLYMETALLIC PROJECT 406
AYA GOLD & SILVER INC., BOUMADINE POLYMETALLIC PROJECT 407
AYA GOLD & SILVER INC., BOUMADINE POLYMETALLIC PROJECT 408
AYA GOLD & SILVER INC., BOUMADINE POLYMETALLIC PROJECT 409
AYA GOLD & SILVER INC., BOUMADINE POLYMETALLIC PROJECT 410
AYA GOLD & SILVER INC., BOUMADINE POLYMETALLIC PROJECT 411
AYA GOLD & SILVER INC., BOUMADINE POLYMETALLIC PROJECT 412
AYA GOLD & SILVER INC., BOUMADINE POLYMETALLIC PROJECT 413
AYA GOLD & SILVER INC., BOUMADINE POLYMETALLIC PROJECT 414
AYA GOLD & SILVER INC., BOUMADINE POLYMETALLIC PROJECT 415
AYA GOLD & SILVER INC., BOUMADINE POLYMETALLIC PROJECT 416
AYA GOLD & SILVER INC., BOUMADINE POLYMETALLIC PROJECT 417
AYA GOLD & SILVER INC., BOUMADINE POLYMETALLIC PROJECT 418
AYA GOLD & SILVER INC., BOUMADINE POLYMETALLIC PROJECT 419
AYA GOLD & SILVER INC., BOUMADINE POLYMETALLIC PROJECT 420
AYA GOLD & SILVER INC., BOUMADINE POLYMETALLIC PROJECT 421
AYA GOLD & SILVER INC., BOUMADINE POLYMETALLIC PROJECT 422
AYA GOLD & SILVER INC., BOUMADINE POLYMETALLIC PROJECT 423
AYA GOLD & SILVER INC., BOUMADINE POLYMETALLIC PROJECT 424
AYA GOLD & SILVER INC., BOUMADINE POLYMETALLIC PROJECT 425
AYA GOLD & SILVER INC., BOUMADINE POLYMETALLIC PROJECT 426
Appendix BSTATISTICAL VALIDATION - UNCAPPED VS CAPPED COMPOSITES
Uncapped composites vs capped composites
| | | | | | | | | | | | | | | | | | | | | | | | | | |
| Domain | Element | Uncapped comps mean | Uncapped comps COV | Capped comps mean | Capped comps COV | St difference (mean) | % Difference (mean) | Straight difference (COV) |
| 1003 | Ag (g/t) | 44.31 | 2.25 | 44.31 | 2.25 | 0 | 0 | 0 |
| 1003 | Au (g/t) | 0.56 | 1.25 | 0.56 | 1.25 | 0 | 0 | 0 |
| 1003 | Pb (%) | 0.42 | 1.69 | 0.42 | 1.69 | 0 | 0 | 0 |
| 1003 | Zn (%) | 1.87 | 2.28 | 1.87 | 2.28 | 0 | 0 | 0 |
| 1003 | Cu (%) | 0.09 | 1.5 | 0.09 | 1.49 | 0 | 0 | -0.01 |
| 1003 | Fe (%) | 17.31 | 1.74 | 17.31 | 1.74 | 0 | 0 | 0 |
| 1004 | Ag (g/t) | 65.42 | 0.93 | 65.42 | 0.93 | 0 | 0 | 0 |
| 1004 | Au (g/t) | 0.35 | 0.92 | 0.35 | 0.92 | 0 | 0 | 0 |
| 1004 | Pb (%) | 1.79 | 1.27 | 1.79 | 1.27 | 0 | 0 | 0 |
| 1004 | Zn (%) | 2.57 | 0.71 | 2.57 | 0.71 | 0 | 0 | 0 |
| 1004 | Cu (%) | 0.06 | 1.4 | 0.06 | 1.4 | 0 | 0 | 0 |
| 1004 | Fe (%) | 14.52 | 0.87 | 13.01 | 0.76 | -1.51 | -0.1 | -0.1 |
| 1005 | Ag (g/t) | 73.82 | 0.92 | 73.82 | 0.92 | 0 | 0 | 0 |
| 1005 | Au (g/t) | 0.47 | 0.53 | 0.47 | 0.53 | 0 | 0 | 0 |
| 1005 | Pb (%) | 0.27 | 0.37 | 0.27 | 0.37 | 0 | 0 | 0 |
| 1005 | Zn (%) | 1.05 | 0.37 | 1.05 | 0.37 | 0 | 0 | 0 |
| 1005 | Cu (%) | 0.03 | 0.9 | 0.03 | 0.9 | 0 | 0 | 0 |
| 1005 | Fe (%) | 10.88 | 0.77 | 10.88 | 0.77 | 0 | 0 | 0 |
| 1006 | Ag (g/t) | 30.75 | 0.65 | 30.75 | 0.65 | 0 | 0 | 0 |
| 1006 | Au (g/t) | 0.38 | 0.8 | 0.38 | 0.8 | 0 | 0 | 0 |
| 1006 | Pb (%) | 0.45 | 0.74 | 0.45 | 0.74 | 0 | 0 | 0 |
| 1006 | Zn (%) | 1.45 | 0.75 | 1.45 | 0.75 | 0 | 0 | 0 |
| 1006 | Cu (%) | 0.02 | 0.71 | 0.02 | 0.71 | 0 | 0 | 0 |
| 1006 | Fe (%) | 11.99 | 0.97 | 11.99 | 0.97 | 0 | 0 | 0 |
| 1007 | Ag (g/t) | 200.32 | 1.61 | 177.74 | 1.57 | -22.58 | -0.11 | -0.05 |
| 1007 | Au (g/t) | 0.64 | 0.58 | 0.64 | 0.58 | 0 | 0 | 0 |
| 1007 | Pb (%) | 0.53 | 0.94 | 0.53 | 0.94 | 0 | 0 | 0 |
| 1007 | Zn (%) | 2.51 | 1.37 | 2.51 | 1.37 | 0 | 0 | 0 |
| 1007 | Cu (%) | 0.23 | 1.41 | 0.23 | 1.41 | 0 | 0 | 0 |
| 1007 | Fe (%) | 14.65 | 0.63 | 13.61 | 0.55 | -1.04 | -0.07 | -0.08 |
| 1011 | Ag (g/t) | 57.16 | 0.72 | 57.16 | 0.72 | 0 | 0 | 0 |
| 1011 | Au (g/t) | 1.59 | 0.95 | 1.59 | 0.95 | 0 | 0 | 0 |
| 1011 | Pb (%) | 0.47 | 0.69 | 0.47 | 0.69 | 0 | 0 | 0 |
| 1011 | Zn (%) | 0.92 | 0.73 | 0.92 | 0.73 | 0 | 0 | 0 |
| 1011 | Cu (%) | 0.03 | 0.89 | 0.03 | 0.89 | 0 | 0 | 0 |
| 1011 | Fe (%) | 35.59 | 0.87 | 35.59 | 0.87 | 0 | 0 | 0 |
| 1012 | Ag (g/t) | 129.23 | 0.38 | 129.23 | 0.38 | 0 | 0 | 0 |
| 1012 | Au (g/t) | 1 | 0.86 | 1 | 0.86 | 0 | 0 | 0 |
| 1012 | Pb (%) | 1.24 | 0.86 | 1.24 | 0.86 | 0 | 0 | 0 |
| 1012 | Zn (%) | 2.26 | 0.93 | 2.26 | 0.93 | 0 | 0 | 0 |
| 1012 | Cu (%) | 0.31 | 0.63 | 0.31 | 0.63 | 0 | 0 | 0 |
| 1012 | Fe (%) | 22.78 | 0.46 | 22.78 | 0.46 | 0 | 0 | 0 |
| 1013 | Ag (g/t) | 29.75 | 0.7 | 29.75 | 0.7 | 0 | 0 | 0 |
AYA GOLD & SILVER INC., BOUMADINE POLYMETALLIC PROJECT 427
| | | | | | | | | | | | | | | | | | | | | | | | | | |
| 1013 | Au (g/t) | 0.12 | 0.91 | 0.12 | 0.91 | 0 | 0 | 0 |
| 1013 | Pb (%) | 0.49 | 1.34 | 0.49 | 1.34 | 0 | 0 | 0 |
| 1013 | Zn (%) | 1.07 | 1.39 | 1.07 | 1.39 | 0 | 0 | 0 |
| 1013 | Cu (%) | 0.03 | 0.38 | 0.03 | 0.38 | 0 | 0 | 0 |
| 1013 | Fe (%) | 17.39 | 0.76 | 17.39 | 0.76 | 0 | 0 | 0 |
| 1030 | Ag (g/t) | 130.13 | 1.25 | 130.13 | 1.25 | 0 | 0 | 0 |
| 1030 | Au (g/t) | 2.29 | 1.92 | 2.29 | 1.92 | 0 | 0 | 0 |
| 1030 | Pb (%) | 1.64 | 1.2 | 1.64 | 1.2 | 0 | 0 | 0 |
| 1030 | Zn (%) | 7.65 | 1.37 | 7.65 | 1.37 | 0 | 0 | 0 |
| 1030 | Cu (%) | 0.21 | 1.85 | 0.21 | 1.85 | 0 | 0 | 0 |
| 1030 | Fe (%) | 21.76 | 1.09 | 21.76 | 1.09 | 0 | 0 | 0 |
| 1031 | Ag (g/t) | 99.97 | 1.34 | 96.85 | 1.32 | -3.13 | -0.03 | -0.02 |
| 1031 | Au (g/t) | 1.31 | 3.26 | 1.31 | 3.26 | 0 | 0 | 0 |
| 1031 | Pb (%) | 0.88 | 1.36 | 0.88 | 1.36 | 0 | 0 | 0 |
| 1031 | Zn (%) | 2.43 | 2.11 | 2.43 | 2.11 | 0 | 0 | 0 |
| 1031 | Cu (%) | 0.06 | 2.25 | 0.06 | 2.25 | 0 | 0.01 | 0 |
| 1031 | Fe (%) | 19.63 | 1.85 | 19.63 | 1.85 | 0 | 0 | 0 |
| 1033 | Ag (g/t) | 20.62 | 0.83 | 20.62 | 0.83 | 0 | 0 | 0 |
| 1033 | Au (g/t) | 0.99 | 0.96 | 0.99 | 0.96 | 0 | 0 | 0 |
| 1033 | Pb (%) | 0.24 | 0.71 | 0.24 | 0.71 | 0 | 0 | 0 |
| 1033 | Zn (%) | 0.36 | 1.06 | 0.36 | 1.06 | 0 | 0 | 0 |
| 1033 | Cu (%) | 0.03 | 1.57 | 0.03 | 1.54 | 0 | 0.02 | -0.03 |
| 1033 | Fe (%) | 12.42 | 0.7 | 12.42 | 0.7 | 0 | 0 | 0 |
| 1040 | Ag (g/t) | 85.8 | 1.05 | 85.8 | 1.05 | 0 | 0 | 0 |
| 1040 | Au (g/t) | 2.58 | 1.34 | 2.45 | 1.34 | -0.12 | -0.05 | 0 |
| 1040 | Pb (%) | 2.14 | 1.83 | 2.14 | 1.83 | 0 | 0 | 0 |
| 1040 | Zn (%) | 3.84 | 2.07 | 3.84 | 2.07 | 0 | 0 | 0 |
| 1040 | Cu (%) | 0.06 | 1.07 | 0.06 | 1.06 | 0 | 0.01 | 0 |
| 1040 | Fe (%) | 24.28 | 0.81 | 24.28 | 0.81 | 0 | 0 | 0 |
| 1041 | Ag (g/t) | 148.18 | 1.49 | 148.18 | 1.49 | 0 | 0 | 0 |
| 1041 | Au (g/t) | 1.74 | 2.08 | 1.67 | 2.12 | -0.08 | -0.04 | 0.05 |
| 1041 | Pb (%) | 2.16 | 1.49 | 2.16 | 1.49 | 0 | 0 | 0 |
| 1041 | Zn (%) | 3.57 | 1.43 | 3.49 | 1.43 | -0.08 | -0.02 | 0 |
| 1041 | Cu (%) | 0.04 | 1.26 | 0.04 | 1.26 | 0 | 0 | 0 |
| 1041 | Fe (%) | 19.96 | 0.96 | 19.96 | 0.96 | 0 | 0 | 0 |
| 1050 | Ag (g/t) | 46.76 | 1.27 | 46.76 | 1.27 | 0 | 0 | 0 |
| 1050 | Au (g/t) | 2.65 | 1.5 | 2.65 | 1.5 | 0 | 0 | 0 |
| 1050 | Pb (%) | 0.93 | 2.06 | 0.93 | 2.06 | 0 | 0 | 0 |
| 1050 | Zn (%) | 2.91 | 2.03 | 2.75 | 1.97 | -0.17 | -0.06 | -0.06 |
| 1050 | Cu (%) | 0.35 | 1.48 | 0.35 | 1.48 | 0 | 0 | 0 |
| 1050 | Fe (%) | 22.58 | 1.29 | 22.58 | 1.29 | 0 | 0 | 0 |
| 1051 | Ag (g/t) | 27.98 | 0.81 | 27.98 | 0.81 | 0 | 0 | 0 |
| 1051 | Au (g/t) | 0.3 | 0.46 | 0.3 | 0.46 | 0 | 0 | 0 |
| 1051 | Pb (%) | 0.11 | 0.63 | 0.11 | 0.63 | 0 | 0 | 0 |
| 1051 | Zn (%) | 0.04 | 0.91 | 0.04 | 0.91 | 0 | 0 | 0 |
| 1051 | Cu (%) | 0.01 | 0.84 | 0.01 | 0.73 | 0 | 0.06 | -0.11 |
| 1051 | Fe (%) | 3.67 | 0.1 | 3.67 | 0.1 | 0 | 0 | 0 |
| 1052 | Ag (g/t) | 48.42 | 1.37 | 48.42 | 1.37 | 0 | 0 | 0 |
| 1052 | Au (g/t) | 0.78 | 1.32 | 0.78 | 1.32 | 0 | 0 | 0 |
| 1052 | Pb (%) | 0.82 | 1.23 | 0.82 | 1.23 | 0 | 0 | 0 |
| 1052 | Zn (%) | 0.87 | 1.27 | 0.87 | 1.27 | 0 | 0 | 0 |
AYA GOLD & SILVER INC., BOUMADINE POLYMETALLIC PROJECT 428
| | | | | | | | | | | | | | | | | | | | | | | | | | |
| 1052 | Cu (%) | 0.19 | 2.84 | 0.11 | 1.39 | -0.08 | -0.41 | -1.45 |
| 1052 | Fe (%) | 17.67 | 0.98 | 17.67 | 0.98 | 0 | 0 | 0 |
| 1053 | Ag (g/t) | 39.73 | 0.57 | 39.73 | 0.57 | 0 | 0 | 0 |
| 1053 | Au (g/t) | 0.84 | 0.3 | 0.84 | 0.3 | 0 | 0 | 0 |
| 1053 | Pb (%) | 0.68 | 1.04 | 0.68 | 1.04 | 0 | 0 | 0 |
| 1053 | Zn (%) | 1.92 | 1.3 | 1.92 | 1.3 | 0 | 0 | 0 |
| 1053 | Cu (%) | 0.07 | 0.51 | 0.07 | 0.51 | 0 | 0 | 0 |
| 1053 | Fe (%) | 13.65 | 0.3 | 13.65 | 0.3 | 0 | 0 | 0 |
| 1054 | Ag (g/t) | 22.97 | 1.34 | 22.97 | 1.34 | 0 | 0 | 0 |
| 1054 | Au (g/t) | 0.05 | 1.19 | 0.05 | 1.19 | 0 | 0 | 0 |
| 1054 | Pb (%) | 0.97 | 1.7 | 0.97 | 1.7 | 0 | 0 | 0 |
| 1054 | Zn (%) | 1.98 | 2.14 | 1.98 | 2.14 | 0 | 0 | 0 |
| 1054 | Cu (%) | 0.25 | 0.86 | 0.25 | 0.86 | 0 | 0 | 0 |
| 1054 | Fe (%) | 9.14 | 1.48 | 9.14 | 1.48 | 0 | 0 | 0 |
| 1055 | Ag (g/t) | 296.3 | 0.68 | 296.3 | 0.68 | 0 | 0 | 0 |
| 1055 | Au (g/t) | 0.72 | 0.7 | 0.72 | 0.7 | 0 | 0 | 0 |
| 1055 | Pb (%) | 4.74 | 0.7 | 4.74 | 0.7 | 0 | 0 | 0 |
| 1055 | Zn (%) | 4.53 | 0.85 | 4.53 | 0.85 | 0 | 0 | 0 |
| 1055 | Cu (%) | 0.07 | 0.92 | 0.07 | 0.92 | 0 | 0 | 0 |
| 1055 | Fe (%) | 20.67 | 0.71 | 20.67 | 0.71 | 0 | 0 | 0 |
| 1056 | Ag (g/t) | 49.3 | 0.64 | 49.3 | 0.64 | 0 | 0 | 0 |
| 1056 | Au (g/t) | 0.71 | 0.98 | 0.71 | 0.98 | 0 | 0 | 0 |
| 1056 | Pb (%) | 0.69 | 1.57 | 0.69 | 1.57 | 0 | 0 | 0 |
| 1056 | Zn (%) | 0.65 | 1.12 | 0.65 | 1.12 | 0 | 0 | 0 |
| 1056 | Cu (%) | 0.46 | 0.61 | 0.46 | 0.61 | 0 | 0 | 0 |
| 1056 | Fe (%) | 40.23 | 0.91 | 37.39 | 0.81 | -2.84 | -0.07 | -0.1 |
| 1061 | Ag (g/t) | 122.19 | 0.6 | 122.19 | 0.6 | 0 | 0 | 0 |
| 1061 | Au (g/t) | 0.62 | 0.78 | 0.62 | 0.78 | 0 | 0 | 0 |
| 1061 | Pb (%) | 2.82 | 0.59 | 2.82 | 0.59 | 0 | 0 | 0 |
| 1061 | Zn (%) | 6.75 | 0.85 | 6.75 | 0.85 | 0 | 0 | 0 |
| 1061 | Cu (%) | 0.03 | 0.11 | 0.03 | 0.03 | 0 | 0.14 | -0.08 |
| 1061 | Fe (%) | 28.03 | 0.52 | 28.03 | 0.52 | 0 | 0 | 0 |
| 1062 | Ag (g/t) | 22.45 | 1.35 | 22.45 | 1.35 | 0 | 0 | 0 |
| 1062 | Au (g/t) | 0.06 | 0.85 | 0.06 | 0.85 | 0 | 0 | 0 |
| 1062 | Pb (%) | 5.21 | 1.41 | 5.21 | 1.41 | 0 | 0 | 0 |
| 1062 | Zn (%) | 10.88 | 1.41 | 9.91 | 1.41 | -0.97 | -0.09 | 0 |
| 1062 | Cu (%) | 0.22 | 0.66 | 0.22 | 0.66 | 0 | 0.01 | 0 |
| 1062 | Fe (%) | 17.55 | 0.74 | 17.55 | 0.74 | 0 | 0 | 0 |
| 1063 | Ag (g/t) | 3.08 | 0.77 | 3.08 | 0.77 | 0 | 0 | 0 |
| 1063 | Au (g/t) | 7.94 | 0.48 | 7.94 | 0.48 | 0 | 0 | 0 |
| 1063 | Pb (%) | 0.02 | 0.64 | 0.02 | 0.64 | 0 | 0 | 0 |
| 1063 | Zn (%) | 0.03 | 0.86 | 0.03 | 0.86 | 0 | 0 | 0 |
| 1063 | Cu (%) | 0.02 | 0.54 | 0.02 | 0.54 | 0 | 0 | 0 |
| 1063 | Fe (%) | 34.44 | 0.83 | 34.44 | 0.83 | 0 | 0 | 0 |
| 1090 | Ag (g/t) | 258.26 | 1.94 | 258.26 | 1.94 | 0 | 0 | 0 |
| 1090 | Au (g/t) | 3.77 | 1.31 | 3.77 | 1.31 | 0 | 0 | 0 |
| 1090 | Pb (%) | 2.87 | 2.39 | 2.87 | 2.39 | 0 | 0 | 0 |
| 1090 | Zn (%) | 9.41 | 1.89 | 9.35 | 1.88 | -0.06 | -0.01 | -0.01 |
| 1090 | Cu (%) | 0.24 | 1.93 | 0.24 | 1.93 | 0 | 0 | -0.01 |
| 1090 | Fe (%) | 44.69 | 0.99 | 43.29 | 0.89 | -1.4 | -0.03 | -0.1 |
| 1091 | Ag (g/t) | 432.92 | 1.61 | 394.35 | 1.27 | -38.57 | -0.09 | -0.34 |
AYA GOLD & SILVER INC., BOUMADINE POLYMETALLIC PROJECT 429
| | | | | | | | | | | | | | | | | | | | | | | | | | |
| 1091 | Au (g/t) | 1.68 | 1.17 | 1.65 | 1.11 | -0.04 | -0.02 | -0.06 |
| 1091 | Pb (%) | 3.07 | 1.27 | 2.74 | 1.04 | -0.33 | -0.11 | -0.23 |
| 1091 | Zn (%) | 4.68 | 1.04 | 4.43 | 0.92 | -0.25 | -0.05 | -0.12 |
| 1091 | Cu (%) | 0.14 | 2.22 | 0.14 | 2.13 | 0 | -0.03 | -0.09 |
| 1091 | Fe (%) | 32.27 | 0.77 | 32.27 | 0.77 | 0 | 0 | 0 |
| 1092 | Ag (g/t) | 91.96 | 1.89 | 91.96 | 1.89 | 0 | 0 | 0 |
| 1092 | Au (g/t) | 4.19 | 1.9 | 4.19 | 1.9 | 0 | 0 | 0 |
| 1092 | Pb (%) | 1.25 | 1.14 | 1.25 | 1.14 | 0 | 0 | 0 |
| 1092 | Zn (%) | 3.2 | 1.75 | 3.2 | 1.75 | 0 | 0 | 0 |
| 1092 | Cu (%) | 0.27 | 1.67 | 0.27 | 1.66 | 0 | 0 | 0 |
| 1092 | Fe (%) | 43.15 | 1.27 | 43.15 | 1.27 | 0 | 0 | 0 |
| 1093 | Ag (g/t) | 329.44 | 2.49 | 329.44 | 2.49 | 0 | 0 | 0 |
| 1093 | Au (g/t) | 2.51 | 1.53 | 2.51 | 1.53 | 0 | 0 | 0 |
| 1093 | Pb (%) | 1.04 | 1.3 | 1.04 | 1.3 | 0 | 0 | 0 |
| 1093 | Zn (%) | 3.26 | 1.66 | 3.26 | 1.66 | 0 | 0 | 0 |
| 1093 | Cu (%) | 0.22 | 1.55 | 0.22 | 1.55 | 0 | 0 | 0 |
| 1093 | Fe (%) | 29.68 | 0.95 | 29.68 | 0.95 | 0 | 0 | 0 |
| 1094 | Ag (g/t) | 105.6 | 1.04 | 105.6 | 1.04 | 0 | 0 | 0 |
| 1094 | Au (g/t) | 6.21 | 1.2 | 6.21 | 1.2 | 0 | 0 | 0 |
| 1094 | Pb (%) | 1.19 | 0.77 | 1.19 | 0.77 | 0 | 0 | 0 |
| 1094 | Zn (%) | 1.51 | 1.11 | 1.51 | 1.11 | 0 | 0 | 0 |
| 1094 | Cu (%) | 0.2 | 1.24 | 0.2 | 1.23 | 0 | 0 | 0 |
| 1094 | Fe (%) | 49.41 | 0.71 | 49.41 | 0.71 | 0 | 0 | 0 |
| 1201 | Ag (g/t) | 1095.83 | 1.65 | 1058.78 | 1.64 | -37.05 | -0.03 | -0.01 |
| 1201 | Au (g/t) | 5.78 | 1.17 | 5.78 | 1.17 | 0 | 0 | 0 |
| 1201 | Pb (%) | 10.26 | 1.72 | 10.21 | 1.73 | -0.05 | -0.01 | 0.01 |
| 1201 | Zn (%) | 12.92 | 1.01 | 12.87 | 1.01 | -0.05 | 0 | 0 |
| 1201 | Cu (%) | 0.22 | 0.93 | 0.22 | 0.93 | 0 | 0 | 0 |
| 1201 | Fe (%) | 78.75 | 0.88 | 78.75 | 0.88 | 0 | 0 | 0 |
| 1202 | Ag (g/t) | 110.65 | 2.3 | 110.65 | 2.3 | 0 | 0 | 0 |
| 1202 | Au (g/t) | 1.96 | 2.99 | 1.63 | 2.84 | -0.33 | -0.17 | -0.15 |
| 1202 | Pb (%) | 1.17 | 2.25 | 1.17 | 2.25 | 0 | 0 | 0 |
| 1202 | Zn (%) | 2.74 | 1.89 | 2.74 | 1.89 | 0 | 0 | 0 |
| 1202 | Cu (%) | 0.1 | 2.71 | 0.1 | 2.7 | 0 | 0 | -0.01 |
| 1202 | Fe (%) | 19.41 | 1.52 | 14.19 | 1.09 | -5.21 | -0.27 | -0.43 |
| 1203 | Ag (g/t) | 71.92 | 2.04 | 71.92 | 2.04 | 0 | 0 | 0 |
| 1203 | Au (g/t) | 1.48 | 2.78 | 1.48 | 2.78 | 0 | 0 | 0 |
| 1203 | Pb (%) | 1.4 | 1.96 | 1.4 | 1.96 | 0 | 0 | 0 |
| 1203 | Zn (%) | 3.14 | 1.93 | 3.14 | 1.93 | 0 | 0 | 0 |
| 1203 | Cu (%) | 0.05 | 1.59 | 0.05 | 1.58 | 0 | 0 | 0 |
| 1203 | Fe (%) | 18.33 | 1.61 | 18.33 | 1.61 | 0 | 0 | 0 |
| 1208 | Ag (g/t) | 21.12 | 0.65 | 21.12 | 0.65 | 0 | 0 | 0 |
| 1208 | Au (g/t) | 0.58 | 0.32 | 0.58 | 0.32 | 0 | 0 | 0 |
| 1208 | Pb (%) | 0.16 | 0.71 | 0.16 | 0.71 | 0 | 0 | 0 |
| 1208 | Zn (%) | 0.16 | 0.97 | 0.16 | 0.97 | 0 | 0 | 0 |
| 1208 | Cu (%) | 0.04 | 0.89 | 0.04 | 0.87 | 0 | 0.01 | -0.02 |
| 1208 | Fe (%) | 13.18 | 0.58 | 13.18 | 0.58 | 0 | 0 | 0 |
| 1209 | Ag (g/t) | 20.16 | 0.83 | 20.16 | 0.83 | 0 | 0 | 0 |
| 1209 | Au (g/t) | 0.57 | 1.74 | 0.57 | 1.74 | 0 | 0 | 0 |
| 1209 | Pb (%) | 0.36 | 0.7 | 0.36 | 0.7 | 0 | 0 | 0 |
| 1209 | Zn (%) | 1.34 | 0.82 | 1.34 | 0.82 | 0 | 0 | 0 |
AYA GOLD & SILVER INC., BOUMADINE POLYMETALLIC PROJECT 430
| | | | | | | | | | | | | | | | | | | | | | | | | | |
| 1209 | Cu (%) | 0.18 | 1.75 | 0.18 | 1.75 | 0 | 0 | 0 |
| 1209 | Fe (%) | 7.77 | 0.58 | 7.77 | 0.58 | 0 | 0 | 0 |
| 1304 | Ag (g/t) | 29.04 | 0.4 | 29.04 | 0.4 | 0 | 0 | 0 |
| 1304 | Au (g/t) | 1.12 | 0.79 | 1.12 | 0.79 | 0 | 0 | 0 |
| 1304 | Pb (%) | 1.41 | 0.99 | 1.41 | 0.99 | 0 | 0 | 0 |
| 1304 | Zn (%) | 1.28 | 0.84 | 1.28 | 0.84 | 0 | 0 | 0 |
| 1304 | Cu (%) | 0.07 | 0.4 | 0.07 | 0.37 | 0 | 0.02 | -0.02 |
| 1304 | Fe (%) | 24.37 | 0.63 | 24.37 | 0.63 | 0 | 0 | 0 |
| 1305 | Ag (g/t) | 54.67 | 1.31 | 54.67 | 1.31 | 0 | 0 | 0 |
| 1305 | Au (g/t) | 2.3 | 1.54 | 2.3 | 1.54 | 0 | 0 | 0 |
| 1305 | Pb (%) | 0.58 | 1.46 | 0.58 | 1.46 | 0 | 0 | 0 |
| 1305 | Zn (%) | 1.03 | 1.38 | 1.03 | 1.38 | 0 | 0 | 0 |
| 1305 | Cu (%) | 0.16 | 1.05 | 0.16 | 1.05 | 0 | 0 | 0 |
| 1305 | Fe (%) | 31.91 | 0.82 | 31.06 | 0.75 | -0.85 | -0.03 | -0.07 |
| 1306 | Ag (g/t) | 144.14 | 1.15 | 144.14 | 1.15 | 0 | 0 | 0 |
| 1306 | Au (g/t) | 2.74 | 1.74 | 2.74 | 1.74 | 0 | 0 | 0 |
| 1306 | Pb (%) | 1.37 | 1.13 | 1.37 | 1.13 | 0 | 0 | 0 |
| 1306 | Zn (%) | 2.48 | 1.32 | 2.48 | 1.32 | 0 | 0 | 0 |
| 1306 | Cu (%) | 0.21 | 1.45 | 0.21 | 1.45 | 0 | 0 | 0 |
| 1306 | Fe (%) | 31.39 | 1.19 | 31.39 | 1.19 | 0 | 0 | 0 |
| 1310 | Ag (g/t) | 46.17 | 0.9 | 46.17 | 0.9 | 0 | 0 | 0 |
| 1310 | Au (g/t) | 2.67 | 1.27 | 2.67 | 1.27 | 0 | 0 | 0 |
| 1310 | Pb (%) | 0.99 | 1.3 | 0.99 | 1.3 | 0 | 0 | 0 |
| 1310 | Zn (%) | 2.32 | 1.67 | 2.32 | 1.67 | 0 | 0 | 0 |
| 1310 | Cu (%) | 0.17 | 1.16 | 0.17 | 1.16 | 0 | 0 | 0 |
| 1310 | Fe (%) | 33.37 | 0.95 | 33.37 | 0.95 | 0 | 0 | 0 |
| 1311 | Ag (g/t) | 43.29 | 1.11 | 43.29 | 1.11 | 0 | 0 | 0 |
| 1311 | Au (g/t) | 1.31 | 2.01 | 1.31 | 2.01 | 0 | 0 | 0 |
| 1311 | Pb (%) | 0.12 | 0.62 | 0.12 | 0.62 | 0 | 0 | 0 |
| 1311 | Zn (%) | 0.43 | 0.76 | 0.43 | 0.76 | 0 | 0 | 0 |
| 1311 | Cu (%) | 0.1 | 0.96 | 0.1 | 0.96 | 0 | 0 | 0 |
| 1311 | Fe (%) | 32.96 | 1.12 | 27.39 | 0.91 | -5.57 | -0.17 | -0.21 |
| 1312 | Ag (g/t) | 44.6 | 1.78 | 44.6 | 1.78 | 0 | 0 | 0 |
| 1312 | Au (g/t) | 0.83 | 1.78 | 0.83 | 1.78 | 0 | 0 | 0 |
| 1312 | Pb (%) | 0.58 | 0.96 | 0.58 | 0.96 | 0 | 0 | 0 |
| 1312 | Zn (%) | 3.18 | 2.43 | 3.18 | 2.43 | 0 | 0 | 0 |
| 1312 | Cu (%) | 0.1 | 1.61 | 0.1 | 1.58 | 0 | 0.01 | -0.03 |
| 1312 | Fe (%) | 15.19 | 1.13 | 15.19 | 1.13 | 0 | 0 | 0 |
| 1313 | Ag (g/t) | 38.1 | 1.89 | 38.1 | 1.89 | 0 | 0 | 0 |
| 1313 | Au (g/t) | 0.21 | 1.02 | 0.21 | 1.02 | 0 | 0 | 0 |
| 1313 | Pb (%) | 2.75 | 2.07 | 2.75 | 2.07 | 0 | 0 | 0 |
| 1313 | Zn (%) | 2.44 | 0.86 | 2.44 | 0.86 | 0 | 0 | 0 |
| 1313 | Cu (%) | 0.04 | 0.87 | 0.04 | 0.89 | 0 | 0.04 | 0.01 |
| 1313 | Fe (%) | 10.56 | 0.5 | 10.56 | 0.5 | 0 | 0 | 0 |
| 1314 | Ag (g/t) | 24.01 | 0.88 | 24.01 | 0.88 | 0 | 0 | 0 |
| 1314 | Au (g/t) | 1.25 | 0.92 | 1.25 | 0.92 | 0 | 0 | 0 |
| 1314 | Pb (%) | 0.32 | 1.22 | 0.32 | 1.22 | 0 | 0 | 0 |
| 1314 | Zn (%) | 0.49 | 1.55 | 0.49 | 1.55 | 0 | 0 | 0 |
| 1314 | Cu (%) | 0.12 | 0.91 | 0.12 | 0.9 | 0 | 0 | -0.01 |
| 1314 | Fe (%) | 23.93 | 0.5 | 23.93 | 0.5 | 0 | 0 | 0 |
| 1331 | Ag (g/t) | 39.9 | 0.84 | 39.9 | 0.84 | 0 | 0 | 0 |
AYA GOLD & SILVER INC., BOUMADINE POLYMETALLIC PROJECT 431
| | | | | | | | | | | | | | | | | | | | | | | | | | |
| 1331 | Au (g/t) | 1.49 | 1.84 | 1.49 | 1.84 | 0 | 0 | 0 |
| 1331 | Pb (%) | 2.13 | 1.74 | 2.13 | 1.74 | 0 | 0 | 0 |
| 1331 | Zn (%) | 2.18 | 0.93 | 2.18 | 0.93 | 0 | 0 | 0 |
| 1331 | Cu (%) | 0.11 | 1.43 | 0.11 | 1.43 | 0 | 0.01 | -0.01 |
| 1331 | Fe (%) | 21.34 | 0.84 | 21.34 | 0.84 | 0 | 0 | 0 |
| 1341 | Ag (g/t) | 41.69 | 1.47 | 41.69 | 1.47 | 0 | 0 | 0 |
| 1341 | Au (g/t) | 0.75 | 1.52 | 0.75 | 1.52 | 0 | 0 | 0 |
| 1341 | Pb (%) | 2.68 | 2.45 | 2.68 | 2.45 | 0 | 0 | 0 |
| 1341 | Zn (%) | 4.24 | 1.69 | 4.24 | 1.69 | 0 | 0 | 0 |
| 1341 | Cu (%) | 0.12 | 1.8 | 0.12 | 1.79 | 0 | 0.01 | -0.01 |
| 1341 | Fe (%) | 18.34 | 0.81 | 18.34 | 0.81 | 0 | 0 | 0 |
| 1403 | Ag (g/t) | 36.95 | 0.81 | 36.95 | 0.81 | 0 | 0 | 0 |
| 1403 | Au (g/t) | 0.89 | 1.45 | 0.89 | 1.45 | 0 | 0 | 0 |
| 1403 | Pb (%) | 3.68 | 1.42 | 3.68 | 1.42 | 0 | 0 | 0 |
| 1403 | Zn (%) | 3.36 | 0.74 | 3.36 | 0.74 | 0 | 0 | 0 |
| 1403 | Cu (%) | 0.09 | 0.65 | 0.09 | 0.65 | 0 | 0.01 | 0 |
| 1403 | Fe (%) | 32.88 | 0.55 | 32.88 | 0.55 | 0 | 0 | 0 |
| 1404 | Ag (g/t) | 22.84 | 1.17 | 22.84 | 1.17 | 0 | 0 | 0 |
| 1404 | Au (g/t) | 0.21 | 1.37 | 0.21 | 1.37 | 0 | 0 | 0 |
| 1404 | Pb (%) | 0.39 | 0.83 | 0.39 | 0.83 | 0 | 0 | 0 |
| 1404 | Zn (%) | 1.39 | 1.27 | 1.39 | 1.27 | 0 | 0 | 0 |
| 1404 | Cu (%) | 0.06 | 2.39 | 0.07 | 2.36 | 0 | 0.01 | -0.02 |
| 1404 | Fe (%) | 11.09 | 0.58 | 11.09 | 0.58 | 0 | 0 | 0 |
| 1407 | Ag (g/t) | 45 | 1.25 | 45 | 1.25 | 0 | 0 | 0 |
| 1407 | Au (g/t) | 2.57 | 2.62 | 1.99 | 2.26 | -0.58 | -0.22 | -0.36 |
| 1407 | Pb (%) | 0.98 | 1.3 | 0.98 | 1.3 | 0 | 0 | 0 |
| 1407 | Zn (%) | 1.76 | 1.18 | 1.76 | 1.18 | 0 | 0 | 0 |
| 1407 | Cu (%) | 0.15 | 1.55 | 0.15 | 1.54 | 0 | 0.01 | -0.01 |
| 1407 | Fe (%) | 39.15 | 1.21 | 39.15 | 1.21 | 0 | 0 | 0 |
| 1501 | Ag (g/t) | 207.96 | 1.23 | 207.96 | 1.23 | 0 | 0 | 0 |
| 1501 | Au (g/t) | 2.23 | 1.2 | 2.14 | 1.14 | -0.09 | -0.04 | -0.06 |
| 1501 | Pb (%) | 2.64 | 1.27 | 2.64 | 1.27 | 0 | 0 | 0 |
| 1501 | Zn (%) | 5.15 | 1.32 | 5.15 | 1.32 | 0 | 0 | 0 |
| 1501 | Cu (%) | 0.08 | 1.19 | 0.08 | 1.18 | 0 | 0.01 | -0.01 |
| 1501 | Fe (%) | 37.53 | 0.89 | 37.53 | 0.89 | 0 | 0 | 0 |
| 1502 | Ag (g/t) | 275.26 | 1.53 | 275.26 | 1.53 | 0 | 0 | 0 |
| 1502 | Au (g/t) | 1.2 | 1.02 | 1.2 | 1.02 | 0 | 0 | 0 |
| 1502 | Pb (%) | 2.51 | 1.26 | 2.51 | 1.26 | 0 | 0 | 0 |
| 1502 | Zn (%) | 6.3 | 1.23 | 6.19 | 1.24 | -0.12 | -0.02 | 0.01 |
| 1502 | Cu (%) | 0.06 | 1.49 | 0.06 | 1.48 | 0 | 0.01 | -0.01 |
| 1502 | Fe (%) | 24.74 | 0.86 | 24.74 | 0.86 | 0 | 0 | 0 |
| 1503 | Ag (g/t) | 236.47 | 1.4 | 230.2 | 1.36 | -6.27 | -0.03 | -0.04 |
| 1503 | Au (g/t) | 1.2 | 1.04 | 1.2 | 1.04 | 0 | 0 | 0 |
| 1503 | Pb (%) | 2.48 | 1.52 | 2.38 | 1.44 | -0.1 | -0.04 | -0.07 |
| 1503 | Zn (%) | 4.92 | 1.32 | 4.92 | 1.32 | 0 | 0 | 0 |
| 1503 | Cu (%) | 0.13 | 1.64 | 0.13 | 1.63 | 0 | 0 | -0.01 |
| 1503 | Fe (%) | 32.7 | 0.96 | 32.7 | 0.96 | 0 | 0 | 0 |
| 1504 | Ag (g/t) | 252.69 | 1.33 | 252.69 | 1.33 | 0 | 0 | 0 |
| 1504 | Au (g/t) | 2.36 | 1.26 | 1.9 | 1.02 | -0.46 | -0.2 | -0.25 |
| 1504 | Pb (%) | 2.32 | 1.52 | 2.32 | 1.52 | 0 | 0 | 0 |
| 1504 | Zn (%) | 3.79 | 1.46 | 3.79 | 1.46 | 0 | 0 | 0 |
AYA GOLD & SILVER INC., BOUMADINE POLYMETALLIC PROJECT 432
| | | | | | | | | | | | | | | | | | | | | | | | | | |
| 1504 | Cu (%) | 0.05 | 0.92 | 0.05 | 0.92 | 0 | 0 | 0 |
| 1504 | Fe (%) | 30.13 | 0.86 | 30.13 | 0.86 | 0 | 0 | 0 |
| 1505 | Ag (g/t) | 102.06 | 1.06 | 102.06 | 1.06 | 0 | 0 | 0 |
| 1505 | Au (g/t) | 0.75 | 1.26 | 0.75 | 1.26 | 0 | 0 | 0 |
| 1505 | Pb (%) | 0.95 | 1.44 | 0.95 | 1.44 | 0 | 0 | 0 |
| 1505 | Zn (%) | 1.73 | 1.26 | 1.73 | 1.26 | 0 | 0 | 0 |
| 1505 | Cu (%) | 0.04 | 1.28 | 0.04 | 1.24 | 0 | 0.02 | -0.04 |
| 1505 | Fe (%) | 19.15 | 1.13 | 19.15 | 1.13 | 0 | 0 | 0 |
| 1601 | Ag (g/t) | 21.82 | 1.09 | 21.82 | 1.09 | 0 | 0 | 0 |
| 1601 | Au (g/t) | 0.16 | 0.71 | 0.16 | 0.71 | 0 | 0 | 0 |
| 1601 | Pb (%) | 1.28 | 1.46 | 1.28 | 1.46 | 0 | 0 | 0 |
| 1601 | Zn (%) | 1.81 | 0.76 | 1.81 | 0.76 | 0 | 0 | 0 |
| 1601 | Cu (%) | 0.09 | 0.98 | 0.09 | 0.98 | 0 | 0 | 0 |
| 1601 | Fe (%) | 13.68 | 0.55 | 13.68 | 0.55 | 0 | 0 | 0 |
| 1614 | Ag (g/t) | 14.43 | 0.88 | 14.43 | 0.88 | 0 | 0 | 0 |
| 1614 | Au (g/t) | 0.47 | 0.91 | 0.47 | 0.91 | 0 | 0 | 0 |
| 1614 | Pb (%) | 0.1 | 0.78 | 0.1 | 0.78 | 0 | 0 | 0 |
| 1614 | Zn (%) | 0.09 | 0.69 | 0.09 | 0.69 | 0 | 0 | 0 |
| 1614 | Cu (%) | 0.04 | 0.99 | 0.04 | 0.98 | 0 | 0 | 0 |
| 1614 | Fe (%) | 12.88 | 0.76 | 12.88 | 0.76 | 0 | 0 | 0 |
| 1631 | Ag (g/t) | 87.23 | 0.81 | 87.23 | 0.81 | 0 | 0 | 0 |
| 1631 | Au (g/t) | 1.74 | 0.98 | 1.74 | 0.98 | 0 | 0 | 0 |
| 1631 | Pb (%) | 1.67 | 0.8 | 1.67 | 0.8 | 0 | 0 | 0 |
| 1631 | Zn (%) | 2.16 | 1.17 | 2.16 | 1.17 | 0 | 0 | 0 |
| 1631 | Cu (%) | 0.06 | 0.77 | 0.06 | 0.75 | 0 | 0.02 | -0.02 |
| 1631 | Fe (%) | 35.63 | 0.68 | 35.63 | 0.68 | 0 | 0 | 0 |
| 1632 | Ag (g/t) | 77.03 | 1.55 | 64.12 | 1.28 | -12.91 | -0.17 | -0.27 |
| 1632 | Au (g/t) | 3.18 | 1.39 | 2.81 | 1.25 | -0.38 | -0.12 | -0.14 |
| 1632 | Pb (%) | 1.44 | 1.94 | 0.82 | 0.77 | -0.62 | -0.43 | -1.18 |
| 1632 | Zn (%) | 1.97 | 0.67 | 1.97 | 0.67 | 0 | 0 | 0 |
| 1632 | Cu (%) | 0.13 | 1.4 | 0.12 | 1.22 | -0.02 | -0.11 | -0.18 |
| 1632 | Fe (%) | 33.16 | 0.99 | 33.16 | 0.99 | 0 | 0 | 0 |
| 2002 | Ag (g/t) | 72.51 | 1.87 | 72.51 | 1.87 | 0 | 0 | 0 |
| 2002 | Au (g/t) | 3.65 | 1.97 | 3.65 | 1.97 | 0 | 0 | 0 |
| 2002 | Pb (%) | 2.27 | 2.03 | 2.27 | 2.03 | 0 | 0 | 0 |
| 2002 | Zn (%) | 3.34 | 2.05 | 3.34 | 2.05 | 0 | 0 | 0 |
| 2002 | Cu (%) | 0.08 | 1.35 | 0.08 | 1.34 | 0 | 0.01 | -0.02 |
| 2002 | Fe (%) | 31.48 | 1.01 | 31.48 | 1.01 | 0 | 0 | 0 |
| 2004 | Ag (g/t) | 186.38 | 1.23 | 186.38 | 1.23 | 0 | 0 | 0 |
| 2004 | Au (g/t) | 3.2 | 1.02 | 3.2 | 1.02 | 0 | 0 | 0 |
| 2004 | Pb (%) | 1.23 | 1.32 | 1.23 | 1.32 | 0 | 0 | 0 |
| 2004 | Zn (%) | 4.94 | 1.02 | 4.94 | 1.02 | 0 | 0 | 0 |
| 2004 | Cu (%) | 0.3 | 1.28 | 0.31 | 1.27 | 0 | 0 | -0.01 |
| 2004 | Fe (%) | 43.24 | 0.72 | 43.24 | 0.72 | 0 | 0 | 0 |
| 2005 | Ag (g/t) | 19.57 | 0.85 | 19.57 | 0.85 | 0 | 0 | 0 |
| 2005 | Au (g/t) | 0.26 | 1.68 | 0.26 | 1.68 | 0 | 0 | 0 |
| 2005 | Pb (%) | 0.41 | 1.48 | 0.41 | 1.48 | 0 | 0 | 0 |
| 2005 | Zn (%) | 1.62 | 1.18 | 1.62 | 1.18 | 0 | 0 | 0 |
| 2005 | Cu (%) | 0.01 | 0.63 | 0.01 | 0.62 | 0 | 0.03 | -0.01 |
| 2005 | Fe (%) | 13.43 | 0.58 | 13.43 | 0.58 | 0 | 0 | 0 |
| 2006 | Ag (g/t) | 32.99 | 0.89 | 32.99 | 0.89 | 0 | 0 | 0 |
AYA GOLD & SILVER INC., BOUMADINE POLYMETALLIC PROJECT 433
| | | | | | | | | | | | | | | | | | | | | | | | | | |
| 2006 | Au (g/t) | 0.62 | 2.32 | 0.62 | 2.32 | 0 | 0 | 0 |
| 2006 | Pb (%) | 2.81 | 1.9 | 1.86 | 1.52 | -0.95 | -0.34 | -0.39 |
| 2006 | Zn (%) | 1.74 | 1.09 | 1.74 | 1.09 | 0 | 0 | 0 |
| 2006 | Cu (%) | 0.03 | 1.3 | 0.03 | 1.28 | 0 | 0.01 | -0.01 |
| 2006 | Fe (%) | 12.1 | 1.05 | 12.1 | 1.05 | 0 | 0 | 0 |
| 2009 | Ag (g/t) | 69.51 | 0.79 | 69.51 | 0.79 | 0 | 0 | 0 |
| 2009 | Au (g/t) | 2.71 | 1.04 | 2.71 | 1.04 | 0 | 0 | 0 |
| 2009 | Pb (%) | 1.69 | 1.41 | 1.69 | 1.41 | 0 | 0 | 0 |
| 2009 | Zn (%) | 2.63 | 0.63 | 2.63 | 0.63 | 0 | 0 | 0 |
| 2009 | Cu (%) | 0.1 | 1.1 | 0.1 | 1.09 | 0 | 0.01 | -0.01 |
| 2009 | Fe (%) | 42.65 | 0.8 | 42.65 | 0.8 | 0 | 0 | 0 |
| 2012 | Ag (g/t) | 74.49 | 1.04 | 71.77 | 1.04 | -2.73 | -0.04 | 0 |
| 2012 | Au (g/t) | 1.43 | 1.43 | 1.43 | 1.43 | 0 | 0 | 0 |
| 2012 | Pb (%) | 2.26 | 1.41 | 2.26 | 1.41 | 0 | 0 | 0 |
| 2012 | Zn (%) | 6.95 | 1.41 | 6.95 | 1.41 | 0 | 0 | 0 |
| 2012 | Cu (%) | 0.08 | 1.91 | 0.08 | 1.89 | 0 | 0.01 | -0.01 |
| 2012 | Fe (%) | 25.01 | 0.84 | 25.01 | 0.84 | 0 | 0 | 0 |
| 2018 | Ag (g/t) | 176.5 | 1.01 | 176.5 | 1.01 | 0 | 0 | 0 |
| 2018 | Au (g/t) | 5.06 | 1.19 | 5.06 | 1.19 | 0 | 0 | 0 |
| 2018 | Pb (%) | 1.69 | 0.76 | 1.69 | 0.76 | 0 | 0 | 0 |
| 2018 | Zn (%) | 9.29 | 0.8 | 8.88 | 0.8 | -0.41 | -0.04 | 0 |
| 2018 | Cu (%) | 0.1 | 1.29 | 0.1 | 1.28 | 0 | 0.01 | -0.01 |
| 2018 | Fe (%) | 53.38 | 1.03 | 53.38 | 1.03 | 0 | 0 | 0 |
| 2019 | Ag (g/t) | 159.32 | 0.73 | 159.32 | 0.73 | 0 | 0 | 0 |
| 2019 | Au (g/t) | 4.63 | 1.02 | 4.63 | 1.02 | 0 | 0 | 0 |
| 2019 | Pb (%) | 0.51 | 0.6 | 0.51 | 0.6 | 0 | 0 | 0 |
| 2019 | Zn (%) | 1.43 | 0.98 | 1.43 | 0.98 | 0 | 0 | 0 |
| 2019 | Cu (%) | 0.35 | 0.7 | 0.35 | 0.7 | 0 | 0 | 0 |
| 2019 | Fe (%) | 50.84 | 1.05 | 50.84 | 1.05 | 0 | 0 | 0 |
| 2020 | Ag (g/t) | 123.27 | 1.16 | 123.27 | 1.16 | 0 | 0 | 0 |
| 2020 | Au (g/t) | 13.42 | 1.38 | 10.7 | 1.26 | -2.72 | -0.2 | -0.12 |
| 2020 | Pb (%) | 1.34 | 1.94 | 1.34 | 1.94 | 0 | 0 | 0 |
| 2020 | Zn (%) | 2.78 | 1.77 | 2.78 | 1.77 | 0 | 0 | 0 |
| 2020 | Cu (%) | 0.19 | 0.91 | 0.19 | 0.9 | 0 | 0 | 0 |
| 2020 | Fe (%) | 53.1 | 0.8 | 53.1 | 0.8 | 0 | 0 | 0 |
| 2026 | Ag (g/t) | 18.6 | 0.86 | 18.6 | 0.86 | 0 | 0 | 0 |
| 2026 | Au (g/t) | 0.77 | 0.99 | 0.77 | 0.99 | 0 | 0 | 0 |
| 2026 | Pb (%) | 0.89 | 1.5 | 0.89 | 1.5 | 0 | 0 | 0 |
| 2026 | Zn (%) | 2.17 | 1.24 | 2.17 | 1.24 | 0 | 0 | 0 |
| 2026 | Cu (%) | 0.02 | 1.17 | 0.02 | 0.97 | 0 | 0.2 | -0.2 |
| 2026 | Fe (%) | 16.5 | 0.69 | 16.5 | 0.69 | 0 | 0 | 0 |
| 2091 | Ag (g/t) | 246.09 | 1.45 | 221.43 | 1.22 | -24.66 | -0.1 | -0.23 |
| 2091 | Au (g/t) | 11.33 | 1.93 | 10.15 | 1.5 | -1.18 | -0.1 | -0.42 |
| 2091 | Pb (%) | 2.03 | 1.21 | 2 | 1.17 | -0.03 | -0.01 | -0.05 |
| 2091 | Zn (%) | 7.39 | 1.34 | 7.11 | 1.21 | -0.28 | -0.04 | -0.14 |
| 2091 | Cu (%) | 0.39 | 1.71 | 0.37 | 1.51 | -0.02 | -0.04 | -0.2 |
| 2091 | Fe (%) | 74.85 | 0.89 | 73.71 | 0.86 | -1.13 | -0.02 | -0.03 |
| 2101 | Ag (g/t) | 40.64 | 1.25 | 40.64 | 1.25 | 0 | 0 | 0 |
| 2101 | Au (g/t) | 1.49 | 1.77 | 1.49 | 1.77 | 0 | 0 | 0 |
| 2101 | Pb (%) | 0.41 | 0.79 | 0.41 | 0.79 | 0 | 0 | 0 |
| 2101 | Zn (%) | 2.3 | 1.18 | 2.13 | 1.22 | -0.16 | -0.07 | 0.05 |
AYA GOLD & SILVER INC., BOUMADINE POLYMETALLIC PROJECT 434
| | | | | | | | | | | | | | | | | | | | | | | | | | |
| 2101 | Cu (%) | 0.05 | 1.76 | 0.05 | 1.75 | 0 | 0.01 | -0.02 |
| 2101 | Fe (%) | 12.82 | 1.12 | 12.82 | 1.12 | 0 | 0 | 0 |
| 2103 | Ag (g/t) | 69.05 | 1.46 | 69.05 | 1.46 | 0 | 0 | 0 |
| 2103 | Au (g/t) | 2.47 | 2.25 | 2.47 | 2.25 | 0 | 0 | 0 |
| 2103 | Pb (%) | 1.48 | 1.72 | 1.48 | 1.72 | 0 | 0 | 0 |
| 2103 | Zn (%) | 5.09 | 1.7 | 5.09 | 1.7 | 0 | 0 | 0 |
| 2103 | Cu (%) | 0.1 | 1.75 | 0.11 | 1.74 | 0 | 0 | -0.01 |
| 2103 | Fe (%) | 30.74 | 1.48 | 30.74 | 1.48 | 0 | 0 | 0 |
| 2104 | Ag (g/t) | 99.57 | 1.71 | 98.01 | 1.68 | -1.56 | -0.02 | -0.03 |
| 2104 | Au (g/t) | 3.76 | 1.64 | 3.52 | 1.51 | -0.24 | -0.06 | -0.13 |
| 2104 | Pb (%) | 1.36 | 1.32 | 1.32 | 1.24 | -0.05 | -0.03 | -0.08 |
| 2104 | Zn (%) | 4.24 | 1.28 | 4.08 | 1.21 | -0.16 | -0.04 | -0.08 |
| 2104 | Cu (%) | 0.18 | 1.63 | 0.18 | 1.54 | -0.01 | -0.03 | -0.08 |
| 2104 | Fe (%) | 37.59 | 1.21 | 37.59 | 1.21 | 0 | 0 | 0 |
| 2106 | Ag (g/t) | 47.41 | 0.87 | 47.41 | 0.87 | 0 | 0 | 0 |
| 2106 | Au (g/t) | 2.82 | 1.35 | 2.82 | 1.35 | 0 | 0 | 0 |
| 2106 | Pb (%) | 0.94 | 1 | 0.94 | 1 | 0 | 0 | 0 |
| 2106 | Zn (%) | 2.91 | 1.18 | 2.91 | 1.18 | 0 | 0 | 0 |
| 2106 | Cu (%) | 0.2 | 2.4 | 0.2 | 2.39 | 0 | 0 | 0 |
| 2106 | Fe (%) | 25.86 | 0.68 | 25.86 | 0.68 | 0 | 0 | 0 |
| 2113 | Ag (g/t) | 37.39 | 0.94 | 37.39 | 0.94 | 0 | 0 | 0 |
| 2113 | Au (g/t) | 0.94 | 1.03 | 0.94 | 1.03 | 0 | 0 | 0 |
| 2113 | Pb (%) | 0.92 | 0.7 | 0.92 | 0.7 | 0 | 0 | 0 |
| 2113 | Zn (%) | 1.76 | 0.92 | 1.76 | 0.92 | 0 | 0 | 0 |
| 2113 | Cu (%) | 0.08 | 0.68 | 0.08 | 0.68 | 0 | 0 | 0 |
| 2113 | Fe (%) | 17.82 | 0.87 | 17.82 | 0.87 | 0 | 0 | 0 |
| 2115 | Ag (g/t) | 25.11 | 0.62 | 25.11 | 0.62 | 0 | 0 | 0 |
| 2115 | Au (g/t) | 0.37 | 0.53 | 0.37 | 0.53 | 0 | 0 | 0 |
| 2115 | Pb (%) | 0.85 | 1.14 | 0.85 | 1.14 | 0 | 0 | 0 |
| 2115 | Zn (%) | 1.92 | 1.08 | 1.92 | 1.08 | 0 | 0 | 0 |
| 2115 | Cu (%) | 0.05 | 0.67 | 0.05 | 0.66 | 0 | 0.01 | -0.01 |
| 2115 | Fe (%) | 16.47 | 0.86 | 16.47 | 0.86 | 0 | 0 | 0 |
| 2117 | Ag (g/t) | 140.7 | 1.26 | 140.7 | 1.26 | 0 | 0 | 0 |
| 2117 | Au (g/t) | 4.72 | 1.66 | 4.72 | 1.66 | 0 | 0 | 0 |
| 2117 | Pb (%) | 1.21 | 1.26 | 1.21 | 1.26 | 0 | 0 | 0 |
| 2117 | Zn (%) | 1.77 | 1.07 | 1.77 | 1.07 | 0 | 0 | 0 |
| 2117 | Cu (%) | 0.26 | 1.69 | 0.26 | 1.69 | 0 | 0 | -0.01 |
| 2117 | Fe (%) | 34.61 | 1.01 | 34.61 | 1.01 | 0 | 0 | 0 |
| 2118 | Ag (g/t) | 58.32 | 0.72 | 58.32 | 0.72 | 0 | 0 | 0 |
| 2118 | Au (g/t) | 2.36 | 1.02 | 2.36 | 1.02 | 0 | 0 | 0 |
| 2118 | Pb (%) | 1.22 | 0.69 | 1.22 | 0.69 | 0 | 0 | 0 |
| 2118 | Zn (%) | 3.19 | 0.62 | 3.19 | 0.62 | 0 | 0 | 0 |
| 2118 | Cu (%) | 0.15 | 1.43 | 0.15 | 1.42 | 0 | 0 | -0.01 |
| 2118 | Fe (%) | 38.73 | 1.04 | 38.73 | 1.04 | 0 | 0 | 0 |
| 2120 | Ag (g/t) | 169.33 | 0.54 | 169.33 | 0.54 | 0 | 0 | 0 |
| 2120 | Au (g/t) | 5.39 | 0.7 | 5.39 | 0.7 | 0 | 0 | 0 |
| 2120 | Pb (%) | 1.01 | 0.83 | 1.01 | 0.83 | 0 | 0 | 0 |
| 2120 | Zn (%) | 3.01 | 1.08 | 3.01 | 1.08 | 0 | 0 | 0 |
| 2120 | Cu (%) | 0.37 | 0.68 | 0.37 | 0.68 | 0 | 0 | 0 |
| 2120 | Fe (%) | 41.91 | 0.61 | 41.91 | 0.61 | 0 | 0 | 0 |
| 2122 | Ag (g/t) | 236.89 | 1.81 | 236.89 | 1.81 | 0 | 0 | 0 |
AYA GOLD & SILVER INC., BOUMADINE POLYMETALLIC PROJECT 435
| | | | | | | | | | | | | | | | | | | | | | | | | | |
| 2122 | Au (g/t) | 1.65 | 1.28 | 1.65 | 1.28 | 0 | 0 | 0 |
| 2122 | Pb (%) | 1.31 | 1.48 | 1.31 | 1.48 | 0 | 0 | 0 |
| 2122 | Zn (%) | 0.68 | 1.2 | 0.68 | 1.2 | 0 | 0 | 0 |
| 2122 | Cu (%) | 0.08 | 1 | 0.08 | 0.98 | 0 | 0.01 | -0.02 |
| 2122 | Fe (%) | 24.71 | 0.93 | 24.71 | 0.93 | 0 | 0 | 0 |
| 2127 | Ag (g/t) | 19.8 | 0.77 | 19.8 | 0.77 | 0 | 0 | 0 |
| 2127 | Au (g/t) | 0.07 | 0.83 | 0.07 | 0.83 | 0 | 0 | 0 |
| 2127 | Pb (%) | 0.12 | 0.69 | 0.12 | 0.69 | 0 | 0 | 0 |
| 2127 | Zn (%) | 1.27 | 0.95 | 1.27 | 0.95 | 0 | 0 | 0 |
| 2127 | Cu (%) | 0.1 | 0.89 | 0.1 | 0.89 | 0 | 0 | 0 |
| 2127 | Fe (%) | 9.84 | 0.3 | 9.84 | 0.3 | 0 | 0 | 0 |
| 2130 | Ag (g/t) | 19.55 | 0.64 | 19.55 | 0.64 | 0 | 0 | 0 |
| 2130 | Au (g/t) | 0.9 | 1.49 | 0.9 | 1.49 | 0 | 0 | 0 |
| 2130 | Pb (%) | 1.43 | 0.97 | 1.43 | 0.97 | 0 | 0 | 0 |
| 2130 | Zn (%) | 2.07 | 1.45 | 2.07 | 1.45 | 0 | 0 | 0 |
| 2130 | Cu (%) | 0.15 | 1.54 | 0.15 | 1.54 | 0 | 0 | 0 |
| 2130 | Fe (%) | 11.62 | 0.55 | 11.62 | 0.55 | 0 | 0 | 0 |
| 2131 | Ag (g/t) | 21.9 | 0.74 | 21.9 | 0.74 | 0 | 0 | 0 |
| 2131 | Au (g/t) | 1.28 | 0.9 | 1.28 | 0.9 | 0 | 0 | 0 |
| 2131 | Pb (%) | 0.69 | 1.14 | 0.69 | 1.14 | 0 | 0 | 0 |
| 2131 | Zn (%) | 1.53 | 1.34 | 1.53 | 1.34 | 0 | 0 | 0 |
| 2131 | Cu (%) | 0.03 | 0.74 | 0.03 | 0.74 | 0 | 0.01 | 0 |
| 2131 | Fe (%) | 23.49 | 0.61 | 23.49 | 0.61 | 0 | 0 | 0 |
| 2132 | Ag (g/t) | 22.7 | 1.36 | 22.7 | 1.36 | 0 | 0 | 0 |
| 2132 | Au (g/t) | 0.47 | 1.82 | 0.47 | 1.82 | 0 | 0 | 0 |
| 2132 | Pb (%) | 0.64 | 2.15 | 0.64 | 2.15 | 0 | 0 | 0 |
| 2132 | Zn (%) | 1.14 | 1.09 | 1.14 | 1.09 | 0 | 0 | 0 |
| 2132 | Cu (%) | 0.05 | 1.98 | 0.05 | 1.97 | 0 | 0 | -0.01 |
| 2132 | Fe (%) | 11.08 | 1.22 | 11.08 | 1.22 | 0 | 0 | 0 |
| 2203 | Ag (g/t) | 126.03 | 1.48 | 105.84 | 1.21 | -20.18 | -0.16 | -0.28 |
| 2203 | Au (g/t) | 0.65 | 1.63 | 0.65 | 1.63 | 0 | 0 | 0 |
| 2203 | Pb (%) | 1.46 | 0.76 | 1.46 | 0.76 | 0 | 0 | 0 |
| 2203 | Zn (%) | 5.1 | 1.11 | 5.1 | 1.11 | 0 | 0 | 0 |
| 2203 | Cu (%) | 0.02 | 0.62 | 0.02 | 0.7 | 0 | 0.13 | 0.07 |
| 2203 | Fe (%) | 20.8 | 0.82 | 20.8 | 0.82 | 0 | 0 | 0 |
| 2207 | Ag (g/t) | 131.52 | 1.62 | 131.52 | 1.62 | 0 | 0 | 0 |
| 2207 | Au (g/t) | 3.82 | 1.68 | 3.82 | 1.68 | 0 | 0 | 0 |
| 2207 | Pb (%) | 1.12 | 1.36 | 1.12 | 1.36 | 0 | 0 | 0 |
| 2207 | Zn (%) | 1.13 | 0.82 | 1.13 | 0.82 | 0 | 0 | 0 |
| 2207 | Cu (%) | 0.03 | 0.98 | 0.03 | 0.91 | 0 | 0.04 | -0.07 |
| 2207 | Fe (%) | 19.12 | 0.67 | 19.12 | 0.67 | 0 | 0 | 0 |
| 2213 | Ag (g/t) | 83.75 | 0.96 | 83.75 | 0.96 | 0 | 0 | 0 |
| 2213 | Au (g/t) | 4.74 | 0.75 | 4.74 | 0.75 | 0 | 0 | 0 |
| 2213 | Pb (%) | 0.75 | 0.82 | 0.75 | 0.82 | 0 | 0 | 0 |
| 2213 | Zn (%) | 1.57 | 1.26 | 1.57 | 1.26 | 0 | 0 | 0 |
| 2213 | Cu (%) | 0.14 | 0.59 | 0.14 | 0.6 | 0 | 0.01 | 0.01 |
| 2213 | Fe (%) | 26.85 | 0.43 | 26.85 | 0.43 | 0 | 0 | 0 |
| 2215 | Ag (g/t) | 22.12 | 1.28 | 22.12 | 1.28 | 0 | 0 | 0 |
| 2215 | Au (g/t) | 0.43 | 1.07 | 0.43 | 1.07 | 0 | 0 | 0 |
| 2215 | Pb (%) | 1.22 | 1.2 | 1.22 | 1.2 | 0 | 0 | 0 |
| 2215 | Zn (%) | 16.14 | 1.49 | 16.14 | 1.49 | 0 | 0 | 0 |
AYA GOLD & SILVER INC., BOUMADINE POLYMETALLIC PROJECT 436
| | | | | | | | | | | | | | | | | | | | | | | | | | |
| 2215 | Cu (%) | 0.05 | 1.18 | 0.05 | 1.18 | 0 | 0 | 0 |
| 2215 | Fe (%) | 39.98 | 0.88 | 39.98 | 0.88 | 0 | 0 | 0 |
| 2216 | Ag (g/t) | 28.53 | 0.82 | 28.53 | 0.82 | 0 | 0 | 0 |
| 2216 | Au (g/t) | 0.85 | 1.37 | 0.85 | 1.37 | 0 | 0 | 0 |
| 2216 | Pb (%) | 0.51 | 1.17 | 0.51 | 1.17 | 0 | 0 | 0 |
| 2216 | Zn (%) | 1.96 | 1.62 | 1.96 | 1.62 | 0 | 0 | 0 |
| 2216 | Cu (%) | 0.02 | 0.76 | 0.02 | 0.71 | 0 | 0.03 | -0.04 |
| 2216 | Fe (%) | 13.51 | 0.47 | 13.51 | 0.47 | 0 | 0 | 0 |
| 2219 | Ag (g/t) | 159.53 | 1.36 | 159.53 | 1.36 | 0 | 0 | 0 |
| 2219 | Au (g/t) | 5.8 | 1.34 | 5.8 | 1.34 | 0 | 0 | 0 |
| 2219 | Pb (%) | 1.72 | 0.71 | 1.72 | 0.71 | 0 | 0 | 0 |
| 2219 | Zn (%) | 1.76 | 1.63 | 1.76 | 1.63 | 0 | 0 | 0 |
| 2219 | Cu (%) | 0.25 | 1.3 | 0.25 | 1.3 | 0 | 0 | 0 |
| 2219 | Fe (%) | 46.91 | 1.02 | 46.91 | 1.02 | 0 | 0 | 0 |
| 2221 | Ag (g/t) | 34.16 | 0.75 | 34.16 | 0.75 | 0 | 0 | 0 |
| 2221 | Au (g/t) | 0.69 | 1.37 | 0.69 | 1.37 | 0 | 0 | 0 |
| 2221 | Pb (%) | 1.05 | 0.88 | 1.05 | 0.88 | 0 | 0 | 0 |
| 2221 | Zn (%) | 1.07 | 1.01 | 1.07 | 1.01 | 0 | 0 | 0 |
| 2221 | Cu (%) | 0.03 | 1.17 | 0.03 | 1.15 | 0 | 0.01 | -0.02 |
| 2221 | Fe (%) | 14.05 | 0.89 | 14.05 | 0.89 | 0 | 0 | 0 |
| 2222 | Ag (g/t) | 35.97 | 0.84 | 35.97 | 0.84 | 0 | 0 | 0 |
| 2222 | Au (g/t) | 0.31 | 0.48 | 0.31 | 0.48 | 0 | 0 | 0 |
| 2222 | Pb (%) | 1.84 | 1.18 | 1.84 | 1.18 | 0 | 0 | 0 |
| 2222 | Zn (%) | 20.38 | 1.39 | 16.46 | 1.28 | -3.91 | -0.19 | -0.11 |
| 2222 | Cu (%) | 0.15 | 1.45 | 0.15 | 1.43 | 0 | 0.01 | -0.02 |
| 2222 | Fe (%) | 12.75 | 0.45 | 12.75 | 0.45 | 0 | 0 | 0 |
| 2223 | Ag (g/t) | 105.52 | 1.35 | 95.32 | 1.25 | -10.2 | -0.1 | -0.1 |
| 2223 | Au (g/t) | 2.77 | 1.56 | 2.77 | 1.56 | 0 | 0 | 0 |
| 2223 | Pb (%) | 1.15 | 0.92 | 1.15 | 0.92 | 0 | 0 | 0 |
| 2223 | Zn (%) | 3.84 | 1.17 | 3.84 | 1.17 | 0 | 0 | 0 |
| 2223 | Cu (%) | 0.04 | 0.87 | 0.04 | 0.85 | 0 | 0.05 | -0.02 |
| 2223 | Fe (%) | 27.96 | 1.22 | 27.96 | 1.22 | 0 | 0 | 0 |
| 2224 | Ag (g/t) | 46.72 | 0.32 | 46.72 | 0.32 | 0 | 0 | 0 |
| 2224 | Au (g/t) | 1.41 | 1 | 1.41 | 1 | 0 | 0 | 0 |
| 2224 | Pb (%) | 5.15 | 0.91 | 2.6 | 0.81 | -2.55 | -0.5 | -0.09 |
| 2224 | Zn (%) | 1.23 | 0.84 | 1.23 | 0.84 | 0 | 0 | 0 |
| 2224 | Cu (%) | 0.03 | 0.24 | 0.04 | 0.17 | 0 | 0.06 | -0.07 |
| 2224 | Fe (%) | 12.9 | 0.78 | 12.9 | 0.78 | 0 | 0 | 0 |
| 2225 | Ag (g/t) | 44.93 | 1.47 | 44.93 | 1.47 | 0 | 0 | 0 |
| 2225 | Au (g/t) | 3.86 | 1.31 | 3.86 | 1.31 | 0 | 0 | 0 |
| 2225 | Pb (%) | 0.39 | 1.38 | 0.39 | 1.38 | 0 | 0 | 0 |
| 2225 | Zn (%) | 0.49 | 1.11 | 0.49 | 1.11 | 0 | 0 | 0 |
| 2225 | Cu (%) | 0.1 | 1.47 | 0.1 | 1.47 | 0 | 0 | 0 |
| 2225 | Fe (%) | 26.53 | 1.22 | 26.53 | 1.22 | 0 | 0 | 0 |
| 2235 | Ag (g/t) | 19.09 | 1.11 | 19.09 | 1.11 | 0 | 0 | 0 |
| 2235 | Au (g/t) | 4.07 | 1.52 | 4.07 | 1.52 | 0 | 0 | 0 |
| 2235 | Pb (%) | 0.56 | 1.22 | 0.56 | 1.22 | 0 | 0 | 0 |
| 2235 | Zn (%) | 3.28 | 0.78 | 3.28 | 0.78 | 0 | 0 | 0 |
| 2235 | Cu (%) | 0.03 | 0.58 | 0.03 | 0.58 | 0 | 0 | 0 |
| 2235 | Fe (%) | 14.27 | 1.03 | 14.27 | 1.03 | 0 | 0 | 0 |
| 2236 | Ag (g/t) | 106.32 | 0.68 | 106.32 | 0.68 | 0 | 0 | 0 |
AYA GOLD & SILVER INC., BOUMADINE POLYMETALLIC PROJECT 437
| | | | | | | | | | | | | | | | | | | | | | | | | | |
| 2236 | Au (g/t) | 1.03 | 0.79 | 1.03 | 0.79 | 0 | 0 | 0 |
| 2236 | Pb (%) | 0.85 | 0.59 | 0.85 | 0.59 | 0 | 0 | 0 |
| 2236 | Zn (%) | 2.29 | 0.69 | 2.29 | 0.69 | 0 | 0 | 0 |
| 2236 | Cu (%) | 0.04 | 0.8 | 0.04 | 0.79 | 0 | 0.01 | -0.02 |
| 2236 | Fe (%) | 27.33 | 0.37 | 27.33 | 0.37 | 0 | 0 | 0 |
| 2309 | Ag (g/t) | 117.84 | 1.65 | 117.84 | 1.65 | 0 | 0 | 0 |
| 2309 | Au (g/t) | 1.65 | 1.51 | 1.65 | 1.51 | 0 | 0 | 0 |
| 2309 | Pb (%) | 1.47 | 1.43 | 1.47 | 1.43 | 0 | 0 | 0 |
| 2309 | Zn (%) | 0.62 | 0.98 | 0.62 | 0.98 | 0 | 0 | 0 |
| 2309 | Cu (%) | 0.11 | 1.15 | 0.11 | 1.15 | 0 | 0 | 0 |
| 2309 | Fe (%) | 23.55 | 0.61 | 23.55 | 0.61 | 0 | 0 | 0 |
| 2311 | Ag (g/t) | 46.16 | 0.78 | 46.16 | 0.78 | 0 | 0 | 0 |
| 2311 | Au (g/t) | 1.72 | 0.85 | 1.72 | 0.85 | 0 | 0 | 0 |
| 2311 | Pb (%) | 1.07 | 1.72 | 1.07 | 1.72 | 0 | 0 | 0 |
| 2311 | Zn (%) | 3.22 | 1.39 | 3.22 | 1.39 | 0 | 0 | 0 |
| 2311 | Cu (%) | 0.07 | 1.22 | 0.07 | 1.21 | 0 | 0.01 | -0.01 |
| 2311 | Fe (%) | 24.58 | 0.61 | 24.58 | 0.61 | 0 | 0 | 0 |
| 2314 | Ag (g/t) | 74.95 | 1.27 | 74.95 | 1.27 | 0 | 0 | 0 |
| 2314 | Au (g/t) | 0.68 | 0.57 | 0.68 | 0.57 | 0 | 0 | 0 |
| 2314 | Pb (%) | 1.06 | 0.78 | 1.06 | 0.78 | 0 | 0 | 0 |
| 2314 | Zn (%) | 2.82 | 1.34 | 2.82 | 1.34 | 0 | 0 | 0 |
| 2314 | Cu (%) | 0.16 | 0.74 | 0.16 | 0.74 | 0 | 0 | 0 |
| 2314 | Fe (%) | 28 | 0.65 | 28 | 0.65 | 0 | 0 | 0 |
| 2327 | Ag (g/t) | 33.13 | 0.55 | 33.13 | 0.55 | 0 | 0 | 0 |
| 2327 | Au (g/t) | 0.88 | 0.99 | 0.88 | 0.99 | 0 | 0 | 0 |
| 2327 | Pb (%) | 0.24 | 0.29 | 0.24 | 0.29 | 0 | 0 | 0 |
| 2327 | Zn (%) | 1.03 | 0.67 | 1.03 | 0.67 | 0 | 0 | 0 |
| 2327 | Cu (%) | 0.02 | 0.77 | 0.02 | 0.77 | 0 | 0.01 | 0 |
| 2327 | Fe (%) | 16.08 | 0.75 | 16.08 | 0.75 | 0 | 0 | 0 |
| 2400 | Ag (g/t) | 144.66 | 0.89 | 142.39 | 0.89 | -2.27 | -0.02 | 0 |
| 2400 | Au (g/t) | 2.76 | 1 | 2.76 | 1 | 0 | 0 | 0 |
| 2400 | Pb (%) | 1.34 | 2.11 | 1.11 | 1.68 | -0.24 | -0.17 | -0.43 |
| 2400 | Zn (%) | 1.85 | 1.41 | 1.85 | 1.41 | 0 | 0 | 0 |
| 2400 | Cu (%) | 0.12 | 1.47 | 0.12 | 1.45 | 0 | 0.01 | -0.02 |
| 2400 | Fe (%) | 41.14 | 0.7 | 41.14 | 0.7 | 0 | 0 | 0 |
| 2401 | Ag (g/t) | 43.93 | 1.02 | 43.93 | 1.02 | 0 | 0 | 0 |
| 2401 | Au (g/t) | 0.44 | 2.36 | 0.44 | 2.36 | 0 | 0 | 0 |
| 2401 | Pb (%) | 2.58 | 1.68 | 2.55 | 1.68 | -0.03 | -0.01 | 0 |
| 2401 | Zn (%) | 1.87 | 1.48 | 1.87 | 1.48 | 0 | 0 | 0 |
| 2401 | Cu (%) | 0.05 | 1.64 | 0.05 | 1.63 | 0 | 0 | -0.01 |
| 2401 | Fe (%) | 15.4 | 1.68 | 15.4 | 1.68 | 0 | 0 | 0 |
| 2405 | Ag (g/t) | 134.01 | 1.43 | 51.73 | 0.64 | -82.28 | -0.61 | -0.79 |
| 2405 | Au (g/t) | 1.81 | 1.58 | 0.56 | 0.79 | -1.25 | -0.69 | -0.79 |
| 2405 | Pb (%) | 1.6 | 0.86 | 1.6 | 0.86 | 0 | 0 | 0 |
| 2405 | Zn (%) | 3.33 | 1.16 | 2.27 | 0.94 | -1.06 | -0.32 | -0.22 |
| 2405 | Cu (%) | 0.05 | 0.58 | 0.06 | 0.6 | 0 | 0.04 | 0.01 |
| 2405 | Fe (%) | 55.31 | 1.12 | 48.07 | 0.99 | -7.24 | -0.13 | -0.12 |
| 2408 | Ag (g/t) | 69.81 | 1.17 | 69.81 | 1.17 | 0 | 0 | 0 |
| 2408 | Au (g/t) | 1.03 | 0.66 | 1.03 | 0.66 | 0 | 0 | 0 |
| 2408 | Pb (%) | 0.47 | 1.41 | 0.47 | 1.41 | 0 | 0 | 0 |
| 2408 | Zn (%) | 0.69 | 1.38 | 0.69 | 1.38 | 0 | 0 | 0 |
AYA GOLD & SILVER INC., BOUMADINE POLYMETALLIC PROJECT 438
| | | | | | | | | | | | | | | | | | | | | | | | | | |
| 2408 | Cu (%) | 0.09 | 1.75 | 0.09 | 1.75 | 0 | 0 | 0 |
| 2408 | Fe (%) | 13.43 | 0.54 | 13.43 | 0.54 | 0 | 0 | 0 |
| 2410 | Ag (g/t) | 117.02 | 1.79 | 119.56 | 1.8 | 2.54 | 0.02 | 0.01 |
| 2410 | Au (g/t) | 2.39 | 2.03 | 2.43 | 2.03 | 0.04 | 0.02 | 0 |
| 2410 | Pb (%) | 1.4 | 1.23 | 1.4 | 1.23 | 0 | 0 | 0 |
| 2410 | Zn (%) | 3.33 | 1.07 | 3.36 | 1.07 | 0.03 | 0.01 | 0 |
| 2410 | Cu (%) | 0.08 | 1.98 | 0.08 | 1.96 | 0 | 0.01 | -0.02 |
| 2410 | Fe (%) | 30.62 | 1.23 | 30.62 | 1.23 | 0 | 0 | 0 |
| 2411 | Ag (g/t) | 29.57 | 0.81 | 29.57 | 0.81 | 0 | 0 | 0 |
| 2411 | Au (g/t) | 2.3 | 1.34 | 2.3 | 1.34 | 0 | 0 | 0 |
| 2411 | Pb (%) | 0.34 | 0.84 | 0.34 | 0.84 | 0 | 0 | 0 |
| 2411 | Zn (%) | 0.75 | 0.81 | 0.75 | 0.81 | 0 | 0 | 0 |
| 2411 | Cu (%) | 0.05 | 0.86 | 0.05 | 0.86 | 0 | 0 | 0 |
| 2411 | Fe (%) | 34.54 | 1.13 | 34.54 | 1.13 | 0 | 0 | 0 |
| 2417 | Ag (g/t) | 33.86 | 0.84 | 33.86 | 0.84 | 0 | 0 | 0 |
| 2417 | Au (g/t) | 1.34 | 1.01 | 1.34 | 1.01 | 0 | 0 | 0 |
| 2417 | Pb (%) | 0.33 | 0.99 | 0.33 | 0.99 | 0 | 0 | 0 |
| 2417 | Zn (%) | 0.59 | 1.07 | 0.59 | 1.07 | 0 | 0 | 0 |
| 2417 | Cu (%) | 0.01 | 0.35 | 0.01 | 0.35 | 0 | 0 | 0 |
| 2417 | Fe (%) | 20.67 | 0.61 | 20.67 | 0.61 | 0 | 0 | 0 |
| 2424 | Ag (g/t) | 21.66 | 0.42 | 21.66 | 0.42 | 0 | 0 | 0 |
| 2424 | Au (g/t) | 0.59 | 0.84 | 0.59 | 0.84 | 0 | 0 | 0 |
| 2424 | Pb (%) | 0.59 | 0.8 | 0.59 | 0.8 | 0 | 0 | 0 |
| 2424 | Zn (%) | 1.44 | 0.78 | 1.44 | 0.78 | 0 | 0 | 0 |
| 2424 | Cu (%) | 0.02 | 0.89 | 0.02 | 0.89 | 0 | 0 | 0 |
| 2424 | Fe (%) | 15.1 | 0.51 | 15.1 | 0.51 | 0 | 0 | 0 |
| 2425 | Ag (g/t) | 26.48 | 0.77 | 26.48 | 0.77 | 0 | 0 | 0 |
| 2425 | Au (g/t) | 0.2 | 1.66 | 0.2 | 1.66 | 0 | 0 | 0 |
| 2425 | Pb (%) | 1.73 | 1.26 | 1.65 | 1.24 | -0.08 | -0.05 | -0.02 |
| 2425 | Zn (%) | 0.92 | 1.11 | 0.92 | 1.11 | 0 | 0 | 0 |
| 2425 | Cu (%) | 0.21 | 1.08 | 0.21 | 1.08 | 0 | 0 | 0 |
| 2425 | Fe (%) | 2.2 | 0.74 | 2.2 | 0.74 | 0 | 0 | 0 |
| 2502 | Ag (g/t) | 42.23 | 1.12 | 42.23 | 1.12 | 0 | 0 | 0 |
| 2502 | Au (g/t) | 2.15 | 1.39 | 2.15 | 1.39 | 0 | 0 | 0 |
| 2502 | Pb (%) | 1.61 | 1.64 | 1.47 | 1.6 | -0.15 | -0.09 | -0.04 |
| 2502 | Zn (%) | 1.45 | 1.36 | 1.45 | 1.36 | 0 | 0 | 0 |
| 2502 | Cu (%) | 0.2 | 1.44 | 0.2 | 1.44 | 0 | 0 | 0 |
| 2502 | Fe (%) | 34.42 | 1.01 | 34.42 | 1.01 | 0 | 0 | 0 |
| 2507 | Ag (g/t) | 79.07 | 1.57 | 79.07 | 1.57 | 0 | 0 | 0 |
| 2507 | Au (g/t) | 2.82 | 2.87 | 2.82 | 2.87 | 0 | 0 | 0 |
| 2507 | Pb (%) | 0.88 | 1.5 | 0.88 | 1.5 | 0 | 0 | 0 |
| 2507 | Zn (%) | 2.19 | 1.56 | 2.19 | 1.56 | 0 | 0 | 0 |
| 2507 | Cu (%) | 0.12 | 1.67 | 0.12 | 1.65 | 0 | 0.01 | -0.02 |
| 2507 | Fe (%) | 21.73 | 1.39 | 21.73 | 1.39 | 0 | 0 | 0 |
| 2510 | Ag (g/t) | 48.26 | 0.83 | 48.26 | 0.83 | 0 | 0 | 0 |
| 2510 | Au (g/t) | 1.28 | 1.24 | 1.28 | 1.24 | 0 | 0 | 0 |
| 2510 | Pb (%) | 0.71 | 0.83 | 0.71 | 0.83 | 0 | 0 | 0 |
| 2510 | Zn (%) | 0.89 | 0.84 | 0.89 | 0.84 | 0 | 0 | 0 |
| 2510 | Cu (%) | 0.24 | 1.26 | 0.24 | 1.26 | 0 | 0 | 0 |
| 2510 | Fe (%) | 53.06 | 1.33 | 46.81 | 1.2 | -6.25 | -0.12 | -0.13 |
| 2538 | Ag (g/t) | 12.49 | 0.73 | 12.49 | 0.73 | 0 | 0 | 0 |
AYA GOLD & SILVER INC., BOUMADINE POLYMETALLIC PROJECT 439
| | | | | | | | | | | | | | | | | | | | | | | | | | |
| 2538 | Au (g/t) | 0.1 | 0.97 | 0.1 | 0.97 | 0 | 0 | 0 |
| 2538 | Pb (%) | 0.8 | 1.47 | 0.8 | 1.47 | 0 | 0 | 0 |
| 2538 | Zn (%) | 3.1 | 1.97 | 2.85 | 1.9 | -0.25 | -0.08 | -0.07 |
| 2538 | Cu (%) | 0.02 | 1.5 | 0.02 | 1.44 | 0 | 0.03 | -0.06 |
| 2538 | Fe (%) | 6.19 | 0.55 | 6.19 | 0.55 | 0 | 0 | 0 |
| 2614 | Ag (g/t) | 51.77 | 0.59 | 51.77 | 0.59 | 0 | 0 | 0 |
| 2614 | Au (g/t) | 0.4 | 0.83 | 0.4 | 0.83 | 0 | 0 | 0 |
| 2614 | Pb (%) | 0.96 | 0.72 | 0.96 | 0.72 | 0 | 0 | 0 |
| 2614 | Zn (%) | 3.33 | 1.04 | 3.33 | 1.04 | 0 | 0 | 0 |
| 2614 | Cu (%) | 0.27 | 1.67 | 0.27 | 1.66 | 0 | 0.01 | -0.01 |
| 2614 | Fe (%) | 35.15 | 0.53 | 35.15 | 0.53 | 0 | 0 | 0 |
| 2729 | Ag (g/t) | 36.32 | 0.72 | 36.32 | 0.72 | 0 | 0 | 0 |
| 2729 | Au (g/t) | 1.87 | 0.82 | 1.87 | 0.82 | 0 | 0 | 0 |
| 2729 | Pb (%) | 0.51 | 0.28 | 0.51 | 0.28 | 0 | 0 | 0 |
| 2729 | Zn (%) | 0.61 | 0.51 | 0.61 | 0.51 | 0 | 0 | 0 |
| 2729 | Cu (%) | 0.09 | 1.06 | 0.09 | 1.06 | 0 | 0 | 0 |
| 2729 | Fe (%) | 32.21 | 0.72 | 32.21 | 0.72 | 0 | 0 | 0 |
| 2802 | Ag (g/t) | 63.43 | 1.1 | 62.05 | 1.08 | -1.38 | -0.02 | -0.02 |
| 2802 | Au (g/t) | 1.36 | 1.32 | 1.36 | 1.32 | 0 | 0 | 0 |
| 2802 | Pb (%) | 2.56 | 1.12 | 2.56 | 1.12 | 0 | 0 | 0 |
| 2802 | Zn (%) | 4.83 | 1.39 | 4.83 | 1.39 | 0 | 0 | 0 |
| 2802 | Cu (%) | 0.05 | 1.08 | 0.05 | 1.06 | 0 | 0.01 | -0.02 |
| 2802 | Fe (%) | 16.78 | 1.07 | 16.78 | 1.07 | 0 | 0 | 0 |
| 3001 | Ag (g/t) | 68.96 | 2.07 | 49.24 | 1.29 | -19.72 | -0.29 | -0.78 |
| 3001 | Au (g/t) | 1.34 | 1.49 | 1.34 | 1.49 | 0 | 0 | 0 |
| 3001 | Pb (%) | 0.64 | 0.97 | 0.64 | 0.97 | 0 | 0 | 0 |
| 3001 | Zn (%) | 1.62 | 1.21 | 1.62 | 1.21 | 0 | 0 | 0 |
| 3001 | Cu (%) | 0.1 | 1.67 | 0.1 | 1.67 | 0 | 0 | 0 |
| 3001 | Fe (%) | 28.67 | 1.16 | 28.67 | 1.16 | 0 | 0 | 0 |
| 3002 | Ag (g/t) | 28.9 | 0.54 | 28.9 | 0.54 | 0 | 0 | 0 |
| 3002 | Au (g/t) | 0.72 | 0.52 | 0.72 | 0.52 | 0 | 0 | 0 |
| 3002 | Pb (%) | 0.76 | 1.33 | 0.76 | 1.33 | 0 | 0 | 0 |
| 3002 | Zn (%) | 1.5 | 0.82 | 1.5 | 0.82 | 0 | 0 | 0 |
| 3002 | Cu (%) | 0.02 | 0.5 | 0.03 | 0.5 | 0 | 0.01 | 0 |
| 3002 | Fe (%) | 14.06 | 0.45 | 14.06 | 0.45 | 0 | 0 | 0 |
| 3003 | Ag (g/t) | 17.77 | 0.93 | 17.77 | 0.93 | 0 | 0 | 0 |
| 3003 | Au (g/t) | 0.19 | 0.85 | 0.19 | 0.85 | 0 | 0 | 0 |
| 3003 | Pb (%) | 0.39 | 0.84 | 0.39 | 0.84 | 0 | 0 | 0 |
| 3003 | Zn (%) | 0.78 | 1.05 | 0.78 | 1.05 | 0 | 0 | 0 |
| 3003 | Cu (%) | 0.04 | 0.56 | 0.04 | 0.56 | 0 | 0 | 0 |
| 3003 | Fe (%) | 16.71 | 0.67 | 16.71 | 0.67 | 0 | 0 | 0 |
| 3004 | Ag (g/t) | 31.97 | 0.93 | 31.97 | 0.93 | 0 | 0 | 0 |
| 3004 | Au (g/t) | 1.19 | 1.29 | 1.19 | 1.29 | 0 | 0 | 0 |
| 3004 | Pb (%) | 0.85 | 1.79 | 0.85 | 1.79 | 0 | 0 | 0 |
| 3004 | Zn (%) | 1.34 | 1.09 | 1.34 | 1.09 | 0 | 0 | 0 |
| 3004 | Cu (%) | 0.05 | 1.37 | 0.05 | 1.38 | 0 | 0.02 | 0.02 |
| 3004 | Fe (%) | 16.74 | 0.77 | 16.74 | 0.77 | 0 | 0 | 0 |
| 3005 | Ag (g/t) | 61.28 | 0.68 | 61.28 | 0.68 | 0 | 0 | 0 |
| 3005 | Au (g/t) | 2.51 | 1.2 | 2.51 | 1.2 | 0 | 0 | 0 |
| 3005 | Pb (%) | 0.83 | 0.7 | 0.83 | 0.7 | 0 | 0 | 0 |
| 3005 | Zn (%) | 1.91 | 1.29 | 1.91 | 1.29 | 0 | 0 | 0 |
AYA GOLD & SILVER INC., BOUMADINE POLYMETALLIC PROJECT 440
| | | | | | | | | | | | | | | | | | | | | | | | | | |
| 3005 | Cu (%) | 0.05 | 0.75 | 0.05 | 0.74 | 0 | 0.02 | -0.01 |
| 3005 | Fe (%) | 35.41 | 0.76 | 35.41 | 0.76 | 0 | 0 | 0 |
| 3006 | Ag (g/t) | 55.43 | 1.18 | 55.43 | 1.18 | 0 | 0 | 0 |
| 3006 | Au (g/t) | 1.18 | 0.98 | 1.18 | 0.98 | 0 | 0 | 0 |
| 3006 | Pb (%) | 0.85 | 0.92 | 0.85 | 0.92 | 0 | 0 | 0 |
| 3006 | Zn (%) | 5.2 | 0.97 | 4.66 | 0.9 | -0.53 | -0.1 | -0.07 |
| 3006 | Cu (%) | 0.15 | 1.37 | 0.15 | 1.37 | 0 | 0 | 0 |
| 3006 | Fe (%) | 35.87 | 1.03 | 35.87 | 1.03 | 0 | 0 | 0 |
| 3007 | Ag (g/t) | 56.4 | 1.07 | 56.4 | 1.07 | 0 | 0 | 0 |
| 3007 | Au (g/t) | 0.49 | 1.48 | 0.49 | 1.48 | 0 | 0 | 0 |
| 3007 | Pb (%) | 0.9 | 1.21 | 0.9 | 1.21 | 0 | 0 | 0 |
| 3007 | Zn (%) | 2 | 0.44 | 2 | 0.44 | 0 | 0 | 0 |
| 3007 | Cu (%) | 0.12 | 1.06 | 0.12 | 1.06 | 0 | 0 | 0 |
| 3007 | Fe (%) | 27.03 | 0.55 | 27.03 | 0.55 | 0 | 0 | 0 |
| 3008 | Ag (g/t) | 83.32 | 0.85 | 83.32 | 0.85 | 0 | 0 | 0 |
| 3008 | Au (g/t) | 0.32 | 0.53 | 0.32 | 0.53 | 0 | 0 | 0 |
| 3008 | Pb (%) | 0.56 | 0.61 | 0.56 | 0.61 | 0 | 0 | 0 |
| 3008 | Zn (%) | 1.94 | 0.45 | 1.94 | 0.45 | 0 | 0 | 0 |
| 3008 | Cu (%) | 0.04 | 0.55 | 0.04 | 0.55 | 0 | 0 | 0 |
| 3008 | Fe (%) | 40.74 | 0.97 | 40.74 | 0.97 | 0 | 0 | 0 |
| 3009 | Ag (g/t) | 90.82 | 1.49 | 90.82 | 1.49 | 0 | 0 | 0 |
| 3009 | Au (g/t) | 6.23 | 2.56 | 6.23 | 2.56 | 0 | 0 | 0 |
| 3009 | Pb (%) | 1.2 | 1.17 | 1.2 | 1.17 | 0 | 0 | 0 |
| 3009 | Zn (%) | 1.71 | 0.9 | 1.71 | 0.9 | 0 | 0 | 0 |
| 3009 | Cu (%) | 0.12 | 1.66 | 0.12 | 1.65 | 0 | 0.01 | 0 |
| 3009 | Fe (%) | 57.44 | 0.99 | 57.44 | 0.99 | 0 | 0 | 0 |
| 3010 | Ag (g/t) | 29.98 | 1.27 | 29.98 | 1.27 | 0 | 0 | 0 |
| 3010 | Au (g/t) | 2.12 | 1.01 | 2.12 | 1.01 | 0 | 0 | 0 |
| 3010 | Pb (%) | 0.5 | 1.09 | 0.5 | 1.09 | 0 | 0 | 0 |
| 3010 | Zn (%) | 0.61 | 0.94 | 0.61 | 0.94 | 0 | 0 | 0 |
| 3010 | Cu (%) | 0.1 | 1.63 | 0.1 | 1.63 | 0 | 0 | 0 |
| 3010 | Fe (%) | 18.53 | 0.77 | 18.53 | 0.77 | 0 | 0 | 0 |
| 3011 | Ag (g/t) | 20.77 | 0.66 | 20.77 | 0.66 | 0 | 0 | 0 |
| 3011 | Au (g/t) | 0.64 | 0.59 | 0.64 | 0.59 | 0 | 0 | 0 |
| 3011 | Pb (%) | 0.66 | 0.95 | 0.66 | 0.95 | 0 | 0 | 0 |
| 3011 | Zn (%) | 2.56 | 0.74 | 2.55 | 0.74 | -0.01 | -0.01 | 0 |
| 3011 | Cu (%) | 0.03 | 0.77 | 0.03 | 0.76 | 0 | 0.01 | -0.01 |
| 3011 | Fe (%) | 17.48 | 0.77 | 16.37 | 0.67 | -1.1 | -0.06 | -0.1 |
| 3100 | Ag (g/t) | 13.19 | 0.73 | 13.19 | 0.73 | 0 | 0 | 0 |
| 3100 | Au (g/t) | 0.11 | 0.34 | 0.11 | 0.34 | 0 | 0 | 0 |
| 3100 | Pb (%) | 0.48 | 0.75 | 0.48 | 0.75 | 0 | 0 | 0 |
| 3100 | Zn (%) | 3.46 | 0.89 | 3.34 | 0.89 | -0.13 | -0.04 | 0 |
| 3100 | Cu (%) | 0.01 | 0.52 | 0.01 | 0.59 | 0 | 0.17 | 0.07 |
| 3100 | Fe (%) | 4.96 | 0.67 | 4.96 | 0.67 | 0 | 0 | 0 |
| 3101 | Ag (g/t) | 58.14 | 1.34 | 54.41 | 1.14 | -3.73 | -0.06 | -0.2 |
| 3101 | Au (g/t) | 2.26 | 1.31 | 2.18 | 1.2 | -0.08 | -0.04 | -0.1 |
| 3101 | Pb (%) | 0.64 | 1.66 | 0.61 | 1.57 | -0.02 | -0.03 | -0.08 |
| 3101 | Zn (%) | 1.58 | 1.32 | 1.49 | 1.19 | -0.09 | -0.06 | -0.13 |
| 3101 | Cu (%) | 0.14 | 1.99 | 0.12 | 1.63 | -0.01 | -0.11 | -0.36 |
| 3101 | Fe (%) | 30.86 | 1.08 | 30.86 | 1.08 | 0 | 0 | 0 |
| 3102 | Ag (g/t) | 107.27 | 1.43 | 99.83 | 1.32 | -7.43 | -0.07 | -0.11 |
AYA GOLD & SILVER INC., BOUMADINE POLYMETALLIC PROJECT 441
| | | | | | | | | | | | | | | | | | | | | | | | | | |
| 3102 | Au (g/t) | 1.94 | 1.07 | 1.94 | 1.07 | 0 | 0 | 0 |
| 3102 | Pb (%) | 1.06 | 1.57 | 1.06 | 1.57 | 0 | 0 | 0 |
| 3102 | Zn (%) | 1.91 | 1.24 | 1.9 | 1.23 | -0.01 | 0 | -0.01 |
| 3102 | Cu (%) | 0.11 | 1.24 | 0.11 | 1.24 | 0 | 0 | 0 |
| 3102 | Fe (%) | 31.26 | 0.75 | 31.26 | 0.75 | 0 | 0 | 0 |
| 3103 | Ag (g/t) | 59.16 | 1.56 | 52.54 | 1.34 | -6.62 | -0.11 | -0.21 |
| 3103 | Au (g/t) | 3.32 | 1.53 | 2.56 | 1.33 | -0.77 | -0.23 | -0.2 |
| 3103 | Pb (%) | 0.35 | 0.86 | 0.35 | 0.86 | 0 | 0 | 0 |
| 3103 | Zn (%) | 1.28 | 1.89 | 0.84 | 0.88 | -0.44 | -0.34 | -1.02 |
| 3103 | Cu (%) | 0.18 | 2.35 | 0.16 | 2.2 | -0.02 | -0.14 | -0.16 |
| 3103 | Fe (%) | 34.74 | 1.2 | 34.74 | 1.2 | 0 | 0 | 0 |
| 3121 | Ag (g/t) | 32.97 | 0.8 | 32.97 | 0.8 | 0 | 0 | 0 |
| 3121 | Au (g/t) | 1.64 | 1.55 | 1.64 | 1.55 | 0 | 0 | 0 |
| 3121 | Pb (%) | 0.36 | 0.96 | 0.36 | 0.96 | 0 | 0 | 0 |
| 3121 | Zn (%) | 0.87 | 0.95 | 0.87 | 0.95 | 0 | 0 | 0 |
| 3121 | Cu (%) | 0.11 | 1.33 | 0.11 | 1.33 | 0 | 0 | -0.01 |
| 3121 | Fe (%) | 25.84 | 1.17 | 25.05 | 1.11 | -0.79 | -0.03 | -0.05 |
| 3191 | Ag (g/t) | 74.14 | 1.43 | 74.14 | 1.43 | 0 | 0 | 0 |
| 3191 | Au (g/t) | 3.79 | 1.49 | 3.79 | 1.49 | 0 | 0 | 0 |
| 3191 | Pb (%) | 0.54 | 1.38 | 0.54 | 1.38 | 0 | 0 | 0 |
| 3191 | Zn (%) | 1.97 | 1.65 | 1.97 | 1.65 | 0 | 0 | 0 |
| 3191 | Cu (%) | 0.15 | 1.93 | 0.15 | 1.93 | 0 | 0 | -0.01 |
| 3191 | Fe (%) | 35.56 | 1.1 | 35.56 | 1.1 | 0 | 0 | 0 |
| 3192 | Ag (g/t) | 65.74 | 1.15 | 65.74 | 1.15 | 0 | 0 | 0 |
| 3192 | Au (g/t) | 2.24 | 0.95 | 2.24 | 0.95 | 0 | 0 | 0 |
| 3192 | Pb (%) | 0.59 | 1.55 | 0.59 | 1.55 | 0 | 0 | 0 |
| 3192 | Zn (%) | 1.57 | 0.96 | 1.57 | 0.96 | 0 | 0 | 0 |
| 3192 | Cu (%) | 0.11 | 1.34 | 0.11 | 1.34 | 0 | 0 | 0 |
| 3192 | Fe (%) | 31.29 | 0.63 | 31.29 | 0.63 | 0 | 0 | 0 |
| 3193 | Ag (g/t) | 35.42 | 1.39 | 35.42 | 1.39 | 0 | 0 | 0 |
| 3193 | Au (g/t) | 2.38 | 2.27 | 2.38 | 2.27 | 0 | 0 | 0 |
| 3193 | Pb (%) | 0.34 | 0.81 | 0.34 | 0.81 | 0 | 0 | 0 |
| 3193 | Zn (%) | 1 | 1.02 | 1 | 1.02 | 0 | 0 | 0 |
| 3193 | Cu (%) | 0.05 | 1.19 | 0.05 | 1.18 | 0 | 0.01 | -0.01 |
| 3193 | Fe (%) | 24.02 | 1.08 | 24.02 | 1.08 | 0 | 0 | 0 |
| 3204 | Ag (g/t) | 41.23 | 0.82 | 41.23 | 0.82 | 0 | 0 | 0 |
| 3204 | Au (g/t) | 1.18 | 1.06 | 1.18 | 1.06 | 0 | 0 | 0 |
| 3204 | Pb (%) | 0.36 | 1.36 | 0.36 | 1.36 | 0 | 0 | 0 |
| 3204 | Zn (%) | 1.01 | 1.56 | 1.01 | 1.56 | 0 | 0 | 0 |
| 3204 | Cu (%) | 0.07 | 1.79 | 0.07 | 1.78 | 0 | 0.01 | -0.01 |
| 3204 | Fe (%) | 18.04 | 0.82 | 18.04 | 0.82 | 0 | 0 | 0 |
| 3205 | Ag (g/t) | 34.21 | 2.66 | 34.21 | 2.66 | 0 | 0 | 0 |
| 3205 | Au (g/t) | 0.23 | 1.2 | 0.23 | 1.2 | 0 | 0 | 0 |
| 3205 | Pb (%) | 0.31 | 1.04 | 0.31 | 1.04 | 0 | 0 | 0 |
| 3205 | Zn (%) | 0.98 | 0.83 | 0.98 | 0.83 | 0 | 0 | 0 |
| 3205 | Cu (%) | 0.03 | 0.83 | 0.03 | 0.83 | 0 | 0.01 | 0 |
| 3205 | Fe (%) | 13.45 | 0.82 | 13.45 | 0.82 | 0 | 0 | 0 |
| 3206 | Ag (g/t) | 32.28 | 1.01 | 32.28 | 1.01 | 0 | 0 | 0 |
| 3206 | Au (g/t) | 1.03 | 1.12 | 1.03 | 1.12 | 0 | 0 | 0 |
| 3206 | Pb (%) | 0.49 | 1.34 | 0.49 | 1.34 | 0 | 0 | 0 |
| 3206 | Zn (%) | 1.73 | 1.5 | 1.73 | 1.5 | 0 | 0 | 0 |
AYA GOLD & SILVER INC., BOUMADINE POLYMETALLIC PROJECT 442
| | | | | | | | | | | | | | | | | | | | | | | | | | |
| 3206 | Cu (%) | 0.07 | 0.99 | 0.07 | 1 | 0 | 0.01 | 0.01 |
| 3206 | Fe (%) | 23.73 | 0.74 | 23.73 | 0.74 | 0 | 0 | 0 |
| 3207 | Ag (g/t) | 10.94 | 0.44 | 10.94 | 0.44 | 0 | 0 | 0 |
| 3207 | Au (g/t) | 0.59 | 1 | 0.59 | 1 | 0 | 0 | 0 |
| 3207 | Pb (%) | 0.22 | 1.31 | 0.22 | 1.31 | 0 | 0 | 0 |
| 3207 | Zn (%) | 0.45 | 1.05 | 0.45 | 1.05 | 0 | 0 | 0 |
| 3207 | Cu (%) | 0.05 | 0.88 | 0.05 | 0.88 | 0 | 0 | 0 |
| 3207 | Fe (%) | 15.13 | 0.53 | 15.13 | 0.53 | 0 | 0 | 0 |
| 3222 | Ag (g/t) | 20.1 | 1.2 | 20.1 | 1.2 | 0 | 0 | 0 |
| 3222 | Au (g/t) | 0.62 | 2.99 | 0.54 | 2.8 | -0.08 | -0.13 | -0.19 |
| 3222 | Pb (%) | 0.57 | 1.53 | 0.57 | 1.53 | 0 | 0 | 0 |
| 3222 | Zn (%) | 1.16 | 1.12 | 1.16 | 1.12 | 0 | 0 | 0 |
| 3222 | Cu (%) | 0.07 | 1.8 | 0.07 | 1.8 | 0 | 0 | 0 |
| 3222 | Fe (%) | 11.72 | 1.13 | 11.72 | 1.13 | 0 | 0 | 0 |
| 3223 | Ag (g/t) | 31.2 | 1.36 | 31.2 | 1.36 | 0 | 0 | 0 |
| 3223 | Au (g/t) | 1.03 | 1.74 | 1.03 | 1.74 | 0 | 0 | 0 |
| 3223 | Pb (%) | 1.33 | 1.56 | 1.33 | 1.56 | 0 | 0 | 0 |
| 3223 | Zn (%) | 2.4 | 1.57 | 2.38 | 1.56 | -0.01 | -0.01 | 0 |
| 3223 | Cu (%) | 0.07 | 2.04 | 0.07 | 2.02 | 0 | 0.01 | -0.02 |
| 3223 | Fe (%) | 18 | 1.1 | 18 | 1.1 | 0 | 0 | 0 |
| 3224 | Ag (g/t) | 20.79 | 1.25 | 17.74 | 0.92 | -3.05 | -0.15 | -0.33 |
| 3224 | Au (g/t) | 0.37 | 1.68 | 0.37 | 1.68 | 0 | 0 | 0 |
| 3224 | Pb (%) | 0.43 | 1.02 | 0.43 | 1.02 | 0 | 0 | 0 |
| 3224 | Zn (%) | 1.08 | 0.77 | 1.08 | 0.77 | 0 | 0 | 0 |
| 3224 | Cu (%) | 0.1 | 2.39 | 0.1 | 2.39 | 0 | 0 | 0 |
| 3224 | Fe (%) | 11.04 | 0.38 | 11.04 | 0.38 | 0 | 0 | 0 |
| 3225 | Ag (g/t) | 51.64 | 0.61 | 51.64 | 0.61 | 0 | 0 | 0 |
| 3225 | Au (g/t) | 2.2 | 0.84 | 2.2 | 0.84 | 0 | 0 | 0 |
| 3225 | Pb (%) | 3.52 | 0.85 | 3.52 | 0.85 | 0 | 0 | 0 |
| 3225 | Zn (%) | 2.44 | 0.54 | 2.44 | 0.54 | 0 | 0 | 0 |
| 3225 | Cu (%) | 0.29 | 0.6 | 0.29 | 0.6 | 0 | 0 | 0 |
| 3225 | Fe (%) | 30.78 | 0.56 | 30.78 | 0.56 | 0 | 0 | 0 |
| 3226 | Ag (g/t) | 29.25 | 1.6 | 29.25 | 1.6 | 0 | 0 | 0 |
| 3226 | Au (g/t) | 0.69 | 1.9 | 0.62 | 1.75 | -0.07 | -0.1 | -0.15 |
| 3226 | Pb (%) | 0.96 | 1.09 | 0.96 | 1.09 | 0 | 0 | 0 |
| 3226 | Zn (%) | 1.87 | 1.56 | 1.82 | 1.58 | -0.05 | -0.03 | 0.01 |
| 3226 | Cu (%) | 0.11 | 1.5 | 0.11 | 1.5 | 0 | 0 | 0 |
| 3226 | Fe (%) | 16.46 | 1.48 | 16.46 | 1.48 | 0 | 0 | 0 |
| 3227 | Ag (g/t) | 59.16 | 0.87 | 59.16 | 0.87 | 0 | 0 | 0 |
| 3227 | Au (g/t) | 1.74 | 0.96 | 1.74 | 0.96 | 0 | 0 | 0 |
| 3227 | Pb (%) | 0.62 | 1.35 | 0.62 | 1.35 | 0 | 0 | 0 |
| 3227 | Zn (%) | 1.72 | 1.05 | 1.72 | 1.05 | 0 | 0 | 0 |
| 3227 | Cu (%) | 0.09 | 0.98 | 0.09 | 0.97 | 0 | 0.01 | -0.01 |
| 3227 | Fe (%) | 21.58 | 0.54 | 21.58 | 0.54 | 0 | 0 | 0 |
| 3230 | Ag (g/t) | 114.03 | 1.07 | 63.05 | 0.8 | -50.98 | -0.45 | -0.28 |
| 3230 | Au (g/t) | 0.79 | 0.73 | 0.79 | 0.73 | 0 | 0 | 0 |
| 3230 | Pb (%) | 1.33 | 0.24 | 1.33 | 0.24 | 0 | 0 | 0 |
| 3230 | Zn (%) | 1.84 | 0.39 | 1.84 | 0.39 | 0 | 0 | 0 |
| 3230 | Cu (%) | 0.05 | 0.15 | 0.05 | 0.13 | 0 | 0.03 | -0.03 |
| 3230 | Fe (%) | 17.46 | 0.18 | 17.46 | 0.18 | 0 | 0 | 0 |
| 3291 | Ag (g/t) | 104.12 | 1.22 | 103.52 | 1.21 | -0.6 | -0.01 | -0.01 |
AYA GOLD & SILVER INC., BOUMADINE POLYMETALLIC PROJECT 443
| | | | | | | | | | | | | | | | | | | | | | | | | | |
| 3291 | Au (g/t) | 2.49 | 1.63 | 2.28 | 1.23 | -0.21 | -0.09 | -0.39 |
| 3291 | Pb (%) | 1.55 | 1.61 | 1.47 | 1.46 | -0.08 | -0.05 | -0.15 |
| 3291 | Zn (%) | 2.9 | 1.55 | 2.68 | 1.29 | -0.22 | -0.07 | -0.26 |
| 3291 | Cu (%) | 0.13 | 1.48 | 0.13 | 1.24 | -0.01 | -0.05 | -0.25 |
| 3291 | Fe (%) | 43.74 | 0.86 | 42.7 | 0.81 | -1.04 | -0.02 | -0.04 |
| 3292 | Ag (g/t) | 56.92 | 0.95 | 56.92 | 0.95 | 0 | 0 | 0 |
| 3292 | Au (g/t) | 1.86 | 1.1 | 1.75 | 0.98 | -0.11 | -0.06 | -0.13 |
| 3292 | Pb (%) | 0.81 | 1.32 | 0.72 | 1.1 | -0.09 | -0.11 | -0.22 |
| 3292 | Zn (%) | 2.02 | 1.04 | 2.02 | 1.04 | 0 | 0 | 0 |
| 3292 | Cu (%) | 0.09 | 1.01 | 0.08 | 0.85 | -0.01 | -0.06 | -0.15 |
| 3292 | Fe (%) | 36.06 | 0.78 | 36.06 | 0.78 | 0 | 0 | 0 |
| 3293 | Ag (g/t) | 31.54 | 1.05 | 31.54 | 1.05 | 0 | 0 | 0 |
| 3293 | Au (g/t) | 0.71 | 1.11 | 0.71 | 1.11 | 0 | 0 | 0 |
| 3293 | Pb (%) | 0.75 | 1.21 | 0.75 | 1.21 | 0 | 0 | 0 |
| 3293 | Zn (%) | 1.46 | 0.95 | 1.46 | 0.95 | 0 | 0 | 0 |
| 3293 | Cu (%) | 0.05 | 1.25 | 0.05 | 1.25 | 0 | 0.01 | -0.01 |
| 3293 | Fe (%) | 21.76 | 0.63 | 21.76 | 0.63 | 0 | 0 | 0 |
| 3294 | Ag (g/t) | 90.46 | 0.94 | 90.46 | 0.94 | 0 | 0 | 0 |
| 3294 | Au (g/t) | 3.81 | 1.21 | 3.81 | 1.21 | 0 | 0 | 0 |
| 3294 | Pb (%) | 0.11 | 0.65 | 0.11 | 0.65 | 0 | 0 | 0 |
| 3294 | Zn (%) | 0.49 | 1.24 | 0.49 | 1.24 | 0 | 0 | 0 |
| 3294 | Cu (%) | 0.13 | 0.5 | 0.13 | 0.5 | 0 | 0 | 0 |
| 3294 | Fe (%) | 80.77 | 0.88 | 48.25 | 0.62 | -32.51 | -0.4 | -0.26 |
| 3295 | Ag (g/t) | 38.4 | 1.29 | 38.4 | 1.29 | 0 | 0 | 0 |
| 3295 | Au (g/t) | 0.38 | 1.09 | 0.38 | 1.09 | 0 | 0 | 0 |
| 3295 | Pb (%) | 0.78 | 1.35 | 0.78 | 1.35 | 0 | 0 | 0 |
| 3295 | Zn (%) | 1.47 | 1.19 | 1.47 | 1.19 | 0 | 0 | 0 |
| 3295 | Cu (%) | 0.1 | 1.77 | 0.1 | 1.77 | 0 | 0 | 0 |
| 3295 | Fe (%) | 23.8 | 1.69 | 22.55 | 1.49 | -1.25 | -0.05 | -0.2 |
| 3301 | Ag (g/t) | 234.86 | 4.14 | 130.84 | 2.14 | - 104.02 | -0.44 | -2 |
| 3301 | Au (g/t) | 1.3 | 1.49 | 1.2 | 1.36 | -0.1 | -0.08 | -0.12 |
| 3301 | Pb (%) | 0.95 | 1.35 | 0.92 | 1.28 | -0.03 | -0.03 | -0.07 |
| 3301 | Zn (%) | 1.7 | 1.26 | 1.7 | 1.26 | 0 | 0 | 0 |
| 3301 | Cu (%) | 0.2 | 1.96 | 0.19 | 1.78 | -0.01 | -0.06 | -0.18 |
| 3301 | Fe (%) | 28.04 | 0.96 | 26.62 | 0.84 | -1.42 | -0.05 | -0.12 |
| 3402 | Ag (g/t) | 13.83 | 0.35 | 13.83 | 0.35 | 0 | 0 | 0 |
| 3402 | Au (g/t) | 0.41 | 0.89 | 0.41 | 0.89 | 0 | 0 | 0 |
| 3402 | Pb (%) | 0.24 | 0.98 | 0.24 | 0.98 | 0 | 0 | 0 |
| 3402 | Zn (%) | 0.7 | 0.8 | 0.7 | 0.8 | 0 | 0 | 0 |
| 3402 | Cu (%) | 0.03 | 0.44 | 0.03 | 0.43 | 0 | 0.01 | -0.01 |
| 3402 | Fe (%) | 16.67 | 0.63 | 16.67 | 0.63 | 0 | 0 | 0 |
| 3409 | Ag (g/t) | 22.22 | 0.91 | 22.22 | 0.91 | 0 | 0 | 0 |
| 3409 | Au (g/t) | 1.03 | 0.77 | 1.03 | 0.77 | 0 | 0 | 0 |
| 3409 | Pb (%) | 0.42 | 1.25 | 0.42 | 1.25 | 0 | 0 | 0 |
| 3409 | Zn (%) | 1.4 | 0.99 | 1.4 | 0.99 | 0 | 0 | 0 |
| 3409 | Cu (%) | 0.02 | 1.17 | 0.02 | 1.19 | 0 | 0.01 | 0.02 |
| 3409 | Fe (%) | 11.68 | 0.76 | 11.68 | 0.76 | 0 | 0 | 0 |
| 3410 | Ag (g/t) | 11.81 | 0.98 | 11.81 | 0.98 | 0 | 0 | 0 |
| 3410 | Au (g/t) | 0.64 | 1.49 | 0.64 | 1.49 | 0 | 0 | 0 |
| 3410 | Pb (%) | 0.1 | 0.71 | 0.1 | 0.71 | 0 | 0 | 0 |
| 3410 | Zn (%) | 0.73 | 0.96 | 0.73 | 0.96 | 0 | 0 | 0 |
AYA GOLD & SILVER INC., BOUMADINE POLYMETALLIC PROJECT 444
| | | | | | | | | | | | | | | | | | | | | | | | | | |
| 3410 | Cu (%) | 0.02 | 0.56 | 0.02 | 0.56 | 0 | 0.01 | 0.01 |
| 3410 | Fe (%) | 14.16 | 0.93 | 14.16 | 0.93 | 0 | 0 | 0 |
| 3411 | Ag (g/t) | 28.72 | 0.73 | 28.72 | 0.73 | 0 | 0 | 0 |
| 3411 | Au (g/t) | 1.24 | 0.87 | 1.2 | 0.82 | -0.04 | -0.03 | -0.05 |
| 3411 | Pb (%) | 1 | 0.82 | 1 | 0.82 | 0 | 0 | 0 |
| 3411 | Zn (%) | 2.46 | 0.9 | 2.46 | 0.9 | 0 | 0 | 0 |
| 3411 | Cu (%) | 0.05 | 0.97 | 0.05 | 0.96 | 0 | 0.01 | -0.01 |
| 3411 | Fe (%) | 22.58 | 0.73 | 22.58 | 0.73 | 0 | 0 | 0 |
| 3508 | Ag (g/t) | 22.47 | 0.77 | 22.47 | 0.77 | 0 | 0 | 0 |
| 3508 | Au (g/t) | 0.87 | 0.69 | 0.87 | 0.69 | 0 | 0 | 0 |
| 3508 | Pb (%) | 0.63 | 0.97 | 0.63 | 0.97 | 0 | 0 | 0 |
| 3508 | Zn (%) | 1.68 | 0.84 | 1.63 | 0.8 | -0.05 | -0.03 | -0.04 |
| 3508 | Cu (%) | 0.02 | 0.47 | 0.02 | 0.48 | 0 | 0.02 | 0.01 |
| 3508 | Fe (%) | 16.79 | 0.5 | 16.79 | 0.5 | 0 | 0 | 0 |
| 3600 | Ag (g/t) | 30.37 | 0.72 | 29.73 | 0.72 | -0.64 | -0.02 | 0 |
| 3600 | Au (g/t) | 0.72 | 0.97 | 0.72 | 0.98 | 0 | 0 | 0 |
| 3600 | Pb (%) | 0.88 | 0.95 | 0.88 | 0.95 | 0 | 0 | 0 |
| 3600 | Zn (%) | 2.59 | 0.96 | 2.59 | 0.96 | 0 | 0 | 0 |
| 3600 | Cu (%) | 0.04 | 1.48 | 0.04 | 1.47 | 0 | 0.01 | -0.02 |
| 3600 | Fe (%) | 16.08 | 0.84 | 16.08 | 0.84 | 0 | 0 | 0 |
| 4001 | Ag (g/t) | 924.75 | 1.19 | 722.7 | 1.12 | - 202.05 | -0.22 | -0.06 |
| 4001 | Au (g/t) | 0.07 | 0.59 | 0.07 | 0.59 | 0 | 0 | 0 |
| 4001 | Pb (%) | 0.21 | 0.78 | 0.21 | 0.78 | 0 | 0 | 0 |
| 4001 | Zn (%) | 0.16 | 0.57 | 0.16 | 0.57 | 0 | 0 | 0 |
| 4001 | Cu (%) | 2.92 | 0.22 | 2.92 | 0.22 | 0 | 0 | 0 |
| 4001 | Fe (%) | 6.94 | 0.44 | 6.94 | 0.44 | 0 | 0 | 0 |
| 4002 | Ag (g/t) | 39.79 | 1 | 39.79 | 1 | 0 | 0 | 0 |
| 4002 | Au (g/t) | 0.01 | 0.48 | 0.01 | 0.48 | 0 | 0 | 0 |
| 4002 | Pb (%) | 2.38 | 1.04 | 2.38 | 1.04 | 0 | 0 | 0 |
| 4002 | Zn (%) | 3.96 | 0.7 | 3.96 | 0.7 | 0 | 0 | 0 |
| 4002 | Cu (%) | 0.09 | 0.41 | 0.09 | 0.41 | 0 | 0 | 0 |
| 4002 | Fe (%) | 2.35 | 0.37 | 2.35 | 0.37 | 0 | 0 | 0 |
| 4003 | Ag (g/t) | 94.14 | 0.34 | 94.14 | 0.34 | 0 | 0 | 0 |
| 4003 | Au (g/t) | 0.07 | 0.06 | 0.07 | 0.06 | 0 | 0 | 0 |
| 4003 | Pb (%) | 4.52 | 0.26 | 4.52 | 0.26 | 0 | 0 | 0 |
| 4003 | Zn (%) | 23.75 | 0.83 | 23.75 | 0.83 | 0 | 0 | 0 |
| 4003 | Cu (%) | 0.3 | 0.03 | 0.3 | 0.03 | 0 | 0 | 0 |
| 4003 | Fe (%) | 3.84 | 0.7 | 3.84 | 0.7 | 0 | 0 | 0 |
| | | | | | | | | | | | | | | | | | | | | | | | | | |
| Domain | Element | Uncapped comps mean | Uncapped comps COV | Capped comps mean | Capped comps COV | St difference (mean) | % Difference (mean) | Straight difference (COV) |
| 1003 | Ag (g/t) | 44.31 | 2.25 | 44.31 | 2.25 | 0 | 0 | 0 |
| 1003 | Au (g/t) | 0.56 | 1.25 | 0.56 | 1.25 | 0 | 0 | 0 |
| 1003 | Pb (%) | 0.42 | 1.69 | 0.42 | 1.69 | 0 | 0 | 0 |
| 1003 | Zn (%) | 1.87 | 2.28 | 1.87 | 2.28 | 0 | 0 | 0 |
| 1003 | Cu (%) | 0.09 | 1.5 | 0.09 | 1.49 | 0 | 0 | -0.01 |
| 1003 | Fe (%) | 17.31 | 1.74 | 17.31 | 1.74 | 0 | 0 | 0 |
| 1004 | Ag (g/t) | 65.42 | 0.93 | 65.42 | 0.93 | 0 | 0 | 0 |
| 1004 | Au (g/t) | 0.35 | 0.92 | 0.35 | 0.92 | 0 | 0 | 0 |
| 1004 | Pb (%) | 1.79 | 1.27 | 1.79 | 1.27 | 0 | 0 | 0 |
| 1004 | Zn (%) | 2.57 | 0.71 | 2.57 | 0.71 | 0 | 0 | 0 |
AYA GOLD & SILVER INC., BOUMADINE POLYMETALLIC PROJECT 445
| | | | | | | | | | | | | | | | | | | | | | | | | | |
| 1004 | Cu (%) | 0.06 | 1.4 | 0.06 | 1.4 | 0 | 0 | 0 |
| 1004 | Fe (%) | 14.52 | 0.87 | 13.01 | 0.76 | -1.51 | -0.1 | -0.1 |
| 1005 | Ag (g/t) | 73.82 | 0.92 | 73.82 | 0.92 | 0 | 0 | 0 |
| 1005 | Au (g/t) | 0.47 | 0.53 | 0.47 | 0.53 | 0 | 0 | 0 |
| 1005 | Pb (%) | 0.27 | 0.37 | 0.27 | 0.37 | 0 | 0 | 0 |
| 1005 | Zn (%) | 1.05 | 0.37 | 1.05 | 0.37 | 0 | 0 | 0 |
| 1005 | Cu (%) | 0.03 | 0.9 | 0.03 | 0.9 | 0 | 0 | 0 |
| 1005 | Fe (%) | 10.88 | 0.77 | 10.88 | 0.77 | 0 | 0 | 0 |
| 1006 | Ag (g/t) | 30.75 | 0.65 | 30.75 | 0.65 | 0 | 0 | 0 |
| 1006 | Au (g/t) | 0.38 | 0.8 | 0.38 | 0.8 | 0 | 0 | 0 |
| 1006 | Pb (%) | 0.45 | 0.74 | 0.45 | 0.74 | 0 | 0 | 0 |
| 1006 | Zn (%) | 1.45 | 0.75 | 1.45 | 0.75 | 0 | 0 | 0 |
| 1006 | Cu (%) | 0.02 | 0.71 | 0.02 | 0.71 | 0 | 0 | 0 |
| 1006 | Fe (%) | 11.99 | 0.97 | 11.99 | 0.97 | 0 | 0 | 0 |
| 1007 | Ag (g/t) | 200.32 | 1.61 | 177.74 | 1.57 | -22.58 | -0.11 | -0.05 |
| 1007 | Au (g/t) | 0.64 | 0.58 | 0.64 | 0.58 | 0 | 0 | 0 |
| 1007 | Pb (%) | 0.53 | 0.94 | 0.53 | 0.94 | 0 | 0 | 0 |
| 1007 | Zn (%) | 2.51 | 1.37 | 2.51 | 1.37 | 0 | 0 | 0 |
| 1007 | Cu (%) | 0.23 | 1.41 | 0.23 | 1.41 | 0 | 0 | 0 |
| 1007 | Fe (%) | 14.65 | 0.63 | 13.61 | 0.55 | -1.04 | -0.07 | -0.08 |
| 1011 | Ag (g/t) | 57.16 | 0.72 | 57.16 | 0.72 | 0 | 0 | 0 |
| 1011 | Au (g/t) | 1.59 | 0.95 | 1.59 | 0.95 | 0 | 0 | 0 |
| 1011 | Pb (%) | 0.47 | 0.69 | 0.47 | 0.69 | 0 | 0 | 0 |
| 1011 | Zn (%) | 0.92 | 0.73 | 0.92 | 0.73 | 0 | 0 | 0 |
| 1011 | Cu (%) | 0.03 | 0.89 | 0.03 | 0.89 | 0 | 0 | 0 |
| 1011 | Fe (%) | 35.59 | 0.87 | 35.59 | 0.87 | 0 | 0 | 0 |
| 1012 | Ag (g/t) | 129.23 | 0.38 | 129.23 | 0.38 | 0 | 0 | 0 |
| 1012 | Au (g/t) | 1 | 0.86 | 1 | 0.86 | 0 | 0 | 0 |
| 1012 | Pb (%) | 1.24 | 0.86 | 1.24 | 0.86 | 0 | 0 | 0 |
| 1012 | Zn (%) | 2.26 | 0.93 | 2.26 | 0.93 | 0 | 0 | 0 |
| 1012 | Cu (%) | 0.31 | 0.63 | 0.31 | 0.63 | 0 | 0 | 0 |
| 1012 | Fe (%) | 22.78 | 0.46 | 22.78 | 0.46 | 0 | 0 | 0 |
| 1013 | Ag (g/t) | 29.75 | 0.7 | 29.75 | 0.7 | 0 | 0 | 0 |
| 1013 | Au (g/t) | 0.12 | 0.91 | 0.12 | 0.91 | 0 | 0 | 0 |
| 1013 | Pb (%) | 0.49 | 1.34 | 0.49 | 1.34 | 0 | 0 | 0 |
| 1013 | Zn (%) | 1.07 | 1.39 | 1.07 | 1.39 | 0 | 0 | 0 |
| 1013 | Cu (%) | 0.03 | 0.38 | 0.03 | 0.38 | 0 | 0 | 0 |
| 1013 | Fe (%) | 17.39 | 0.76 | 17.39 | 0.76 | 0 | 0 | 0 |
| 1030 | Ag (g/t) | 130.13 | 1.25 | 130.13 | 1.25 | 0 | 0 | 0 |
| 1030 | Au (g/t) | 2.29 | 1.92 | 2.29 | 1.92 | 0 | 0 | 0 |
| 1030 | Pb (%) | 1.64 | 1.2 | 1.64 | 1.2 | 0 | 0 | 0 |
| 1030 | Zn (%) | 7.65 | 1.37 | 7.65 | 1.37 | 0 | 0 | 0 |
| 1030 | Cu (%) | 0.21 | 1.85 | 0.21 | 1.85 | 0 | 0 | 0 |
| 1030 | Fe (%) | 21.76 | 1.09 | 21.76 | 1.09 | 0 | 0 | 0 |
| 1031 | Ag (g/t) | 99.97 | 1.34 | 96.85 | 1.32 | -3.13 | -0.03 | -0.02 |
| 1031 | Au (g/t) | 1.31 | 3.26 | 1.31 | 3.26 | 0 | 0 | 0 |
| 1031 | Pb (%) | 0.88 | 1.36 | 0.88 | 1.36 | 0 | 0 | 0 |
| 1031 | Zn (%) | 2.43 | 2.11 | 2.43 | 2.11 | 0 | 0 | 0 |
| 1031 | Cu (%) | 0.06 | 2.25 | 0.06 | 2.25 | 0 | 0.01 | 0 |
| 1031 | Fe (%) | 19.63 | 1.85 | 19.63 | 1.85 | 0 | 0 | 0 |
| 1033 | Ag (g/t) | 20.62 | 0.83 | 20.62 | 0.83 | 0 | 0 | 0 |
AYA GOLD & SILVER INC., BOUMADINE POLYMETALLIC PROJECT 446
| | | | | | | | | | | | | | | | | | | | | | | | | | |
| 1033 | Au (g/t) | 0.99 | 0.96 | 0.99 | 0.96 | 0 | 0 | 0 |
| 1033 | Pb (%) | 0.24 | 0.71 | 0.24 | 0.71 | 0 | 0 | 0 |
| 1033 | Zn (%) | 0.36 | 1.06 | 0.36 | 1.06 | 0 | 0 | 0 |
| 1033 | Cu (%) | 0.03 | 1.57 | 0.03 | 1.54 | 0 | 0.02 | -0.03 |
| 1033 | Fe (%) | 12.42 | 0.7 | 12.42 | 0.7 | 0 | 0 | 0 |
| 1040 | Ag (g/t) | 85.8 | 1.05 | 85.8 | 1.05 | 0 | 0 | 0 |
| 1040 | Au (g/t) | 2.58 | 1.34 | 2.45 | 1.34 | -0.12 | -0.05 | 0 |
| 1040 | Pb (%) | 2.14 | 1.83 | 2.14 | 1.83 | 0 | 0 | 0 |
| 1040 | Zn (%) | 3.84 | 2.07 | 3.84 | 2.07 | 0 | 0 | 0 |
| 1040 | Cu (%) | 0.06 | 1.07 | 0.06 | 1.06 | 0 | 0.01 | 0 |
| 1040 | Fe (%) | 24.28 | 0.81 | 24.28 | 0.81 | 0 | 0 | 0 |
| 1041 | Ag (g/t) | 148.18 | 1.49 | 148.18 | 1.49 | 0 | 0 | 0 |
| 1041 | Au (g/t) | 1.74 | 2.08 | 1.67 | 2.12 | -0.08 | -0.04 | 0.05 |
| 1041 | Pb (%) | 2.16 | 1.49 | 2.16 | 1.49 | 0 | 0 | 0 |
| 1041 | Zn (%) | 3.57 | 1.43 | 3.49 | 1.43 | -0.08 | -0.02 | 0 |
| 1041 | Cu (%) | 0.04 | 1.26 | 0.04 | 1.26 | 0 | 0 | 0 |
| 1041 | Fe (%) | 19.96 | 0.96 | 19.96 | 0.96 | 0 | 0 | 0 |
| 1050 | Ag (g/t) | 46.76 | 1.27 | 46.76 | 1.27 | 0 | 0 | 0 |
| 1050 | Au (g/t) | 2.65 | 1.5 | 2.65 | 1.5 | 0 | 0 | 0 |
| 1050 | Pb (%) | 0.93 | 2.06 | 0.93 | 2.06 | 0 | 0 | 0 |
| 1050 | Zn (%) | 2.91 | 2.03 | 2.75 | 1.97 | -0.17 | -0.06 | -0.06 |
| 1050 | Cu (%) | 0.35 | 1.48 | 0.35 | 1.48 | 0 | 0 | 0 |
| 1050 | Fe (%) | 22.58 | 1.29 | 22.58 | 1.29 | 0 | 0 | 0 |
| 1051 | Ag (g/t) | 27.98 | 0.81 | 27.98 | 0.81 | 0 | 0 | 0 |
| 1051 | Au (g/t) | 0.3 | 0.46 | 0.3 | 0.46 | 0 | 0 | 0 |
| 1051 | Pb (%) | 0.11 | 0.63 | 0.11 | 0.63 | 0 | 0 | 0 |
| 1051 | Zn (%) | 0.04 | 0.91 | 0.04 | 0.91 | 0 | 0 | 0 |
| 1051 | Cu (%) | 0.01 | 0.84 | 0.01 | 0.73 | 0 | 0.06 | -0.11 |
| 1051 | Fe (%) | 3.67 | 0.1 | 3.67 | 0.1 | 0 | 0 | 0 |
| 1052 | Ag (g/t) | 48.42 | 1.37 | 48.42 | 1.37 | 0 | 0 | 0 |
| 1052 | Au (g/t) | 0.78 | 1.32 | 0.78 | 1.32 | 0 | 0 | 0 |
| 1052 | Pb (%) | 0.82 | 1.23 | 0.82 | 1.23 | 0 | 0 | 0 |
| 1052 | Zn (%) | 0.87 | 1.27 | 0.87 | 1.27 | 0 | 0 | 0 |
| 1052 | Cu (%) | 0.19 | 2.84 | 0.11 | 1.39 | -0.08 | -0.41 | -1.45 |
| 1052 | Fe (%) | 17.67 | 0.98 | 17.67 | 0.98 | 0 | 0 | 0 |
| 1053 | Ag (g/t) | 39.73 | 0.57 | 39.73 | 0.57 | 0 | 0 | 0 |
| 1053 | Au (g/t) | 0.84 | 0.3 | 0.84 | 0.3 | 0 | 0 | 0 |
| 1053 | Pb (%) | 0.68 | 1.04 | 0.68 | 1.04 | 0 | 0 | 0 |
| 1053 | Zn (%) | 1.92 | 1.3 | 1.92 | 1.3 | 0 | 0 | 0 |
| 1053 | Cu (%) | 0.07 | 0.51 | 0.07 | 0.51 | 0 | 0 | 0 |
| 1053 | Fe (%) | 13.65 | 0.3 | 13.65 | 0.3 | 0 | 0 | 0 |
| 1054 | Ag (g/t) | 22.97 | 1.34 | 22.97 | 1.34 | 0 | 0 | 0 |
| 1054 | Au (g/t) | 0.05 | 1.19 | 0.05 | 1.19 | 0 | 0 | 0 |
| 1054 | Pb (%) | 0.97 | 1.7 | 0.97 | 1.7 | 0 | 0 | 0 |
| 1054 | Zn (%) | 1.98 | 2.14 | 1.98 | 2.14 | 0 | 0 | 0 |
| 1054 | Cu (%) | 0.25 | 0.86 | 0.25 | 0.86 | 0 | 0 | 0 |
| 1054 | Fe (%) | 9.14 | 1.48 | 9.14 | 1.48 | 0 | 0 | 0 |
| 1055 | Ag (g/t) | 296.3 | 0.68 | 296.3 | 0.68 | 0 | 0 | 0 |
| 1055 | Au (g/t) | 0.72 | 0.7 | 0.72 | 0.7 | 0 | 0 | 0 |
| 1055 | Pb (%) | 4.74 | 0.7 | 4.74 | 0.7 | 0 | 0 | 0 |
| 1055 | Zn (%) | 4.53 | 0.85 | 4.53 | 0.85 | 0 | 0 | 0 |
AYA GOLD & SILVER INC., BOUMADINE POLYMETALLIC PROJECT 447
| | | | | | | | | | | | | | | | | | | | | | | | | | |
| 1055 | Cu (%) | 0.07 | 0.92 | 0.07 | 0.92 | 0 | 0 | 0 |
| 1055 | Fe (%) | 20.67 | 0.71 | 20.67 | 0.71 | 0 | 0 | 0 |
| 1056 | Ag (g/t) | 49.3 | 0.64 | 49.3 | 0.64 | 0 | 0 | 0 |
| 1056 | Au (g/t) | 0.71 | 0.98 | 0.71 | 0.98 | 0 | 0 | 0 |
| 1056 | Pb (%) | 0.69 | 1.57 | 0.69 | 1.57 | 0 | 0 | 0 |
| 1056 | Zn (%) | 0.65 | 1.12 | 0.65 | 1.12 | 0 | 0 | 0 |
| 1056 | Cu (%) | 0.46 | 0.61 | 0.46 | 0.61 | 0 | 0 | 0 |
| 1056 | Fe (%) | 40.23 | 0.91 | 37.39 | 0.81 | -2.84 | -0.07 | -0.1 |
| 1061 | Ag (g/t) | 122.19 | 0.6 | 122.19 | 0.6 | 0 | 0 | 0 |
| 1061 | Au (g/t) | 0.62 | 0.78 | 0.62 | 0.78 | 0 | 0 | 0 |
| 1061 | Pb (%) | 2.82 | 0.59 | 2.82 | 0.59 | 0 | 0 | 0 |
| 1061 | Zn (%) | 6.75 | 0.85 | 6.75 | 0.85 | 0 | 0 | 0 |
| 1061 | Cu (%) | 0.03 | 0.11 | 0.03 | 0.03 | 0 | 0.14 | -0.08 |
| 1061 | Fe (%) | 28.03 | 0.52 | 28.03 | 0.52 | 0 | 0 | 0 |
| 1062 | Ag (g/t) | 22.45 | 1.35 | 22.45 | 1.35 | 0 | 0 | 0 |
| 1062 | Au (g/t) | 0.06 | 0.85 | 0.06 | 0.85 | 0 | 0 | 0 |
| 1062 | Pb (%) | 5.21 | 1.41 | 5.21 | 1.41 | 0 | 0 | 0 |
| 1062 | Zn (%) | 10.88 | 1.41 | 9.91 | 1.41 | -0.97 | -0.09 | 0 |
| 1062 | Cu (%) | 0.22 | 0.66 | 0.22 | 0.66 | 0 | 0.01 | 0 |
| 1062 | Fe (%) | 17.55 | 0.74 | 17.55 | 0.74 | 0 | 0 | 0 |
| 1063 | Ag (g/t) | 3.08 | 0.77 | 3.08 | 0.77 | 0 | 0 | 0 |
| 1063 | Au (g/t) | 7.94 | 0.48 | 7.94 | 0.48 | 0 | 0 | 0 |
| 1063 | Pb (%) | 0.02 | 0.64 | 0.02 | 0.64 | 0 | 0 | 0 |
| 1063 | Zn (%) | 0.03 | 0.86 | 0.03 | 0.86 | 0 | 0 | 0 |
| 1063 | Cu (%) | 0.02 | 0.54 | 0.02 | 0.54 | 0 | 0 | 0 |
| 1063 | Fe (%) | 34.44 | 0.83 | 34.44 | 0.83 | 0 | 0 | 0 |
| 1090 | Ag (g/t) | 258.26 | 1.94 | 258.26 | 1.94 | 0 | 0 | 0 |
| 1090 | Au (g/t) | 3.77 | 1.31 | 3.77 | 1.31 | 0 | 0 | 0 |
| 1090 | Pb (%) | 2.87 | 2.39 | 2.87 | 2.39 | 0 | 0 | 0 |
| 1090 | Zn (%) | 9.41 | 1.89 | 9.35 | 1.88 | -0.06 | -0.01 | -0.01 |
| 1090 | Cu (%) | 0.24 | 1.93 | 0.24 | 1.93 | 0 | 0 | -0.01 |
| 1090 | Fe (%) | 44.69 | 0.99 | 43.29 | 0.89 | -1.4 | -0.03 | -0.1 |
| 1091 | Ag (g/t) | 432.92 | 1.61 | 394.35 | 1.27 | -38.57 | -0.09 | -0.34 |
| 1091 | Au (g/t) | 1.68 | 1.17 | 1.65 | 1.11 | -0.04 | -0.02 | -0.06 |
| 1091 | Pb (%) | 3.07 | 1.27 | 2.74 | 1.04 | -0.33 | -0.11 | -0.23 |
| 1091 | Zn (%) | 4.68 | 1.04 | 4.43 | 0.92 | -0.25 | -0.05 | -0.12 |
| 1091 | Cu (%) | 0.14 | 2.22 | 0.14 | 2.13 | 0 | -0.03 | -0.09 |
| 1091 | Fe (%) | 32.27 | 0.77 | 32.27 | 0.77 | 0 | 0 | 0 |
| 1092 | Ag (g/t) | 91.96 | 1.89 | 91.96 | 1.89 | 0 | 0 | 0 |
| 1092 | Au (g/t) | 4.19 | 1.9 | 4.19 | 1.9 | 0 | 0 | 0 |
| 1092 | Pb (%) | 1.25 | 1.14 | 1.25 | 1.14 | 0 | 0 | 0 |
| 1092 | Zn (%) | 3.2 | 1.75 | 3.2 | 1.75 | 0 | 0 | 0 |
| 1092 | Cu (%) | 0.27 | 1.67 | 0.27 | 1.66 | 0 | 0 | 0 |
| 1092 | Fe (%) | 43.15 | 1.27 | 43.15 | 1.27 | 0 | 0 | 0 |
| 1093 | Ag (g/t) | 329.44 | 2.49 | 329.44 | 2.49 | 0 | 0 | 0 |
| 1093 | Au (g/t) | 2.51 | 1.53 | 2.51 | 1.53 | 0 | 0 | 0 |
| 1093 | Pb (%) | 1.04 | 1.3 | 1.04 | 1.3 | 0 | 0 | 0 |
| 1093 | Zn (%) | 3.26 | 1.66 | 3.26 | 1.66 | 0 | 0 | 0 |
| 1093 | Cu (%) | 0.22 | 1.55 | 0.22 | 1.55 | 0 | 0 | 0 |
| 1093 | Fe (%) | 29.68 | 0.95 | 29.68 | 0.95 | 0 | 0 | 0 |
| 1094 | Ag (g/t) | 105.6 | 1.04 | 105.6 | 1.04 | 0 | 0 | 0 |
AYA GOLD & SILVER INC., BOUMADINE POLYMETALLIC PROJECT 448
| | | | | | | | | | | | | | | | | | | | | | | | | | |
| 1094 | Au (g/t) | 6.21 | 1.2 | 6.21 | 1.2 | 0 | 0 | 0 |
| 1094 | Pb (%) | 1.19 | 0.77 | 1.19 | 0.77 | 0 | 0 | 0 |
| 1094 | Zn (%) | 1.51 | 1.11 | 1.51 | 1.11 | 0 | 0 | 0 |
| 1094 | Cu (%) | 0.2 | 1.24 | 0.2 | 1.23 | 0 | 0 | 0 |
| 1094 | Fe (%) | 49.41 | 0.71 | 49.41 | 0.71 | 0 | 0 | 0 |
| 1201 | Ag (g/t) | 1095.83 | 1.65 | 1058.78 | 1.64 | -37.05 | -0.03 | -0.01 |
| 1201 | Au (g/t) | 5.78 | 1.17 | 5.78 | 1.17 | 0 | 0 | 0 |
| 1201 | Pb (%) | 10.26 | 1.72 | 10.21 | 1.73 | -0.05 | -0.01 | 0.01 |
| 1201 | Zn (%) | 12.92 | 1.01 | 12.87 | 1.01 | -0.05 | 0 | 0 |
| 1201 | Cu (%) | 0.22 | 0.93 | 0.22 | 0.93 | 0 | 0 | 0 |
| 1201 | Fe (%) | 78.75 | 0.88 | 78.75 | 0.88 | 0 | 0 | 0 |
| 1202 | Ag (g/t) | 110.65 | 2.3 | 110.65 | 2.3 | 0 | 0 | 0 |
| 1202 | Au (g/t) | 1.96 | 2.99 | 1.63 | 2.84 | -0.33 | -0.17 | -0.15 |
| 1202 | Pb (%) | 1.17 | 2.25 | 1.17 | 2.25 | 0 | 0 | 0 |
| 1202 | Zn (%) | 2.74 | 1.89 | 2.74 | 1.89 | 0 | 0 | 0 |
| 1202 | Cu (%) | 0.1 | 2.71 | 0.1 | 2.7 | 0 | 0 | -0.01 |
| 1202 | Fe (%) | 19.41 | 1.52 | 14.19 | 1.09 | -5.21 | -0.27 | -0.43 |
| 1203 | Ag (g/t) | 71.92 | 2.04 | 71.92 | 2.04 | 0 | 0 | 0 |
| 1203 | Au (g/t) | 1.48 | 2.78 | 1.48 | 2.78 | 0 | 0 | 0 |
| 1203 | Pb (%) | 1.4 | 1.96 | 1.4 | 1.96 | 0 | 0 | 0 |
| 1203 | Zn (%) | 3.14 | 1.93 | 3.14 | 1.93 | 0 | 0 | 0 |
| 1203 | Cu (%) | 0.05 | 1.59 | 0.05 | 1.58 | 0 | 0 | 0 |
| 1203 | Fe (%) | 18.33 | 1.61 | 18.33 | 1.61 | 0 | 0 | 0 |
| 1208 | Ag (g/t) | 21.12 | 0.65 | 21.12 | 0.65 | 0 | 0 | 0 |
| 1208 | Au (g/t) | 0.58 | 0.32 | 0.58 | 0.32 | 0 | 0 | 0 |
| 1208 | Pb (%) | 0.16 | 0.71 | 0.16 | 0.71 | 0 | 0 | 0 |
| 1208 | Zn (%) | 0.16 | 0.97 | 0.16 | 0.97 | 0 | 0 | 0 |
| 1208 | Cu (%) | 0.04 | 0.89 | 0.04 | 0.87 | 0 | 0.01 | -0.02 |
| 1208 | Fe (%) | 13.18 | 0.58 | 13.18 | 0.58 | 0 | 0 | 0 |
| 1209 | Ag (g/t) | 20.16 | 0.83 | 20.16 | 0.83 | 0 | 0 | 0 |
| 1209 | Au (g/t) | 0.57 | 1.74 | 0.57 | 1.74 | 0 | 0 | 0 |
| 1209 | Pb (%) | 0.36 | 0.7 | 0.36 | 0.7 | 0 | 0 | 0 |
| 1209 | Zn (%) | 1.34 | 0.82 | 1.34 | 0.82 | 0 | 0 | 0 |
| 1209 | Cu (%) | 0.18 | 1.75 | 0.18 | 1.75 | 0 | 0 | 0 |
| 1209 | Fe (%) | 7.77 | 0.58 | 7.77 | 0.58 | 0 | 0 | 0 |
| 1304 | Ag (g/t) | 29.04 | 0.4 | 29.04 | 0.4 | 0 | 0 | 0 |
| 1304 | Au (g/t) | 1.12 | 0.79 | 1.12 | 0.79 | 0 | 0 | 0 |
| 1304 | Pb (%) | 1.41 | 0.99 | 1.41 | 0.99 | 0 | 0 | 0 |
| 1304 | Zn (%) | 1.28 | 0.84 | 1.28 | 0.84 | 0 | 0 | 0 |
| 1304 | Cu (%) | 0.07 | 0.4 | 0.07 | 0.37 | 0 | 0.02 | -0.02 |
| 1304 | Fe (%) | 24.37 | 0.63 | 24.37 | 0.63 | 0 | 0 | 0 |
| 1305 | Ag (g/t) | 54.67 | 1.31 | 54.67 | 1.31 | 0 | 0 | 0 |
| 1305 | Au (g/t) | 2.3 | 1.54 | 2.3 | 1.54 | 0 | 0 | 0 |
| 1305 | Pb (%) | 0.58 | 1.46 | 0.58 | 1.46 | 0 | 0 | 0 |
| 1305 | Zn (%) | 1.03 | 1.38 | 1.03 | 1.38 | 0 | 0 | 0 |
| 1305 | Cu (%) | 0.16 | 1.05 | 0.16 | 1.05 | 0 | 0 | 0 |
| 1305 | Fe (%) | 31.91 | 0.82 | 31.06 | 0.75 | -0.85 | -0.03 | -0.07 |
| 1306 | Ag (g/t) | 144.14 | 1.15 | 144.14 | 1.15 | 0 | 0 | 0 |
| 1306 | Au (g/t) | 2.74 | 1.74 | 2.74 | 1.74 | 0 | 0 | 0 |
| 1306 | Pb (%) | 1.37 | 1.13 | 1.37 | 1.13 | 0 | 0 | 0 |
| 1306 | Zn (%) | 2.48 | 1.32 | 2.48 | 1.32 | 0 | 0 | 0 |
AYA GOLD & SILVER INC., BOUMADINE POLYMETALLIC PROJECT 449
| | | | | | | | | | | | | | | | | | | | | | | | | | |
| 1306 | Cu (%) | 0.21 | 1.45 | 0.21 | 1.45 | 0 | 0 | 0 |
| 1306 | Fe (%) | 31.39 | 1.19 | 31.39 | 1.19 | 0 | 0 | 0 |
| 1310 | Ag (g/t) | 46.17 | 0.9 | 46.17 | 0.9 | 0 | 0 | 0 |
| 1310 | Au (g/t) | 2.67 | 1.27 | 2.67 | 1.27 | 0 | 0 | 0 |
| 1310 | Pb (%) | 0.99 | 1.3 | 0.99 | 1.3 | 0 | 0 | 0 |
| 1310 | Zn (%) | 2.32 | 1.67 | 2.32 | 1.67 | 0 | 0 | 0 |
| 1310 | Cu (%) | 0.17 | 1.16 | 0.17 | 1.16 | 0 | 0 | 0 |
| 1310 | Fe (%) | 33.37 | 0.95 | 33.37 | 0.95 | 0 | 0 | 0 |
| 1311 | Ag (g/t) | 43.29 | 1.11 | 43.29 | 1.11 | 0 | 0 | 0 |
| 1311 | Au (g/t) | 1.31 | 2.01 | 1.31 | 2.01 | 0 | 0 | 0 |
| 1311 | Pb (%) | 0.12 | 0.62 | 0.12 | 0.62 | 0 | 0 | 0 |
| 1311 | Zn (%) | 0.43 | 0.76 | 0.43 | 0.76 | 0 | 0 | 0 |
| 1311 | Cu (%) | 0.1 | 0.96 | 0.1 | 0.96 | 0 | 0 | 0 |
| 1311 | Fe (%) | 32.96 | 1.12 | 27.39 | 0.91 | -5.57 | -0.17 | -0.21 |
| 1312 | Ag (g/t) | 44.6 | 1.78 | 44.6 | 1.78 | 0 | 0 | 0 |
| 1312 | Au (g/t) | 0.83 | 1.78 | 0.83 | 1.78 | 0 | 0 | 0 |
| 1312 | Pb (%) | 0.58 | 0.96 | 0.58 | 0.96 | 0 | 0 | 0 |
| 1312 | Zn (%) | 3.18 | 2.43 | 3.18 | 2.43 | 0 | 0 | 0 |
| 1312 | Cu (%) | 0.1 | 1.61 | 0.1 | 1.58 | 0 | 0.01 | -0.03 |
| 1312 | Fe (%) | 15.19 | 1.13 | 15.19 | 1.13 | 0 | 0 | 0 |
| 1313 | Ag (g/t) | 38.1 | 1.89 | 38.1 | 1.89 | 0 | 0 | 0 |
| 1313 | Au (g/t) | 0.21 | 1.02 | 0.21 | 1.02 | 0 | 0 | 0 |
| 1313 | Pb (%) | 2.75 | 2.07 | 2.75 | 2.07 | 0 | 0 | 0 |
| 1313 | Zn (%) | 2.44 | 0.86 | 2.44 | 0.86 | 0 | 0 | 0 |
| 1313 | Cu (%) | 0.04 | 0.87 | 0.04 | 0.89 | 0 | 0.04 | 0.01 |
| 1313 | Fe (%) | 10.56 | 0.5 | 10.56 | 0.5 | 0 | 0 | 0 |
| 1314 | Ag (g/t) | 24.01 | 0.88 | 24.01 | 0.88 | 0 | 0 | 0 |
| 1314 | Au (g/t) | 1.25 | 0.92 | 1.25 | 0.92 | 0 | 0 | 0 |
| 1314 | Pb (%) | 0.32 | 1.22 | 0.32 | 1.22 | 0 | 0 | 0 |
| 1314 | Zn (%) | 0.49 | 1.55 | 0.49 | 1.55 | 0 | 0 | 0 |
| 1314 | Cu (%) | 0.12 | 0.91 | 0.12 | 0.9 | 0 | 0 | -0.01 |
| 1314 | Fe (%) | 23.93 | 0.5 | 23.93 | 0.5 | 0 | 0 | 0 |
| 1331 | Ag (g/t) | 39.9 | 0.84 | 39.9 | 0.84 | 0 | 0 | 0 |
| 1331 | Au (g/t) | 1.49 | 1.84 | 1.49 | 1.84 | 0 | 0 | 0 |
| 1331 | Pb (%) | 2.13 | 1.74 | 2.13 | 1.74 | 0 | 0 | 0 |
| 1331 | Zn (%) | 2.18 | 0.93 | 2.18 | 0.93 | 0 | 0 | 0 |
| 1331 | Cu (%) | 0.11 | 1.43 | 0.11 | 1.43 | 0 | 0.01 | -0.01 |
| 1331 | Fe (%) | 21.34 | 0.84 | 21.34 | 0.84 | 0 | 0 | 0 |
| 1341 | Ag (g/t) | 41.69 | 1.47 | 41.69 | 1.47 | 0 | 0 | 0 |
| 1341 | Au (g/t) | 0.75 | 1.52 | 0.75 | 1.52 | 0 | 0 | 0 |
| 1341 | Pb (%) | 2.68 | 2.45 | 2.68 | 2.45 | 0 | 0 | 0 |
| 1341 | Zn (%) | 4.24 | 1.69 | 4.24 | 1.69 | 0 | 0 | 0 |
| 1341 | Cu (%) | 0.12 | 1.8 | 0.12 | 1.79 | 0 | 0.01 | -0.01 |
| 1341 | Fe (%) | 18.34 | 0.81 | 18.34 | 0.81 | 0 | 0 | 0 |
| 1403 | Ag (g/t) | 36.95 | 0.81 | 36.95 | 0.81 | 0 | 0 | 0 |
| 1403 | Au (g/t) | 0.89 | 1.45 | 0.89 | 1.45 | 0 | 0 | 0 |
| 1403 | Pb (%) | 3.68 | 1.42 | 3.68 | 1.42 | 0 | 0 | 0 |
| 1403 | Zn (%) | 3.36 | 0.74 | 3.36 | 0.74 | 0 | 0 | 0 |
| 1403 | Cu (%) | 0.09 | 0.65 | 0.09 | 0.65 | 0 | 0.01 | 0 |
| 1403 | Fe (%) | 32.88 | 0.55 | 32.88 | 0.55 | 0 | 0 | 0 |
| 1404 | Ag (g/t) | 22.84 | 1.17 | 22.84 | 1.17 | 0 | 0 | 0 |
AYA GOLD & SILVER INC., BOUMADINE POLYMETALLIC PROJECT 450
| | | | | | | | | | | | | | | | | | | | | | | | | | |
| 1404 | Au (g/t) | 0.21 | 1.37 | 0.21 | 1.37 | 0 | 0 | 0 |
| 1404 | Pb (%) | 0.39 | 0.83 | 0.39 | 0.83 | 0 | 0 | 0 |
| 1404 | Zn (%) | 1.39 | 1.27 | 1.39 | 1.27 | 0 | 0 | 0 |
| 1404 | Cu (%) | 0.06 | 2.39 | 0.07 | 2.36 | 0 | 0.01 | -0.02 |
| 1404 | Fe (%) | 11.09 | 0.58 | 11.09 | 0.58 | 0 | 0 | 0 |
| 1407 | Ag (g/t) | 45 | 1.25 | 45 | 1.25 | 0 | 0 | 0 |
| 1407 | Au (g/t) | 2.57 | 2.62 | 1.99 | 2.26 | -0.58 | -0.22 | -0.36 |
| 1407 | Pb (%) | 0.98 | 1.3 | 0.98 | 1.3 | 0 | 0 | 0 |
| 1407 | Zn (%) | 1.76 | 1.18 | 1.76 | 1.18 | 0 | 0 | 0 |
| 1407 | Cu (%) | 0.15 | 1.55 | 0.15 | 1.54 | 0 | 0.01 | -0.01 |
| 1407 | Fe (%) | 39.15 | 1.21 | 39.15 | 1.21 | 0 | 0 | 0 |
| 1501 | Ag (g/t) | 207.96 | 1.23 | 207.96 | 1.23 | 0 | 0 | 0 |
| 1501 | Au (g/t) | 2.23 | 1.2 | 2.14 | 1.14 | -0.09 | -0.04 | -0.06 |
| 1501 | Pb (%) | 2.64 | 1.27 | 2.64 | 1.27 | 0 | 0 | 0 |
| 1501 | Zn (%) | 5.15 | 1.32 | 5.15 | 1.32 | 0 | 0 | 0 |
| 1501 | Cu (%) | 0.08 | 1.19 | 0.08 | 1.18 | 0 | 0.01 | -0.01 |
| 1501 | Fe (%) | 37.53 | 0.89 | 37.53 | 0.89 | 0 | 0 | 0 |
| 1502 | Ag (g/t) | 275.26 | 1.53 | 275.26 | 1.53 | 0 | 0 | 0 |
| 1502 | Au (g/t) | 1.2 | 1.02 | 1.2 | 1.02 | 0 | 0 | 0 |
| 1502 | Pb (%) | 2.51 | 1.26 | 2.51 | 1.26 | 0 | 0 | 0 |
| 1502 | Zn (%) | 6.3 | 1.23 | 6.19 | 1.24 | -0.12 | -0.02 | 0.01 |
| 1502 | Cu (%) | 0.06 | 1.49 | 0.06 | 1.48 | 0 | 0.01 | -0.01 |
| 1502 | Fe (%) | 24.74 | 0.86 | 24.74 | 0.86 | 0 | 0 | 0 |
| 1503 | Ag (g/t) | 236.47 | 1.4 | 230.2 | 1.36 | -6.27 | -0.03 | -0.04 |
| 1503 | Au (g/t) | 1.2 | 1.04 | 1.2 | 1.04 | 0 | 0 | 0 |
| 1503 | Pb (%) | 2.48 | 1.52 | 2.38 | 1.44 | -0.1 | -0.04 | -0.07 |
| 1503 | Zn (%) | 4.92 | 1.32 | 4.92 | 1.32 | 0 | 0 | 0 |
| 1503 | Cu (%) | 0.13 | 1.64 | 0.13 | 1.63 | 0 | 0 | -0.01 |
| 1503 | Fe (%) | 32.7 | 0.96 | 32.7 | 0.96 | 0 | 0 | 0 |
| 1504 | Ag (g/t) | 252.69 | 1.33 | 252.69 | 1.33 | 0 | 0 | 0 |
| 1504 | Au (g/t) | 2.36 | 1.26 | 1.9 | 1.02 | -0.46 | -0.2 | -0.25 |
| 1504 | Pb (%) | 2.32 | 1.52 | 2.32 | 1.52 | 0 | 0 | 0 |
| 1504 | Zn (%) | 3.79 | 1.46 | 3.79 | 1.46 | 0 | 0 | 0 |
| 1504 | Cu (%) | 0.05 | 0.92 | 0.05 | 0.92 | 0 | 0 | 0 |
| 1504 | Fe (%) | 30.13 | 0.86 | 30.13 | 0.86 | 0 | 0 | 0 |
| 1505 | Ag (g/t) | 102.06 | 1.06 | 102.06 | 1.06 | 0 | 0 | 0 |
| 1505 | Au (g/t) | 0.75 | 1.26 | 0.75 | 1.26 | 0 | 0 | 0 |
| 1505 | Pb (%) | 0.95 | 1.44 | 0.95 | 1.44 | 0 | 0 | 0 |
| 1505 | Zn (%) | 1.73 | 1.26 | 1.73 | 1.26 | 0 | 0 | 0 |
| 1505 | Cu (%) | 0.04 | 1.28 | 0.04 | 1.24 | 0 | 0.02 | -0.04 |
| 1505 | Fe (%) | 19.15 | 1.13 | 19.15 | 1.13 | 0 | 0 | 0 |
| 1601 | Ag (g/t) | 21.82 | 1.09 | 21.82 | 1.09 | 0 | 0 | 0 |
| 1601 | Au (g/t) | 0.16 | 0.71 | 0.16 | 0.71 | 0 | 0 | 0 |
| 1601 | Pb (%) | 1.28 | 1.46 | 1.28 | 1.46 | 0 | 0 | 0 |
| 1601 | Zn (%) | 1.81 | 0.76 | 1.81 | 0.76 | 0 | 0 | 0 |
| 1601 | Cu (%) | 0.09 | 0.98 | 0.09 | 0.98 | 0 | 0 | 0 |
| 1601 | Fe (%) | 13.68 | 0.55 | 13.68 | 0.55 | 0 | 0 | 0 |
| 1614 | Ag (g/t) | 14.43 | 0.88 | 14.43 | 0.88 | 0 | 0 | 0 |
| 1614 | Au (g/t) | 0.47 | 0.91 | 0.47 | 0.91 | 0 | 0 | 0 |
| 1614 | Pb (%) | 0.1 | 0.78 | 0.1 | 0.78 | 0 | 0 | 0 |
| 1614 | Zn (%) | 0.09 | 0.69 | 0.09 | 0.69 | 0 | 0 | 0 |
AYA GOLD & SILVER INC., BOUMADINE POLYMETALLIC PROJECT 451
| | | | | | | | | | | | | | | | | | | | | | | | | | |
| 1614 | Cu (%) | 0.04 | 0.99 | 0.04 | 0.98 | 0 | 0 | 0 |
| 1614 | Fe (%) | 12.88 | 0.76 | 12.88 | 0.76 | 0 | 0 | 0 |
| 1631 | Ag (g/t) | 87.23 | 0.81 | 87.23 | 0.81 | 0 | 0 | 0 |
| 1631 | Au (g/t) | 1.74 | 0.98 | 1.74 | 0.98 | 0 | 0 | 0 |
| 1631 | Pb (%) | 1.67 | 0.8 | 1.67 | 0.8 | 0 | 0 | 0 |
| 1631 | Zn (%) | 2.16 | 1.17 | 2.16 | 1.17 | 0 | 0 | 0 |
| 1631 | Cu (%) | 0.06 | 0.77 | 0.06 | 0.75 | 0 | 0.02 | -0.02 |
| 1631 | Fe (%) | 35.63 | 0.68 | 35.63 | 0.68 | 0 | 0 | 0 |
| 1632 | Ag (g/t) | 77.03 | 1.55 | 64.12 | 1.28 | -12.91 | -0.17 | -0.27 |
| 1632 | Au (g/t) | 3.18 | 1.39 | 2.81 | 1.25 | -0.38 | -0.12 | -0.14 |
| 1632 | Pb (%) | 1.44 | 1.94 | 0.82 | 0.77 | -0.62 | -0.43 | -1.18 |
| 1632 | Zn (%) | 1.97 | 0.67 | 1.97 | 0.67 | 0 | 0 | 0 |
| 1632 | Cu (%) | 0.13 | 1.4 | 0.12 | 1.22 | -0.02 | -0.11 | -0.18 |
| 1632 | Fe (%) | 33.16 | 0.99 | 33.16 | 0.99 | 0 | 0 | 0 |
| 2002 | Ag (g/t) | 72.51 | 1.87 | 72.51 | 1.87 | 0 | 0 | 0 |
| 2002 | Au (g/t) | 3.65 | 1.97 | 3.65 | 1.97 | 0 | 0 | 0 |
| 2002 | Pb (%) | 2.27 | 2.03 | 2.27 | 2.03 | 0 | 0 | 0 |
| 2002 | Zn (%) | 3.34 | 2.05 | 3.34 | 2.05 | 0 | 0 | 0 |
| 2002 | Cu (%) | 0.08 | 1.35 | 0.08 | 1.34 | 0 | 0.01 | -0.02 |
| 2002 | Fe (%) | 31.48 | 1.01 | 31.48 | 1.01 | 0 | 0 | 0 |
| 2004 | Ag (g/t) | 186.38 | 1.23 | 186.38 | 1.23 | 0 | 0 | 0 |
| 2004 | Au (g/t) | 3.2 | 1.02 | 3.2 | 1.02 | 0 | 0 | 0 |
| 2004 | Pb (%) | 1.23 | 1.32 | 1.23 | 1.32 | 0 | 0 | 0 |
| 2004 | Zn (%) | 4.94 | 1.02 | 4.94 | 1.02 | 0 | 0 | 0 |
| 2004 | Cu (%) | 0.3 | 1.28 | 0.31 | 1.27 | 0 | 0 | -0.01 |
| 2004 | Fe (%) | 43.24 | 0.72 | 43.24 | 0.72 | 0 | 0 | 0 |
| 2005 | Ag (g/t) | 19.57 | 0.85 | 19.57 | 0.85 | 0 | 0 | 0 |
| 2005 | Au (g/t) | 0.26 | 1.68 | 0.26 | 1.68 | 0 | 0 | 0 |
| 2005 | Pb (%) | 0.41 | 1.48 | 0.41 | 1.48 | 0 | 0 | 0 |
| 2005 | Zn (%) | 1.62 | 1.18 | 1.62 | 1.18 | 0 | 0 | 0 |
| 2005 | Cu (%) | 0.01 | 0.63 | 0.01 | 0.62 | 0 | 0.03 | -0.01 |
| 2005 | Fe (%) | 13.43 | 0.58 | 13.43 | 0.58 | 0 | 0 | 0 |
| 2006 | Ag (g/t) | 32.99 | 0.89 | 32.99 | 0.89 | 0 | 0 | 0 |
| 2006 | Au (g/t) | 0.62 | 2.32 | 0.62 | 2.32 | 0 | 0 | 0 |
| 2006 | Pb (%) | 2.81 | 1.9 | 1.86 | 1.52 | -0.95 | -0.34 | -0.39 |
| 2006 | Zn (%) | 1.74 | 1.09 | 1.74 | 1.09 | 0 | 0 | 0 |
| 2006 | Cu (%) | 0.03 | 1.3 | 0.03 | 1.28 | 0 | 0.01 | -0.01 |
| 2006 | Fe (%) | 12.1 | 1.05 | 12.1 | 1.05 | 0 | 0 | 0 |
| 2009 | Ag (g/t) | 69.51 | 0.79 | 69.51 | 0.79 | 0 | 0 | 0 |
| 2009 | Au (g/t) | 2.71 | 1.04 | 2.71 | 1.04 | 0 | 0 | 0 |
| 2009 | Pb (%) | 1.69 | 1.41 | 1.69 | 1.41 | 0 | 0 | 0 |
| 2009 | Zn (%) | 2.63 | 0.63 | 2.63 | 0.63 | 0 | 0 | 0 |
| 2009 | Cu (%) | 0.1 | 1.1 | 0.1 | 1.09 | 0 | 0.01 | -0.01 |
| 2009 | Fe (%) | 42.65 | 0.8 | 42.65 | 0.8 | 0 | 0 | 0 |
| 2012 | Ag (g/t) | 74.49 | 1.04 | 71.77 | 1.04 | -2.73 | -0.04 | 0 |
| 2012 | Au (g/t) | 1.43 | 1.43 | 1.43 | 1.43 | 0 | 0 | 0 |
| 2012 | Pb (%) | 2.26 | 1.41 | 2.26 | 1.41 | 0 | 0 | 0 |
| 2012 | Zn (%) | 6.95 | 1.41 | 6.95 | 1.41 | 0 | 0 | 0 |
| 2012 | Cu (%) | 0.08 | 1.91 | 0.08 | 1.89 | 0 | 0.01 | -0.01 |
| 2012 | Fe (%) | 25.01 | 0.84 | 25.01 | 0.84 | 0 | 0 | 0 |
| 2018 | Ag (g/t) | 176.5 | 1.01 | 176.5 | 1.01 | 0 | 0 | 0 |
AYA GOLD & SILVER INC., BOUMADINE POLYMETALLIC PROJECT 452
| | | | | | | | | | | | | | | | | | | | | | | | | | |
| 2018 | Au (g/t) | 5.06 | 1.19 | 5.06 | 1.19 | 0 | 0 | 0 |
| 2018 | Pb (%) | 1.69 | 0.76 | 1.69 | 0.76 | 0 | 0 | 0 |
| 2018 | Zn (%) | 9.29 | 0.8 | 8.88 | 0.8 | -0.41 | -0.04 | 0 |
| 2018 | Cu (%) | 0.1 | 1.29 | 0.1 | 1.28 | 0 | 0.01 | -0.01 |
| 2018 | Fe (%) | 53.38 | 1.03 | 53.38 | 1.03 | 0 | 0 | 0 |
| 2019 | Ag (g/t) | 159.32 | 0.73 | 159.32 | 0.73 | 0 | 0 | 0 |
| 2019 | Au (g/t) | 4.63 | 1.02 | 4.63 | 1.02 | 0 | 0 | 0 |
| 2019 | Pb (%) | 0.51 | 0.6 | 0.51 | 0.6 | 0 | 0 | 0 |
| 2019 | Zn (%) | 1.43 | 0.98 | 1.43 | 0.98 | 0 | 0 | 0 |
| 2019 | Cu (%) | 0.35 | 0.7 | 0.35 | 0.7 | 0 | 0 | 0 |
| 2019 | Fe (%) | 50.84 | 1.05 | 50.84 | 1.05 | 0 | 0 | 0 |
| 2020 | Ag (g/t) | 123.27 | 1.16 | 123.27 | 1.16 | 0 | 0 | 0 |
| 2020 | Au (g/t) | 13.42 | 1.38 | 10.7 | 1.26 | -2.72 | -0.2 | -0.12 |
| 2020 | Pb (%) | 1.34 | 1.94 | 1.34 | 1.94 | 0 | 0 | 0 |
| 2020 | Zn (%) | 2.78 | 1.77 | 2.78 | 1.77 | 0 | 0 | 0 |
| 2020 | Cu (%) | 0.19 | 0.91 | 0.19 | 0.9 | 0 | 0 | 0 |
| 2020 | Fe (%) | 53.1 | 0.8 | 53.1 | 0.8 | 0 | 0 | 0 |
| 2026 | Ag (g/t) | 18.6 | 0.86 | 18.6 | 0.86 | 0 | 0 | 0 |
| 2026 | Au (g/t) | 0.77 | 0.99 | 0.77 | 0.99 | 0 | 0 | 0 |
| 2026 | Pb (%) | 0.89 | 1.5 | 0.89 | 1.5 | 0 | 0 | 0 |
| 2026 | Zn (%) | 2.17 | 1.24 | 2.17 | 1.24 | 0 | 0 | 0 |
| 2026 | Cu (%) | 0.02 | 1.17 | 0.02 | 0.97 | 0 | 0.2 | -0.2 |
| 2026 | Fe (%) | 16.5 | 0.69 | 16.5 | 0.69 | 0 | 0 | 0 |
| 2091 | Ag (g/t) | 246.09 | 1.45 | 221.43 | 1.22 | -24.66 | -0.1 | -0.23 |
| 2091 | Au (g/t) | 11.33 | 1.93 | 10.15 | 1.5 | -1.18 | -0.1 | -0.42 |
| 2091 | Pb (%) | 2.03 | 1.21 | 2 | 1.17 | -0.03 | -0.01 | -0.05 |
| 2091 | Zn (%) | 7.39 | 1.34 | 7.11 | 1.21 | -0.28 | -0.04 | -0.14 |
| 2091 | Cu (%) | 0.39 | 1.71 | 0.37 | 1.51 | -0.02 | -0.04 | -0.2 |
| 2091 | Fe (%) | 74.85 | 0.89 | 73.71 | 0.86 | -1.13 | -0.02 | -0.03 |
| 2101 | Ag (g/t) | 40.64 | 1.25 | 40.64 | 1.25 | 0 | 0 | 0 |
| 2101 | Au (g/t) | 1.49 | 1.77 | 1.49 | 1.77 | 0 | 0 | 0 |
| 2101 | Pb (%) | 0.41 | 0.79 | 0.41 | 0.79 | 0 | 0 | 0 |
| 2101 | Zn (%) | 2.3 | 1.18 | 2.13 | 1.22 | -0.16 | -0.07 | 0.05 |
| 2101 | Cu (%) | 0.05 | 1.76 | 0.05 | 1.75 | 0 | 0.01 | -0.02 |
| 2101 | Fe (%) | 12.82 | 1.12 | 12.82 | 1.12 | 0 | 0 | 0 |
| 2103 | Ag (g/t) | 69.05 | 1.46 | 69.05 | 1.46 | 0 | 0 | 0 |
| 2103 | Au (g/t) | 2.47 | 2.25 | 2.47 | 2.25 | 0 | 0 | 0 |
| 2103 | Pb (%) | 1.48 | 1.72 | 1.48 | 1.72 | 0 | 0 | 0 |
| 2103 | Zn (%) | 5.09 | 1.7 | 5.09 | 1.7 | 0 | 0 | 0 |
| 2103 | Cu (%) | 0.1 | 1.75 | 0.11 | 1.74 | 0 | 0 | -0.01 |
| 2103 | Fe (%) | 30.74 | 1.48 | 30.74 | 1.48 | 0 | 0 | 0 |
| 2104 | Ag (g/t) | 99.57 | 1.71 | 98.01 | 1.68 | -1.56 | -0.02 | -0.03 |
| 2104 | Au (g/t) | 3.76 | 1.64 | 3.52 | 1.51 | -0.24 | -0.06 | -0.13 |
| 2104 | Pb (%) | 1.36 | 1.32 | 1.32 | 1.24 | -0.05 | -0.03 | -0.08 |
| 2104 | Zn (%) | 4.24 | 1.28 | 4.08 | 1.21 | -0.16 | -0.04 | -0.08 |
| 2104 | Cu (%) | 0.18 | 1.63 | 0.18 | 1.54 | -0.01 | -0.03 | -0.08 |
| 2104 | Fe (%) | 37.59 | 1.21 | 37.59 | 1.21 | 0 | 0 | 0 |
| 2106 | Ag (g/t) | 47.41 | 0.87 | 47.41 | 0.87 | 0 | 0 | 0 |
| 2106 | Au (g/t) | 2.82 | 1.35 | 2.82 | 1.35 | 0 | 0 | 0 |
| 2106 | Pb (%) | 0.94 | 1 | 0.94 | 1 | 0 | 0 | 0 |
| 2106 | Zn (%) | 2.91 | 1.18 | 2.91 | 1.18 | 0 | 0 | 0 |
AYA GOLD & SILVER INC., BOUMADINE POLYMETALLIC PROJECT 453
| | | | | | | | | | | | | | | | | | | | | | | | | | |
| 2106 | Cu (%) | 0.2 | 2.4 | 0.2 | 2.39 | 0 | 0 | 0 |
| 2106 | Fe (%) | 25.86 | 0.68 | 25.86 | 0.68 | 0 | 0 | 0 |
| 2113 | Ag (g/t) | 37.39 | 0.94 | 37.39 | 0.94 | 0 | 0 | 0 |
| 2113 | Au (g/t) | 0.94 | 1.03 | 0.94 | 1.03 | 0 | 0 | 0 |
| 2113 | Pb (%) | 0.92 | 0.7 | 0.92 | 0.7 | 0 | 0 | 0 |
| 2113 | Zn (%) | 1.76 | 0.92 | 1.76 | 0.92 | 0 | 0 | 0 |
| 2113 | Cu (%) | 0.08 | 0.68 | 0.08 | 0.68 | 0 | 0 | 0 |
| 2113 | Fe (%) | 17.82 | 0.87 | 17.82 | 0.87 | 0 | 0 | 0 |
| 2115 | Ag (g/t) | 25.11 | 0.62 | 25.11 | 0.62 | 0 | 0 | 0 |
| 2115 | Au (g/t) | 0.37 | 0.53 | 0.37 | 0.53 | 0 | 0 | 0 |
| 2115 | Pb (%) | 0.85 | 1.14 | 0.85 | 1.14 | 0 | 0 | 0 |
| 2115 | Zn (%) | 1.92 | 1.08 | 1.92 | 1.08 | 0 | 0 | 0 |
| 2115 | Cu (%) | 0.05 | 0.67 | 0.05 | 0.66 | 0 | 0.01 | -0.01 |
| 2115 | Fe (%) | 16.47 | 0.86 | 16.47 | 0.86 | 0 | 0 | 0 |
| 2117 | Ag (g/t) | 140.7 | 1.26 | 140.7 | 1.26 | 0 | 0 | 0 |
| 2117 | Au (g/t) | 4.72 | 1.66 | 4.72 | 1.66 | 0 | 0 | 0 |
| 2117 | Pb (%) | 1.21 | 1.26 | 1.21 | 1.26 | 0 | 0 | 0 |
| 2117 | Zn (%) | 1.77 | 1.07 | 1.77 | 1.07 | 0 | 0 | 0 |
| 2117 | Cu (%) | 0.26 | 1.69 | 0.26 | 1.69 | 0 | 0 | -0.01 |
| 2117 | Fe (%) | 34.61 | 1.01 | 34.61 | 1.01 | 0 | 0 | 0 |
| 2118 | Ag (g/t) | 58.32 | 0.72 | 58.32 | 0.72 | 0 | 0 | 0 |
| 2118 | Au (g/t) | 2.36 | 1.02 | 2.36 | 1.02 | 0 | 0 | 0 |
| 2118 | Pb (%) | 1.22 | 0.69 | 1.22 | 0.69 | 0 | 0 | 0 |
| 2118 | Zn (%) | 3.19 | 0.62 | 3.19 | 0.62 | 0 | 0 | 0 |
| 2118 | Cu (%) | 0.15 | 1.43 | 0.15 | 1.42 | 0 | 0 | -0.01 |
| 2118 | Fe (%) | 38.73 | 1.04 | 38.73 | 1.04 | 0 | 0 | 0 |
| 2120 | Ag (g/t) | 169.33 | 0.54 | 169.33 | 0.54 | 0 | 0 | 0 |
| 2120 | Au (g/t) | 5.39 | 0.7 | 5.39 | 0.7 | 0 | 0 | 0 |
| 2120 | Pb (%) | 1.01 | 0.83 | 1.01 | 0.83 | 0 | 0 | 0 |
| 2120 | Zn (%) | 3.01 | 1.08 | 3.01 | 1.08 | 0 | 0 | 0 |
| 2120 | Cu (%) | 0.37 | 0.68 | 0.37 | 0.68 | 0 | 0 | 0 |
| 2120 | Fe (%) | 41.91 | 0.61 | 41.91 | 0.61 | 0 | 0 | 0 |
| 2122 | Ag (g/t) | 236.89 | 1.81 | 236.89 | 1.81 | 0 | 0 | 0 |
| 2122 | Au (g/t) | 1.65 | 1.28 | 1.65 | 1.28 | 0 | 0 | 0 |
| 2122 | Pb (%) | 1.31 | 1.48 | 1.31 | 1.48 | 0 | 0 | 0 |
| 2122 | Zn (%) | 0.68 | 1.2 | 0.68 | 1.2 | 0 | 0 | 0 |
| 2122 | Cu (%) | 0.08 | 1 | 0.08 | 0.98 | 0 | 0.01 | -0.02 |
| 2122 | Fe (%) | 24.71 | 0.93 | 24.71 | 0.93 | 0 | 0 | 0 |
| 2127 | Ag (g/t) | 19.8 | 0.77 | 19.8 | 0.77 | 0 | 0 | 0 |
| 2127 | Au (g/t) | 0.07 | 0.83 | 0.07 | 0.83 | 0 | 0 | 0 |
| 2127 | Pb (%) | 0.12 | 0.69 | 0.12 | 0.69 | 0 | 0 | 0 |
| 2127 | Zn (%) | 1.27 | 0.95 | 1.27 | 0.95 | 0 | 0 | 0 |
| 2127 | Cu (%) | 0.1 | 0.89 | 0.1 | 0.89 | 0 | 0 | 0 |
| 2127 | Fe (%) | 9.84 | 0.3 | 9.84 | 0.3 | 0 | 0 | 0 |
| 2130 | Ag (g/t) | 19.55 | 0.64 | 19.55 | 0.64 | 0 | 0 | 0 |
| 2130 | Au (g/t) | 0.9 | 1.49 | 0.9 | 1.49 | 0 | 0 | 0 |
| 2130 | Pb (%) | 1.43 | 0.97 | 1.43 | 0.97 | 0 | 0 | 0 |
| 2130 | Zn (%) | 2.07 | 1.45 | 2.07 | 1.45 | 0 | 0 | 0 |
| 2130 | Cu (%) | 0.15 | 1.54 | 0.15 | 1.54 | 0 | 0 | 0 |
| 2130 | Fe (%) | 11.62 | 0.55 | 11.62 | 0.55 | 0 | 0 | 0 |
| 2131 | Ag (g/t) | 21.9 | 0.74 | 21.9 | 0.74 | 0 | 0 | 0 |
AYA GOLD & SILVER INC., BOUMADINE POLYMETALLIC PROJECT 454
| | | | | | | | | | | | | | | | | | | | | | | | | | |
| 2131 | Au (g/t) | 1.28 | 0.9 | 1.28 | 0.9 | 0 | 0 | 0 |
| 2131 | Pb (%) | 0.69 | 1.14 | 0.69 | 1.14 | 0 | 0 | 0 |
| 2131 | Zn (%) | 1.53 | 1.34 | 1.53 | 1.34 | 0 | 0 | 0 |
| 2131 | Cu (%) | 0.03 | 0.74 | 0.03 | 0.74 | 0 | 0.01 | 0 |
| 2131 | Fe (%) | 23.49 | 0.61 | 23.49 | 0.61 | 0 | 0 | 0 |
| 2132 | Ag (g/t) | 22.7 | 1.36 | 22.7 | 1.36 | 0 | 0 | 0 |
| 2132 | Au (g/t) | 0.47 | 1.82 | 0.47 | 1.82 | 0 | 0 | 0 |
| 2132 | Pb (%) | 0.64 | 2.15 | 0.64 | 2.15 | 0 | 0 | 0 |
| 2132 | Zn (%) | 1.14 | 1.09 | 1.14 | 1.09 | 0 | 0 | 0 |
| 2132 | Cu (%) | 0.05 | 1.98 | 0.05 | 1.97 | 0 | 0 | -0.01 |
| 2132 | Fe (%) | 11.08 | 1.22 | 11.08 | 1.22 | 0 | 0 | 0 |
| 2203 | Ag (g/t) | 126.03 | 1.48 | 105.84 | 1.21 | -20.18 | -0.16 | -0.28 |
| 2203 | Au (g/t) | 0.65 | 1.63 | 0.65 | 1.63 | 0 | 0 | 0 |
| 2203 | Pb (%) | 1.46 | 0.76 | 1.46 | 0.76 | 0 | 0 | 0 |
| 2203 | Zn (%) | 5.1 | 1.11 | 5.1 | 1.11 | 0 | 0 | 0 |
| 2203 | Cu (%) | 0.02 | 0.62 | 0.02 | 0.7 | 0 | 0.13 | 0.07 |
| 2203 | Fe (%) | 20.8 | 0.82 | 20.8 | 0.82 | 0 | 0 | 0 |
| 2207 | Ag (g/t) | 131.52 | 1.62 | 131.52 | 1.62 | 0 | 0 | 0 |
| 2207 | Au (g/t) | 3.82 | 1.68 | 3.82 | 1.68 | 0 | 0 | 0 |
| 2207 | Pb (%) | 1.12 | 1.36 | 1.12 | 1.36 | 0 | 0 | 0 |
| 2207 | Zn (%) | 1.13 | 0.82 | 1.13 | 0.82 | 0 | 0 | 0 |
| 2207 | Cu (%) | 0.03 | 0.98 | 0.03 | 0.91 | 0 | 0.04 | -0.07 |
| 2207 | Fe (%) | 19.12 | 0.67 | 19.12 | 0.67 | 0 | 0 | 0 |
| 2213 | Ag (g/t) | 83.75 | 0.96 | 83.75 | 0.96 | 0 | 0 | 0 |
| 2213 | Au (g/t) | 4.74 | 0.75 | 4.74 | 0.75 | 0 | 0 | 0 |
| 2213 | Pb (%) | 0.75 | 0.82 | 0.75 | 0.82 | 0 | 0 | 0 |
| 2213 | Zn (%) | 1.57 | 1.26 | 1.57 | 1.26 | 0 | 0 | 0 |
| 2213 | Cu (%) | 0.14 | 0.59 | 0.14 | 0.6 | 0 | 0.01 | 0.01 |
| 2213 | Fe (%) | 26.85 | 0.43 | 26.85 | 0.43 | 0 | 0 | 0 |
| 2215 | Ag (g/t) | 22.12 | 1.28 | 22.12 | 1.28 | 0 | 0 | 0 |
| 2215 | Au (g/t) | 0.43 | 1.07 | 0.43 | 1.07 | 0 | 0 | 0 |
| 2215 | Pb (%) | 1.22 | 1.2 | 1.22 | 1.2 | 0 | 0 | 0 |
| 2215 | Zn (%) | 16.14 | 1.49 | 16.14 | 1.49 | 0 | 0 | 0 |
| 2215 | Cu (%) | 0.05 | 1.18 | 0.05 | 1.18 | 0 | 0 | 0 |
| 2215 | Fe (%) | 39.98 | 0.88 | 39.98 | 0.88 | 0 | 0 | 0 |
| 2216 | Ag (g/t) | 28.53 | 0.82 | 28.53 | 0.82 | 0 | 0 | 0 |
| 2216 | Au (g/t) | 0.85 | 1.37 | 0.85 | 1.37 | 0 | 0 | 0 |
| 2216 | Pb (%) | 0.51 | 1.17 | 0.51 | 1.17 | 0 | 0 | 0 |
| 2216 | Zn (%) | 1.96 | 1.62 | 1.96 | 1.62 | 0 | 0 | 0 |
| 2216 | Cu (%) | 0.02 | 0.76 | 0.02 | 0.71 | 0 | 0.03 | -0.04 |
| 2216 | Fe (%) | 13.51 | 0.47 | 13.51 | 0.47 | 0 | 0 | 0 |
| 2219 | Ag (g/t) | 159.53 | 1.36 | 159.53 | 1.36 | 0 | 0 | 0 |
| 2219 | Au (g/t) | 5.8 | 1.34 | 5.8 | 1.34 | 0 | 0 | 0 |
| 2219 | Pb (%) | 1.72 | 0.71 | 1.72 | 0.71 | 0 | 0 | 0 |
| 2219 | Zn (%) | 1.76 | 1.63 | 1.76 | 1.63 | 0 | 0 | 0 |
| 2219 | Cu (%) | 0.25 | 1.3 | 0.25 | 1.3 | 0 | 0 | 0 |
| 2219 | Fe (%) | 46.91 | 1.02 | 46.91 | 1.02 | 0 | 0 | 0 |
| 2221 | Ag (g/t) | 34.16 | 0.75 | 34.16 | 0.75 | 0 | 0 | 0 |
| 2221 | Au (g/t) | 0.69 | 1.37 | 0.69 | 1.37 | 0 | 0 | 0 |
| 2221 | Pb (%) | 1.05 | 0.88 | 1.05 | 0.88 | 0 | 0 | 0 |
| 2221 | Zn (%) | 1.07 | 1.01 | 1.07 | 1.01 | 0 | 0 | 0 |
AYA GOLD & SILVER INC., BOUMADINE POLYMETALLIC PROJECT 455
| | | | | | | | | | | | | | | | | | | | | | | | | | |
| 2221 | Cu (%) | 0.03 | 1.17 | 0.03 | 1.15 | 0 | 0.01 | -0.02 |
| 2221 | Fe (%) | 14.05 | 0.89 | 14.05 | 0.89 | 0 | 0 | 0 |
| 2222 | Ag (g/t) | 35.97 | 0.84 | 35.97 | 0.84 | 0 | 0 | 0 |
| 2222 | Au (g/t) | 0.31 | 0.48 | 0.31 | 0.48 | 0 | 0 | 0 |
| 2222 | Pb (%) | 1.84 | 1.18 | 1.84 | 1.18 | 0 | 0 | 0 |
| 2222 | Zn (%) | 20.38 | 1.39 | 16.46 | 1.28 | -3.91 | -0.19 | -0.11 |
| 2222 | Cu (%) | 0.15 | 1.45 | 0.15 | 1.43 | 0 | 0.01 | -0.02 |
| 2222 | Fe (%) | 12.75 | 0.45 | 12.75 | 0.45 | 0 | 0 | 0 |
| 2223 | Ag (g/t) | 105.52 | 1.35 | 95.32 | 1.25 | -10.2 | -0.1 | -0.1 |
| 2223 | Au (g/t) | 2.77 | 1.56 | 2.77 | 1.56 | 0 | 0 | 0 |
| 2223 | Pb (%) | 1.15 | 0.92 | 1.15 | 0.92 | 0 | 0 | 0 |
| 2223 | Zn (%) | 3.84 | 1.17 | 3.84 | 1.17 | 0 | 0 | 0 |
| 2223 | Cu (%) | 0.04 | 0.87 | 0.04 | 0.85 | 0 | 0.05 | -0.02 |
| 2223 | Fe (%) | 27.96 | 1.22 | 27.96 | 1.22 | 0 | 0 | 0 |
| 2224 | Ag (g/t) | 46.72 | 0.32 | 46.72 | 0.32 | 0 | 0 | 0 |
| 2224 | Au (g/t) | 1.41 | 1 | 1.41 | 1 | 0 | 0 | 0 |
| 2224 | Pb (%) | 5.15 | 0.91 | 2.6 | 0.81 | -2.55 | -0.5 | -0.09 |
| 2224 | Zn (%) | 1.23 | 0.84 | 1.23 | 0.84 | 0 | 0 | 0 |
| 2224 | Cu (%) | 0.03 | 0.24 | 0.04 | 0.17 | 0 | 0.06 | -0.07 |
| 2224 | Fe (%) | 12.9 | 0.78 | 12.9 | 0.78 | 0 | 0 | 0 |
| 2225 | Ag (g/t) | 44.93 | 1.47 | 44.93 | 1.47 | 0 | 0 | 0 |
| 2225 | Au (g/t) | 3.86 | 1.31 | 3.86 | 1.31 | 0 | 0 | 0 |
| 2225 | Pb (%) | 0.39 | 1.38 | 0.39 | 1.38 | 0 | 0 | 0 |
| 2225 | Zn (%) | 0.49 | 1.11 | 0.49 | 1.11 | 0 | 0 | 0 |
| 2225 | Cu (%) | 0.1 | 1.47 | 0.1 | 1.47 | 0 | 0 | 0 |
| 2225 | Fe (%) | 26.53 | 1.22 | 26.53 | 1.22 | 0 | 0 | 0 |
| 2235 | Ag (g/t) | 19.09 | 1.11 | 19.09 | 1.11 | 0 | 0 | 0 |
| 2235 | Au (g/t) | 4.07 | 1.52 | 4.07 | 1.52 | 0 | 0 | 0 |
| 2235 | Pb (%) | 0.56 | 1.22 | 0.56 | 1.22 | 0 | 0 | 0 |
| 2235 | Zn (%) | 3.28 | 0.78 | 3.28 | 0.78 | 0 | 0 | 0 |
| 2235 | Cu (%) | 0.03 | 0.58 | 0.03 | 0.58 | 0 | 0 | 0 |
| 2235 | Fe (%) | 14.27 | 1.03 | 14.27 | 1.03 | 0 | 0 | 0 |
| 2236 | Ag (g/t) | 106.32 | 0.68 | 106.32 | 0.68 | 0 | 0 | 0 |
| 2236 | Au (g/t) | 1.03 | 0.79 | 1.03 | 0.79 | 0 | 0 | 0 |
| 2236 | Pb (%) | 0.85 | 0.59 | 0.85 | 0.59 | 0 | 0 | 0 |
| 2236 | Zn (%) | 2.29 | 0.69 | 2.29 | 0.69 | 0 | 0 | 0 |
| 2236 | Cu (%) | 0.04 | 0.8 | 0.04 | 0.79 | 0 | 0.01 | -0.02 |
| 2236 | Fe (%) | 27.33 | 0.37 | 27.33 | 0.37 | 0 | 0 | 0 |
| 2309 | Ag (g/t) | 117.84 | 1.65 | 117.84 | 1.65 | 0 | 0 | 0 |
| 2309 | Au (g/t) | 1.65 | 1.51 | 1.65 | 1.51 | 0 | 0 | 0 |
| 2309 | Pb (%) | 1.47 | 1.43 | 1.47 | 1.43 | 0 | 0 | 0 |
| 2309 | Zn (%) | 0.62 | 0.98 | 0.62 | 0.98 | 0 | 0 | 0 |
| 2309 | Cu (%) | 0.11 | 1.15 | 0.11 | 1.15 | 0 | 0 | 0 |
| 2309 | Fe (%) | 23.55 | 0.61 | 23.55 | 0.61 | 0 | 0 | 0 |
| 2311 | Ag (g/t) | 46.16 | 0.78 | 46.16 | 0.78 | 0 | 0 | 0 |
| 2311 | Au (g/t) | 1.72 | 0.85 | 1.72 | 0.85 | 0 | 0 | 0 |
| 2311 | Pb (%) | 1.07 | 1.72 | 1.07 | 1.72 | 0 | 0 | 0 |
| 2311 | Zn (%) | 3.22 | 1.39 | 3.22 | 1.39 | 0 | 0 | 0 |
| 2311 | Cu (%) | 0.07 | 1.22 | 0.07 | 1.21 | 0 | 0.01 | -0.01 |
| 2311 | Fe (%) | 24.58 | 0.61 | 24.58 | 0.61 | 0 | 0 | 0 |
| 2314 | Ag (g/t) | 74.95 | 1.27 | 74.95 | 1.27 | 0 | 0 | 0 |
AYA GOLD & SILVER INC., BOUMADINE POLYMETALLIC PROJECT 456
| | | | | | | | | | | | | | | | | | | | | | | | | | |
| 2314 | Au (g/t) | 0.68 | 0.57 | 0.68 | 0.57 | 0 | 0 | 0 |
| 2314 | Pb (%) | 1.06 | 0.78 | 1.06 | 0.78 | 0 | 0 | 0 |
| 2314 | Zn (%) | 2.82 | 1.34 | 2.82 | 1.34 | 0 | 0 | 0 |
| 2314 | Cu (%) | 0.16 | 0.74 | 0.16 | 0.74 | 0 | 0 | 0 |
| 2314 | Fe (%) | 28 | 0.65 | 28 | 0.65 | 0 | 0 | 0 |
| 2327 | Ag (g/t) | 33.13 | 0.55 | 33.13 | 0.55 | 0 | 0 | 0 |
| 2327 | Au (g/t) | 0.88 | 0.99 | 0.88 | 0.99 | 0 | 0 | 0 |
| 2327 | Pb (%) | 0.24 | 0.29 | 0.24 | 0.29 | 0 | 0 | 0 |
| 2327 | Zn (%) | 1.03 | 0.67 | 1.03 | 0.67 | 0 | 0 | 0 |
| 2327 | Cu (%) | 0.02 | 0.77 | 0.02 | 0.77 | 0 | 0.01 | 0 |
| 2327 | Fe (%) | 16.08 | 0.75 | 16.08 | 0.75 | 0 | 0 | 0 |
| 2400 | Ag (g/t) | 144.66 | 0.89 | 142.39 | 0.89 | -2.27 | -0.02 | 0 |
| 2400 | Au (g/t) | 2.76 | 1 | 2.76 | 1 | 0 | 0 | 0 |
| 2400 | Pb (%) | 1.34 | 2.11 | 1.11 | 1.68 | -0.24 | -0.17 | -0.43 |
| 2400 | Zn (%) | 1.85 | 1.41 | 1.85 | 1.41 | 0 | 0 | 0 |
| 2400 | Cu (%) | 0.12 | 1.47 | 0.12 | 1.45 | 0 | 0.01 | -0.02 |
| 2400 | Fe (%) | 41.14 | 0.7 | 41.14 | 0.7 | 0 | 0 | 0 |
| 2401 | Ag (g/t) | 43.93 | 1.02 | 43.93 | 1.02 | 0 | 0 | 0 |
| 2401 | Au (g/t) | 0.44 | 2.36 | 0.44 | 2.36 | 0 | 0 | 0 |
| 2401 | Pb (%) | 2.58 | 1.68 | 2.55 | 1.68 | -0.03 | -0.01 | 0 |
| 2401 | Zn (%) | 1.87 | 1.48 | 1.87 | 1.48 | 0 | 0 | 0 |
| 2401 | Cu (%) | 0.05 | 1.64 | 0.05 | 1.63 | 0 | 0 | -0.01 |
| 2401 | Fe (%) | 15.4 | 1.68 | 15.4 | 1.68 | 0 | 0 | 0 |
| 2405 | Ag (g/t) | 134.01 | 1.43 | 51.73 | 0.64 | -82.28 | -0.61 | -0.79 |
| 2405 | Au (g/t) | 1.81 | 1.58 | 0.56 | 0.79 | -1.25 | -0.69 | -0.79 |
| 2405 | Pb (%) | 1.6 | 0.86 | 1.6 | 0.86 | 0 | 0 | 0 |
| 2405 | Zn (%) | 3.33 | 1.16 | 2.27 | 0.94 | -1.06 | -0.32 | -0.22 |
| 2405 | Cu (%) | 0.05 | 0.58 | 0.06 | 0.6 | 0 | 0.04 | 0.01 |
| 2405 | Fe (%) | 55.31 | 1.12 | 48.07 | 0.99 | -7.24 | -0.13 | -0.12 |
| 2408 | Ag (g/t) | 69.81 | 1.17 | 69.81 | 1.17 | 0 | 0 | 0 |
| 2408 | Au (g/t) | 1.03 | 0.66 | 1.03 | 0.66 | 0 | 0 | 0 |
| 2408 | Pb (%) | 0.47 | 1.41 | 0.47 | 1.41 | 0 | 0 | 0 |
| 2408 | Zn (%) | 0.69 | 1.38 | 0.69 | 1.38 | 0 | 0 | 0 |
| 2408 | Cu (%) | 0.09 | 1.75 | 0.09 | 1.75 | 0 | 0 | 0 |
| 2408 | Fe (%) | 13.43 | 0.54 | 13.43 | 0.54 | 0 | 0 | 0 |
| 2410 | Ag (g/t) | 117.02 | 1.79 | 119.56 | 1.8 | 2.54 | 0.02 | 0.01 |
| 2410 | Au (g/t) | 2.39 | 2.03 | 2.43 | 2.03 | 0.04 | 0.02 | 0 |
| 2410 | Pb (%) | 1.4 | 1.23 | 1.4 | 1.23 | 0 | 0 | 0 |
| 2410 | Zn (%) | 3.33 | 1.07 | 3.36 | 1.07 | 0.03 | 0.01 | 0 |
| 2410 | Cu (%) | 0.08 | 1.98 | 0.08 | 1.96 | 0 | 0.01 | -0.02 |
| 2410 | Fe (%) | 30.62 | 1.23 | 30.62 | 1.23 | 0 | 0 | 0 |
| 2411 | Ag (g/t) | 29.57 | 0.81 | 29.57 | 0.81 | 0 | 0 | 0 |
| 2411 | Au (g/t) | 2.3 | 1.34 | 2.3 | 1.34 | 0 | 0 | 0 |
| 2411 | Pb (%) | 0.34 | 0.84 | 0.34 | 0.84 | 0 | 0 | 0 |
| 2411 | Zn (%) | 0.75 | 0.81 | 0.75 | 0.81 | 0 | 0 | 0 |
| 2411 | Cu (%) | 0.05 | 0.86 | 0.05 | 0.86 | 0 | 0 | 0 |
| 2411 | Fe (%) | 34.54 | 1.13 | 34.54 | 1.13 | 0 | 0 | 0 |
| 2417 | Ag (g/t) | 33.86 | 0.84 | 33.86 | 0.84 | 0 | 0 | 0 |
| 2417 | Au (g/t) | 1.34 | 1.01 | 1.34 | 1.01 | 0 | 0 | 0 |
| 2417 | Pb (%) | 0.33 | 0.99 | 0.33 | 0.99 | 0 | 0 | 0 |
| 2417 | Zn (%) | 0.59 | 1.07 | 0.59 | 1.07 | 0 | 0 | 0 |
AYA GOLD & SILVER INC., BOUMADINE POLYMETALLIC PROJECT 457
| | | | | | | | | | | | | | | | | | | | | | | | | | |
| 2417 | Cu (%) | 0.01 | 0.35 | 0.01 | 0.35 | 0 | 0 | 0 |
| 2417 | Fe (%) | 20.67 | 0.61 | 20.67 | 0.61 | 0 | 0 | 0 |
| 2424 | Ag (g/t) | 21.66 | 0.42 | 21.66 | 0.42 | 0 | 0 | 0 |
| 2424 | Au (g/t) | 0.59 | 0.84 | 0.59 | 0.84 | 0 | 0 | 0 |
| 2424 | Pb (%) | 0.59 | 0.8 | 0.59 | 0.8 | 0 | 0 | 0 |
| 2424 | Zn (%) | 1.44 | 0.78 | 1.44 | 0.78 | 0 | 0 | 0 |
| 2424 | Cu (%) | 0.02 | 0.89 | 0.02 | 0.89 | 0 | 0 | 0 |
| 2424 | Fe (%) | 15.1 | 0.51 | 15.1 | 0.51 | 0 | 0 | 0 |
| 2425 | Ag (g/t) | 26.48 | 0.77 | 26.48 | 0.77 | 0 | 0 | 0 |
| 2425 | Au (g/t) | 0.2 | 1.66 | 0.2 | 1.66 | 0 | 0 | 0 |
| 2425 | Pb (%) | 1.73 | 1.26 | 1.65 | 1.24 | -0.08 | -0.05 | -0.02 |
| 2425 | Zn (%) | 0.92 | 1.11 | 0.92 | 1.11 | 0 | 0 | 0 |
| 2425 | Cu (%) | 0.21 | 1.08 | 0.21 | 1.08 | 0 | 0 | 0 |
| 2425 | Fe (%) | 2.2 | 0.74 | 2.2 | 0.74 | 0 | 0 | 0 |
| 2502 | Ag (g/t) | 42.23 | 1.12 | 42.23 | 1.12 | 0 | 0 | 0 |
| 2502 | Au (g/t) | 2.15 | 1.39 | 2.15 | 1.39 | 0 | 0 | 0 |
| 2502 | Pb (%) | 1.61 | 1.64 | 1.47 | 1.6 | -0.15 | -0.09 | -0.04 |
| 2502 | Zn (%) | 1.45 | 1.36 | 1.45 | 1.36 | 0 | 0 | 0 |
| 2502 | Cu (%) | 0.2 | 1.44 | 0.2 | 1.44 | 0 | 0 | 0 |
| 2502 | Fe (%) | 34.42 | 1.01 | 34.42 | 1.01 | 0 | 0 | 0 |
| 2507 | Ag (g/t) | 79.07 | 1.57 | 79.07 | 1.57 | 0 | 0 | 0 |
| 2507 | Au (g/t) | 2.82 | 2.87 | 2.82 | 2.87 | 0 | 0 | 0 |
| 2507 | Pb (%) | 0.88 | 1.5 | 0.88 | 1.5 | 0 | 0 | 0 |
| 2507 | Zn (%) | 2.19 | 1.56 | 2.19 | 1.56 | 0 | 0 | 0 |
| 2507 | Cu (%) | 0.12 | 1.67 | 0.12 | 1.65 | 0 | 0.01 | -0.02 |
| 2507 | Fe (%) | 21.73 | 1.39 | 21.73 | 1.39 | 0 | 0 | 0 |
| 2510 | Ag (g/t) | 48.26 | 0.83 | 48.26 | 0.83 | 0 | 0 | 0 |
| 2510 | Au (g/t) | 1.28 | 1.24 | 1.28 | 1.24 | 0 | 0 | 0 |
| 2510 | Pb (%) | 0.71 | 0.83 | 0.71 | 0.83 | 0 | 0 | 0 |
| 2510 | Zn (%) | 0.89 | 0.84 | 0.89 | 0.84 | 0 | 0 | 0 |
| 2510 | Cu (%) | 0.24 | 1.26 | 0.24 | 1.26 | 0 | 0 | 0 |
| 2510 | Fe (%) | 53.06 | 1.33 | 46.81 | 1.2 | -6.25 | -0.12 | -0.13 |
| 2538 | Ag (g/t) | 12.49 | 0.73 | 12.49 | 0.73 | 0 | 0 | 0 |
| 2538 | Au (g/t) | 0.1 | 0.97 | 0.1 | 0.97 | 0 | 0 | 0 |
| 2538 | Pb (%) | 0.8 | 1.47 | 0.8 | 1.47 | 0 | 0 | 0 |
| 2538 | Zn (%) | 3.1 | 1.97 | 2.85 | 1.9 | -0.25 | -0.08 | -0.07 |
| 2538 | Cu (%) | 0.02 | 1.5 | 0.02 | 1.44 | 0 | 0.03 | -0.06 |
| 2538 | Fe (%) | 6.19 | 0.55 | 6.19 | 0.55 | 0 | 0 | 0 |
| 2614 | Ag (g/t) | 51.77 | 0.59 | 51.77 | 0.59 | 0 | 0 | 0 |
| 2614 | Au (g/t) | 0.4 | 0.83 | 0.4 | 0.83 | 0 | 0 | 0 |
| 2614 | Pb (%) | 0.96 | 0.72 | 0.96 | 0.72 | 0 | 0 | 0 |
| 2614 | Zn (%) | 3.33 | 1.04 | 3.33 | 1.04 | 0 | 0 | 0 |
| 2614 | Cu (%) | 0.27 | 1.67 | 0.27 | 1.66 | 0 | 0.01 | -0.01 |
| 2614 | Fe (%) | 35.15 | 0.53 | 35.15 | 0.53 | 0 | 0 | 0 |
| 2729 | Ag (g/t) | 36.32 | 0.72 | 36.32 | 0.72 | 0 | 0 | 0 |
| 2729 | Au (g/t) | 1.87 | 0.82 | 1.87 | 0.82 | 0 | 0 | 0 |
| 2729 | Pb (%) | 0.51 | 0.28 | 0.51 | 0.28 | 0 | 0 | 0 |
| 2729 | Zn (%) | 0.61 | 0.51 | 0.61 | 0.51 | 0 | 0 | 0 |
| 2729 | Cu (%) | 0.09 | 1.06 | 0.09 | 1.06 | 0 | 0 | 0 |
| 2729 | Fe (%) | 32.21 | 0.72 | 32.21 | 0.72 | 0 | 0 | 0 |
| 2802 | Ag (g/t) | 63.43 | 1.1 | 62.05 | 1.08 | -1.38 | -0.02 | -0.02 |
AYA GOLD & SILVER INC., BOUMADINE POLYMETALLIC PROJECT 458
| | | | | | | | | | | | | | | | | | | | | | | | | | |
| 2802 | Au (g/t) | 1.36 | 1.32 | 1.36 | 1.32 | 0 | 0 | 0 |
| 2802 | Pb (%) | 2.56 | 1.12 | 2.56 | 1.12 | 0 | 0 | 0 |
| 2802 | Zn (%) | 4.83 | 1.39 | 4.83 | 1.39 | 0 | 0 | 0 |
| 2802 | Cu (%) | 0.05 | 1.08 | 0.05 | 1.06 | 0 | 0.01 | -0.02 |
| 2802 | Fe (%) | 16.78 | 1.07 | 16.78 | 1.07 | 0 | 0 | 0 |
| 3001 | Ag (g/t) | 68.96 | 2.07 | 49.24 | 1.29 | -19.72 | -0.29 | -0.78 |
| 3001 | Au (g/t) | 1.34 | 1.49 | 1.34 | 1.49 | 0 | 0 | 0 |
| 3001 | Pb (%) | 0.64 | 0.97 | 0.64 | 0.97 | 0 | 0 | 0 |
| 3001 | Zn (%) | 1.62 | 1.21 | 1.62 | 1.21 | 0 | 0 | 0 |
| 3001 | Cu (%) | 0.1 | 1.67 | 0.1 | 1.67 | 0 | 0 | 0 |
| 3001 | Fe (%) | 28.67 | 1.16 | 28.67 | 1.16 | 0 | 0 | 0 |
| 3002 | Ag (g/t) | 28.9 | 0.54 | 28.9 | 0.54 | 0 | 0 | 0 |
| 3002 | Au (g/t) | 0.72 | 0.52 | 0.72 | 0.52 | 0 | 0 | 0 |
| 3002 | Pb (%) | 0.76 | 1.33 | 0.76 | 1.33 | 0 | 0 | 0 |
| 3002 | Zn (%) | 1.5 | 0.82 | 1.5 | 0.82 | 0 | 0 | 0 |
| 3002 | Cu (%) | 0.02 | 0.5 | 0.03 | 0.5 | 0 | 0.01 | 0 |
| 3002 | Fe (%) | 14.06 | 0.45 | 14.06 | 0.45 | 0 | 0 | 0 |
| 3003 | Ag (g/t) | 17.77 | 0.93 | 17.77 | 0.93 | 0 | 0 | 0 |
| 3003 | Au (g/t) | 0.19 | 0.85 | 0.19 | 0.85 | 0 | 0 | 0 |
| 3003 | Pb (%) | 0.39 | 0.84 | 0.39 | 0.84 | 0 | 0 | 0 |
| 3003 | Zn (%) | 0.78 | 1.05 | 0.78 | 1.05 | 0 | 0 | 0 |
| 3003 | Cu (%) | 0.04 | 0.56 | 0.04 | 0.56 | 0 | 0 | 0 |
| 3003 | Fe (%) | 16.71 | 0.67 | 16.71 | 0.67 | 0 | 0 | 0 |
| 3004 | Ag (g/t) | 31.97 | 0.93 | 31.97 | 0.93 | 0 | 0 | 0 |
| 3004 | Au (g/t) | 1.19 | 1.29 | 1.19 | 1.29 | 0 | 0 | 0 |
| 3004 | Pb (%) | 0.85 | 1.79 | 0.85 | 1.79 | 0 | 0 | 0 |
| 3004 | Zn (%) | 1.34 | 1.09 | 1.34 | 1.09 | 0 | 0 | 0 |
| 3004 | Cu (%) | 0.05 | 1.37 | 0.05 | 1.38 | 0 | 0.02 | 0.02 |
| 3004 | Fe (%) | 16.74 | 0.77 | 16.74 | 0.77 | 0 | 0 | 0 |
| 3005 | Ag (g/t) | 61.28 | 0.68 | 61.28 | 0.68 | 0 | 0 | 0 |
| 3005 | Au (g/t) | 2.51 | 1.2 | 2.51 | 1.2 | 0 | 0 | 0 |
| 3005 | Pb (%) | 0.83 | 0.7 | 0.83 | 0.7 | 0 | 0 | 0 |
| 3005 | Zn (%) | 1.91 | 1.29 | 1.91 | 1.29 | 0 | 0 | 0 |
| 3005 | Cu (%) | 0.05 | 0.75 | 0.05 | 0.74 | 0 | 0.02 | -0.01 |
| 3005 | Fe (%) | 35.41 | 0.76 | 35.41 | 0.76 | 0 | 0 | 0 |
| 3006 | Ag (g/t) | 55.43 | 1.18 | 55.43 | 1.18 | 0 | 0 | 0 |
| 3006 | Au (g/t) | 1.18 | 0.98 | 1.18 | 0.98 | 0 | 0 | 0 |
| 3006 | Pb (%) | 0.85 | 0.92 | 0.85 | 0.92 | 0 | 0 | 0 |
| 3006 | Zn (%) | 5.2 | 0.97 | 4.66 | 0.9 | -0.53 | -0.1 | -0.07 |
| 3006 | Cu (%) | 0.15 | 1.37 | 0.15 | 1.37 | 0 | 0 | 0 |
| 3006 | Fe (%) | 35.87 | 1.03 | 35.87 | 1.03 | 0 | 0 | 0 |
| 3007 | Ag (g/t) | 56.4 | 1.07 | 56.4 | 1.07 | 0 | 0 | 0 |
| 3007 | Au (g/t) | 0.49 | 1.48 | 0.49 | 1.48 | 0 | 0 | 0 |
| 3007 | Pb (%) | 0.9 | 1.21 | 0.9 | 1.21 | 0 | 0 | 0 |
| 3007 | Zn (%) | 2 | 0.44 | 2 | 0.44 | 0 | 0 | 0 |
| 3007 | Cu (%) | 0.12 | 1.06 | 0.12 | 1.06 | 0 | 0 | 0 |
| 3007 | Fe (%) | 27.03 | 0.55 | 27.03 | 0.55 | 0 | 0 | 0 |
| 3008 | Ag (g/t) | 83.32 | 0.85 | 83.32 | 0.85 | 0 | 0 | 0 |
| 3008 | Au (g/t) | 0.32 | 0.53 | 0.32 | 0.53 | 0 | 0 | 0 |
| 3008 | Pb (%) | 0.56 | 0.61 | 0.56 | 0.61 | 0 | 0 | 0 |
| 3008 | Zn (%) | 1.94 | 0.45 | 1.94 | 0.45 | 0 | 0 | 0 |
AYA GOLD & SILVER INC., BOUMADINE POLYMETALLIC PROJECT 459
| | | | | | | | | | | | | | | | | | | | | | | | | | |
| 3008 | Cu (%) | 0.04 | 0.55 | 0.04 | 0.55 | 0 | 0 | 0 |
| 3008 | Fe (%) | 40.74 | 0.97 | 40.74 | 0.97 | 0 | 0 | 0 |
| 3009 | Ag (g/t) | 90.82 | 1.49 | 90.82 | 1.49 | 0 | 0 | 0 |
| 3009 | Au (g/t) | 6.23 | 2.56 | 6.23 | 2.56 | 0 | 0 | 0 |
| 3009 | Pb (%) | 1.2 | 1.17 | 1.2 | 1.17 | 0 | 0 | 0 |
| 3009 | Zn (%) | 1.71 | 0.9 | 1.71 | 0.9 | 0 | 0 | 0 |
| 3009 | Cu (%) | 0.12 | 1.66 | 0.12 | 1.65 | 0 | 0.01 | 0 |
| 3009 | Fe (%) | 57.44 | 0.99 | 57.44 | 0.99 | 0 | 0 | 0 |
| 3010 | Ag (g/t) | 29.98 | 1.27 | 29.98 | 1.27 | 0 | 0 | 0 |
| 3010 | Au (g/t) | 2.12 | 1.01 | 2.12 | 1.01 | 0 | 0 | 0 |
| 3010 | Pb (%) | 0.5 | 1.09 | 0.5 | 1.09 | 0 | 0 | 0 |
| 3010 | Zn (%) | 0.61 | 0.94 | 0.61 | 0.94 | 0 | 0 | 0 |
| 3010 | Cu (%) | 0.1 | 1.63 | 0.1 | 1.63 | 0 | 0 | 0 |
| 3010 | Fe (%) | 18.53 | 0.77 | 18.53 | 0.77 | 0 | 0 | 0 |
| 3011 | Ag (g/t) | 20.77 | 0.66 | 20.77 | 0.66 | 0 | 0 | 0 |
| 3011 | Au (g/t) | 0.64 | 0.59 | 0.64 | 0.59 | 0 | 0 | 0 |
| 3011 | Pb (%) | 0.66 | 0.95 | 0.66 | 0.95 | 0 | 0 | 0 |
| 3011 | Zn (%) | 2.56 | 0.74 | 2.55 | 0.74 | -0.01 | -0.01 | 0 |
| 3011 | Cu (%) | 0.03 | 0.77 | 0.03 | 0.76 | 0 | 0.01 | -0.01 |
| 3011 | Fe (%) | 17.48 | 0.77 | 16.37 | 0.67 | -1.1 | -0.06 | -0.1 |
| 3100 | Ag (g/t) | 13.19 | 0.73 | 13.19 | 0.73 | 0 | 0 | 0 |
| 3100 | Au (g/t) | 0.11 | 0.34 | 0.11 | 0.34 | 0 | 0 | 0 |
| 3100 | Pb (%) | 0.48 | 0.75 | 0.48 | 0.75 | 0 | 0 | 0 |
| 3100 | Zn (%) | 3.46 | 0.89 | 3.34 | 0.89 | -0.13 | -0.04 | 0 |
| 3100 | Cu (%) | 0.01 | 0.52 | 0.01 | 0.59 | 0 | 0.17 | 0.07 |
| 3100 | Fe (%) | 4.96 | 0.67 | 4.96 | 0.67 | 0 | 0 | 0 |
| 3101 | Ag (g/t) | 58.14 | 1.34 | 54.41 | 1.14 | -3.73 | -0.06 | -0.2 |
| 3101 | Au (g/t) | 2.26 | 1.31 | 2.18 | 1.2 | -0.08 | -0.04 | -0.1 |
| 3101 | Pb (%) | 0.64 | 1.66 | 0.61 | 1.57 | -0.02 | -0.03 | -0.08 |
| 3101 | Zn (%) | 1.58 | 1.32 | 1.49 | 1.19 | -0.09 | -0.06 | -0.13 |
| 3101 | Cu (%) | 0.14 | 1.99 | 0.12 | 1.63 | -0.01 | -0.11 | -0.36 |
| 3101 | Fe (%) | 30.86 | 1.08 | 30.86 | 1.08 | 0 | 0 | 0 |
| 3102 | Ag (g/t) | 107.27 | 1.43 | 99.83 | 1.32 | -7.43 | -0.07 | -0.11 |
| 3102 | Au (g/t) | 1.94 | 1.07 | 1.94 | 1.07 | 0 | 0 | 0 |
| 3102 | Pb (%) | 1.06 | 1.57 | 1.06 | 1.57 | 0 | 0 | 0 |
| 3102 | Zn (%) | 1.91 | 1.24 | 1.9 | 1.23 | -0.01 | 0 | -0.01 |
| 3102 | Cu (%) | 0.11 | 1.24 | 0.11 | 1.24 | 0 | 0 | 0 |
| 3102 | Fe (%) | 31.26 | 0.75 | 31.26 | 0.75 | 0 | 0 | 0 |
| 3103 | Ag (g/t) | 59.16 | 1.56 | 52.54 | 1.34 | -6.62 | -0.11 | -0.21 |
| 3103 | Au (g/t) | 3.32 | 1.53 | 2.56 | 1.33 | -0.77 | -0.23 | -0.2 |
| 3103 | Pb (%) | 0.35 | 0.86 | 0.35 | 0.86 | 0 | 0 | 0 |
| 3103 | Zn (%) | 1.28 | 1.89 | 0.84 | 0.88 | -0.44 | -0.34 | -1.02 |
| 3103 | Cu (%) | 0.18 | 2.35 | 0.16 | 2.2 | -0.02 | -0.14 | -0.16 |
| 3103 | Fe (%) | 34.74 | 1.2 | 34.74 | 1.2 | 0 | 0 | 0 |
| 3121 | Ag (g/t) | 32.97 | 0.8 | 32.97 | 0.8 | 0 | 0 | 0 |
| 3121 | Au (g/t) | 1.64 | 1.55 | 1.64 | 1.55 | 0 | 0 | 0 |
| 3121 | Pb (%) | 0.36 | 0.96 | 0.36 | 0.96 | 0 | 0 | 0 |
| 3121 | Zn (%) | 0.87 | 0.95 | 0.87 | 0.95 | 0 | 0 | 0 |
| 3121 | Cu (%) | 0.11 | 1.33 | 0.11 | 1.33 | 0 | 0 | -0.01 |
| 3121 | Fe (%) | 25.84 | 1.17 | 25.05 | 1.11 | -0.79 | -0.03 | -0.05 |
| 3191 | Ag (g/t) | 74.14 | 1.43 | 74.14 | 1.43 | 0 | 0 | 0 |
AYA GOLD & SILVER INC., BOUMADINE POLYMETALLIC PROJECT 460
| | | | | | | | | | | | | | | | | | | | | | | | | | |
| 3191 | Au (g/t) | 3.79 | 1.49 | 3.79 | 1.49 | 0 | 0 | 0 |
| 3191 | Pb (%) | 0.54 | 1.38 | 0.54 | 1.38 | 0 | 0 | 0 |
| 3191 | Zn (%) | 1.97 | 1.65 | 1.97 | 1.65 | 0 | 0 | 0 |
| 3191 | Cu (%) | 0.15 | 1.93 | 0.15 | 1.93 | 0 | 0 | -0.01 |
| 3191 | Fe (%) | 35.56 | 1.1 | 35.56 | 1.1 | 0 | 0 | 0 |
| 3192 | Ag (g/t) | 65.74 | 1.15 | 65.74 | 1.15 | 0 | 0 | 0 |
| 3192 | Au (g/t) | 2.24 | 0.95 | 2.24 | 0.95 | 0 | 0 | 0 |
| 3192 | Pb (%) | 0.59 | 1.55 | 0.59 | 1.55 | 0 | 0 | 0 |
| 3192 | Zn (%) | 1.57 | 0.96 | 1.57 | 0.96 | 0 | 0 | 0 |
| 3192 | Cu (%) | 0.11 | 1.34 | 0.11 | 1.34 | 0 | 0 | 0 |
| 3192 | Fe (%) | 31.29 | 0.63 | 31.29 | 0.63 | 0 | 0 | 0 |
| 3193 | Ag (g/t) | 35.42 | 1.39 | 35.42 | 1.39 | 0 | 0 | 0 |
| 3193 | Au (g/t) | 2.38 | 2.27 | 2.38 | 2.27 | 0 | 0 | 0 |
| 3193 | Pb (%) | 0.34 | 0.81 | 0.34 | 0.81 | 0 | 0 | 0 |
| 3193 | Zn (%) | 1 | 1.02 | 1 | 1.02 | 0 | 0 | 0 |
| 3193 | Cu (%) | 0.05 | 1.19 | 0.05 | 1.18 | 0 | 0.01 | -0.01 |
| 3193 | Fe (%) | 24.02 | 1.08 | 24.02 | 1.08 | 0 | 0 | 0 |
| 3204 | Ag (g/t) | 41.23 | 0.82 | 41.23 | 0.82 | 0 | 0 | 0 |
| 3204 | Au (g/t) | 1.18 | 1.06 | 1.18 | 1.06 | 0 | 0 | 0 |
| 3204 | Pb (%) | 0.36 | 1.36 | 0.36 | 1.36 | 0 | 0 | 0 |
| 3204 | Zn (%) | 1.01 | 1.56 | 1.01 | 1.56 | 0 | 0 | 0 |
| 3204 | Cu (%) | 0.07 | 1.79 | 0.07 | 1.78 | 0 | 0.01 | -0.01 |
| 3204 | Fe (%) | 18.04 | 0.82 | 18.04 | 0.82 | 0 | 0 | 0 |
| 3205 | Ag (g/t) | 34.21 | 2.66 | 34.21 | 2.66 | 0 | 0 | 0 |
| 3205 | Au (g/t) | 0.23 | 1.2 | 0.23 | 1.2 | 0 | 0 | 0 |
| 3205 | Pb (%) | 0.31 | 1.04 | 0.31 | 1.04 | 0 | 0 | 0 |
| 3205 | Zn (%) | 0.98 | 0.83 | 0.98 | 0.83 | 0 | 0 | 0 |
| 3205 | Cu (%) | 0.03 | 0.83 | 0.03 | 0.83 | 0 | 0.01 | 0 |
| 3205 | Fe (%) | 13.45 | 0.82 | 13.45 | 0.82 | 0 | 0 | 0 |
| 3206 | Ag (g/t) | 32.28 | 1.01 | 32.28 | 1.01 | 0 | 0 | 0 |
| 3206 | Au (g/t) | 1.03 | 1.12 | 1.03 | 1.12 | 0 | 0 | 0 |
| 3206 | Pb (%) | 0.49 | 1.34 | 0.49 | 1.34 | 0 | 0 | 0 |
| 3206 | Zn (%) | 1.73 | 1.5 | 1.73 | 1.5 | 0 | 0 | 0 |
| 3206 | Cu (%) | 0.07 | 0.99 | 0.07 | 1 | 0 | 0.01 | 0.01 |
| 3206 | Fe (%) | 23.73 | 0.74 | 23.73 | 0.74 | 0 | 0 | 0 |
| 3207 | Ag (g/t) | 10.94 | 0.44 | 10.94 | 0.44 | 0 | 0 | 0 |
| 3207 | Au (g/t) | 0.59 | 1 | 0.59 | 1 | 0 | 0 | 0 |
| 3207 | Pb (%) | 0.22 | 1.31 | 0.22 | 1.31 | 0 | 0 | 0 |
| 3207 | Zn (%) | 0.45 | 1.05 | 0.45 | 1.05 | 0 | 0 | 0 |
| 3207 | Cu (%) | 0.05 | 0.88 | 0.05 | 0.88 | 0 | 0 | 0 |
| 3207 | Fe (%) | 15.13 | 0.53 | 15.13 | 0.53 | 0 | 0 | 0 |
| 3222 | Ag (g/t) | 20.1 | 1.2 | 20.1 | 1.2 | 0 | 0 | 0 |
| 3222 | Au (g/t) | 0.62 | 2.99 | 0.54 | 2.8 | -0.08 | -0.13 | -0.19 |
| 3222 | Pb (%) | 0.57 | 1.53 | 0.57 | 1.53 | 0 | 0 | 0 |
| 3222 | Zn (%) | 1.16 | 1.12 | 1.16 | 1.12 | 0 | 0 | 0 |
| 3222 | Cu (%) | 0.07 | 1.8 | 0.07 | 1.8 | 0 | 0 | 0 |
| 3222 | Fe (%) | 11.72 | 1.13 | 11.72 | 1.13 | 0 | 0 | 0 |
| 3223 | Ag (g/t) | 31.2 | 1.36 | 31.2 | 1.36 | 0 | 0 | 0 |
| 3223 | Au (g/t) | 1.03 | 1.74 | 1.03 | 1.74 | 0 | 0 | 0 |
| 3223 | Pb (%) | 1.33 | 1.56 | 1.33 | 1.56 | 0 | 0 | 0 |
| 3223 | Zn (%) | 2.4 | 1.57 | 2.38 | 1.56 | -0.01 | -0.01 | 0 |
AYA GOLD & SILVER INC., BOUMADINE POLYMETALLIC PROJECT 461
| | | | | | | | | | | | | | | | | | | | | | | | | | |
| 3223 | Cu (%) | 0.07 | 2.04 | 0.07 | 2.02 | 0 | 0.01 | -0.02 |
| 3223 | Fe (%) | 18 | 1.1 | 18 | 1.1 | 0 | 0 | 0 |
| 3224 | Ag (g/t) | 20.79 | 1.25 | 17.74 | 0.92 | -3.05 | -0.15 | -0.33 |
| 3224 | Au (g/t) | 0.37 | 1.68 | 0.37 | 1.68 | 0 | 0 | 0 |
| 3224 | Pb (%) | 0.43 | 1.02 | 0.43 | 1.02 | 0 | 0 | 0 |
| 3224 | Zn (%) | 1.08 | 0.77 | 1.08 | 0.77 | 0 | 0 | 0 |
| 3224 | Cu (%) | 0.1 | 2.39 | 0.1 | 2.39 | 0 | 0 | 0 |
| 3224 | Fe (%) | 11.04 | 0.38 | 11.04 | 0.38 | 0 | 0 | 0 |
| 3225 | Ag (g/t) | 51.64 | 0.61 | 51.64 | 0.61 | 0 | 0 | 0 |
| 3225 | Au (g/t) | 2.2 | 0.84 | 2.2 | 0.84 | 0 | 0 | 0 |
| 3225 | Pb (%) | 3.52 | 0.85 | 3.52 | 0.85 | 0 | 0 | 0 |
| 3225 | Zn (%) | 2.44 | 0.54 | 2.44 | 0.54 | 0 | 0 | 0 |
| 3225 | Cu (%) | 0.29 | 0.6 | 0.29 | 0.6 | 0 | 0 | 0 |
| 3225 | Fe (%) | 30.78 | 0.56 | 30.78 | 0.56 | 0 | 0 | 0 |
| 3226 | Ag (g/t) | 29.25 | 1.6 | 29.25 | 1.6 | 0 | 0 | 0 |
| 3226 | Au (g/t) | 0.69 | 1.9 | 0.62 | 1.75 | -0.07 | -0.1 | -0.15 |
| 3226 | Pb (%) | 0.96 | 1.09 | 0.96 | 1.09 | 0 | 0 | 0 |
| 3226 | Zn (%) | 1.87 | 1.56 | 1.82 | 1.58 | -0.05 | -0.03 | 0.01 |
| 3226 | Cu (%) | 0.11 | 1.5 | 0.11 | 1.5 | 0 | 0 | 0 |
| 3226 | Fe (%) | 16.46 | 1.48 | 16.46 | 1.48 | 0 | 0 | 0 |
| 3227 | Ag (g/t) | 59.16 | 0.87 | 59.16 | 0.87 | 0 | 0 | 0 |
| 3227 | Au (g/t) | 1.74 | 0.96 | 1.74 | 0.96 | 0 | 0 | 0 |
| 3227 | Pb (%) | 0.62 | 1.35 | 0.62 | 1.35 | 0 | 0 | 0 |
| 3227 | Zn (%) | 1.72 | 1.05 | 1.72 | 1.05 | 0 | 0 | 0 |
| 3227 | Cu (%) | 0.09 | 0.98 | 0.09 | 0.97 | 0 | 0.01 | -0.01 |
| 3227 | Fe (%) | 21.58 | 0.54 | 21.58 | 0.54 | 0 | 0 | 0 |
| 3230 | Ag (g/t) | 114.03 | 1.07 | 63.05 | 0.8 | -50.98 | -0.45 | -0.28 |
| 3230 | Au (g/t) | 0.79 | 0.73 | 0.79 | 0.73 | 0 | 0 | 0 |
| 3230 | Pb (%) | 1.33 | 0.24 | 1.33 | 0.24 | 0 | 0 | 0 |
| 3230 | Zn (%) | 1.84 | 0.39 | 1.84 | 0.39 | 0 | 0 | 0 |
| 3230 | Cu (%) | 0.05 | 0.15 | 0.05 | 0.13 | 0 | 0.03 | -0.03 |
| 3230 | Fe (%) | 17.46 | 0.18 | 17.46 | 0.18 | 0 | 0 | 0 |
| 3291 | Ag (g/t) | 104.12 | 1.22 | 103.52 | 1.21 | -0.6 | -0.01 | -0.01 |
| 3291 | Au (g/t) | 2.49 | 1.63 | 2.28 | 1.23 | -0.21 | -0.09 | -0.39 |
| 3291 | Pb (%) | 1.55 | 1.61 | 1.47 | 1.46 | -0.08 | -0.05 | -0.15 |
| 3291 | Zn (%) | 2.9 | 1.55 | 2.68 | 1.29 | -0.22 | -0.07 | -0.26 |
| 3291 | Cu (%) | 0.13 | 1.48 | 0.13 | 1.24 | -0.01 | -0.05 | -0.25 |
| 3291 | Fe (%) | 43.74 | 0.86 | 42.7 | 0.81 | -1.04 | -0.02 | -0.04 |
| 3292 | Ag (g/t) | 56.92 | 0.95 | 56.92 | 0.95 | 0 | 0 | 0 |
| 3292 | Au (g/t) | 1.86 | 1.1 | 1.75 | 0.98 | -0.11 | -0.06 | -0.13 |
| 3292 | Pb (%) | 0.81 | 1.32 | 0.72 | 1.1 | -0.09 | -0.11 | -0.22 |
| 3292 | Zn (%) | 2.02 | 1.04 | 2.02 | 1.04 | 0 | 0 | 0 |
| 3292 | Cu (%) | 0.09 | 1.01 | 0.08 | 0.85 | -0.01 | -0.06 | -0.15 |
| 3292 | Fe (%) | 36.06 | 0.78 | 36.06 | 0.78 | 0 | 0 | 0 |
| 3293 | Ag (g/t) | 31.54 | 1.05 | 31.54 | 1.05 | 0 | 0 | 0 |
| 3293 | Au (g/t) | 0.71 | 1.11 | 0.71 | 1.11 | 0 | 0 | 0 |
| 3293 | Pb (%) | 0.75 | 1.21 | 0.75 | 1.21 | 0 | 0 | 0 |
| 3293 | Zn (%) | 1.46 | 0.95 | 1.46 | 0.95 | 0 | 0 | 0 |
| 3293 | Cu (%) | 0.05 | 1.25 | 0.05 | 1.25 | 0 | 0.01 | -0.01 |
| 3293 | Fe (%) | 21.76 | 0.63 | 21.76 | 0.63 | 0 | 0 | 0 |
| 3294 | Ag (g/t) | 90.46 | 0.94 | 90.46 | 0.94 | 0 | 0 | 0 |
AYA GOLD & SILVER INC., BOUMADINE POLYMETALLIC PROJECT 462
| | | | | | | | | | | | | | | | | | | | | | | | | | |
| 3294 | Au (g/t) | 3.81 | 1.21 | 3.81 | 1.21 | 0 | 0 | 0 |
| 3294 | Pb (%) | 0.11 | 0.65 | 0.11 | 0.65 | 0 | 0 | 0 |
| 3294 | Zn (%) | 0.49 | 1.24 | 0.49 | 1.24 | 0 | 0 | 0 |
| 3294 | Cu (%) | 0.13 | 0.5 | 0.13 | 0.5 | 0 | 0 | 0 |
| 3294 | Fe (%) | 80.77 | 0.88 | 48.25 | 0.62 | -32.51 | -0.4 | -0.26 |
| 3295 | Ag (g/t) | 38.4 | 1.29 | 38.4 | 1.29 | 0 | 0 | 0 |
| 3295 | Au (g/t) | 0.38 | 1.09 | 0.38 | 1.09 | 0 | 0 | 0 |
| 3295 | Pb (%) | 0.78 | 1.35 | 0.78 | 1.35 | 0 | 0 | 0 |
| 3295 | Zn (%) | 1.47 | 1.19 | 1.47 | 1.19 | 0 | 0 | 0 |
| 3295 | Cu (%) | 0.1 | 1.77 | 0.1 | 1.77 | 0 | 0 | 0 |
| 3295 | Fe (%) | 23.8 | 1.69 | 22.55 | 1.49 | -1.25 | -0.05 | -0.2 |
| 3301 | Ag (g/t) | 234.86 | 4.14 | 130.84 | 2.14 | - 104.02 | -0.44 | -2 |
| 3301 | Au (g/t) | 1.3 | 1.49 | 1.2 | 1.36 | -0.1 | -0.08 | -0.12 |
| 3301 | Pb (%) | 0.95 | 1.35 | 0.92 | 1.28 | -0.03 | -0.03 | -0.07 |
| 3301 | Zn (%) | 1.7 | 1.26 | 1.7 | 1.26 | 0 | 0 | 0 |
| 3301 | Cu (%) | 0.2 | 1.96 | 0.19 | 1.78 | -0.01 | -0.06 | -0.18 |
| 3301 | Fe (%) | 28.04 | 0.96 | 26.62 | 0.84 | -1.42 | -0.05 | -0.12 |
| 3402 | Ag (g/t) | 13.83 | 0.35 | 13.83 | 0.35 | 0 | 0 | 0 |
| 3402 | Au (g/t) | 0.41 | 0.89 | 0.41 | 0.89 | 0 | 0 | 0 |
| 3402 | Pb (%) | 0.24 | 0.98 | 0.24 | 0.98 | 0 | 0 | 0 |
| 3402 | Zn (%) | 0.7 | 0.8 | 0.7 | 0.8 | 0 | 0 | 0 |
| 3402 | Cu (%) | 0.03 | 0.44 | 0.03 | 0.43 | 0 | 0.01 | -0.01 |
| 3402 | Fe (%) | 16.67 | 0.63 | 16.67 | 0.63 | 0 | 0 | 0 |
| 3409 | Ag (g/t) | 22.22 | 0.91 | 22.22 | 0.91 | 0 | 0 | 0 |
| 3409 | Au (g/t) | 1.03 | 0.77 | 1.03 | 0.77 | 0 | 0 | 0 |
| 3409 | Pb (%) | 0.42 | 1.25 | 0.42 | 1.25 | 0 | 0 | 0 |
| 3409 | Zn (%) | 1.4 | 0.99 | 1.4 | 0.99 | 0 | 0 | 0 |
| 3409 | Cu (%) | 0.02 | 1.17 | 0.02 | 1.19 | 0 | 0.01 | 0.02 |
| 3409 | Fe (%) | 11.68 | 0.76 | 11.68 | 0.76 | 0 | 0 | 0 |
| 3410 | Ag (g/t) | 11.81 | 0.98 | 11.81 | 0.98 | 0 | 0 | 0 |
| 3410 | Au (g/t) | 0.64 | 1.49 | 0.64 | 1.49 | 0 | 0 | 0 |
| 3410 | Pb (%) | 0.1 | 0.71 | 0.1 | 0.71 | 0 | 0 | 0 |
| 3410 | Zn (%) | 0.73 | 0.96 | 0.73 | 0.96 | 0 | 0 | 0 |
| 3410 | Cu (%) | 0.02 | 0.56 | 0.02 | 0.56 | 0 | 0.01 | 0.01 |
| 3410 | Fe (%) | 14.16 | 0.93 | 14.16 | 0.93 | 0 | 0 | 0 |
| 3411 | Ag (g/t) | 28.72 | 0.73 | 28.72 | 0.73 | 0 | 0 | 0 |
| 3411 | Au (g/t) | 1.24 | 0.87 | 1.2 | 0.82 | -0.04 | -0.03 | -0.05 |
| 3411 | Pb (%) | 1 | 0.82 | 1 | 0.82 | 0 | 0 | 0 |
| 3411 | Zn (%) | 2.46 | 0.9 | 2.46 | 0.9 | 0 | 0 | 0 |
| 3411 | Cu (%) | 0.05 | 0.97 | 0.05 | 0.96 | 0 | 0.01 | -0.01 |
| 3411 | Fe (%) | 22.58 | 0.73 | 22.58 | 0.73 | 0 | 0 | 0 |
| 3508 | Ag (g/t) | 22.47 | 0.77 | 22.47 | 0.77 | 0 | 0 | 0 |
| 3508 | Au (g/t) | 0.87 | 0.69 | 0.87 | 0.69 | 0 | 0 | 0 |
| 3508 | Pb (%) | 0.63 | 0.97 | 0.63 | 0.97 | 0 | 0 | 0 |
| 3508 | Zn (%) | 1.68 | 0.84 | 1.63 | 0.8 | -0.05 | -0.03 | -0.04 |
| 3508 | Cu (%) | 0.02 | 0.47 | 0.02 | 0.48 | 0 | 0.02 | 0.01 |
| 3508 | Fe (%) | 16.79 | 0.5 | 16.79 | 0.5 | 0 | 0 | 0 |
| 3600 | Ag (g/t) | 30.37 | 0.72 | 29.73 | 0.72 | -0.64 | -0.02 | 0 |
| 3600 | Au (g/t) | 0.72 | 0.97 | 0.72 | 0.98 | 0 | 0 | 0 |
| 3600 | Pb (%) | 0.88 | 0.95 | 0.88 | 0.95 | 0 | 0 | 0 |
| 3600 | Zn (%) | 2.59 | 0.96 | 2.59 | 0.96 | 0 | 0 | 0 |
AYA GOLD & SILVER INC., BOUMADINE POLYMETALLIC PROJECT 463
| | | | | | | | | | | | | | | | | | | | | | | | | | |
| 3600 | Cu (%) | 0.04 | 1.48 | 0.04 | 1.47 | 0 | 0.01 | -0.02 |
| 3600 | Fe (%) | 16.08 | 0.84 | 16.08 | 0.84 | 0 | 0 | 0 |
| 4001 | Ag (g/t) | 924.75 | 1.19 | 722.7 | 1.12 | - 202.05 | -0.22 | -0.06 |
| 4001 | Au (g/t) | 0.07 | 0.59 | 0.07 | 0.59 | 0 | 0 | 0 |
| 4001 | Pb (%) | 0.21 | 0.78 | 0.21 | 0.78 | 0 | 0 | 0 |
| 4001 | Zn (%) | 0.16 | 0.57 | 0.16 | 0.57 | 0 | 0 | 0 |
| 4001 | Cu (%) | 2.92 | 0.22 | 2.92 | 0.22 | 0 | 0 | 0 |
| 4001 | Fe (%) | 6.94 | 0.44 | 6.94 | 0.44 | 0 | 0 | 0 |
| 4002 | Ag (g/t) | 39.79 | 1 | 39.79 | 1 | 0 | 0 | 0 |
| 4002 | Au (g/t) | 0.01 | 0.48 | 0.01 | 0.48 | 0 | 0 | 0 |
| 4002 | Pb (%) | 2.38 | 1.04 | 2.38 | 1.04 | 0 | 0 | 0 |
| 4002 | Zn (%) | 3.96 | 0.7 | 3.96 | 0.7 | 0 | 0 | 0 |
| 4002 | Cu (%) | 0.09 | 0.41 | 0.09 | 0.41 | 0 | 0 | 0 |
| 4002 | Fe (%) | 2.35 | 0.37 | 2.35 | 0.37 | 0 | 0 | 0 |
| 4003 | Ag (g/t) | 94.14 | 0.34 | 94.14 | 0.34 | 0 | 0 | 0 |
| 4003 | Au (g/t) | 0.07 | 0.06 | 0.07 | 0.06 | 0 | 0 | 0 |
| 4003 | Pb (%) | 4.52 | 0.26 | 4.52 | 0.26 | 0 | 0 | 0 |
| 4003 | Zn (%) | 23.75 | 0.83 | 23.75 | 0.83 | 0 | 0 | 0 |
| 4003 | Cu (%) | 0.3 | 0.03 | 0.3 | 0.03 | 0 | 0 | 0 |
| 4003 | Fe (%) | 3.84 | 0.7 | 3.84 | 0.7 | 0 | 0 | 0 |
AYA GOLD & SILVER INC., BOUMADINE POLYMETALLIC PROJECT 464
Appendix CSTATISTICAL VALIDATION _ CAPPED COMPOSITES VS BLOCK MODEL
Capped composites vs block model (back calculated assay grades)
| | | | | | | | | | | | | | | | | | | | |
| Domain | Assay | Composite Count | Composite Mean | Block Model Mean | Diff (BM - Composite) | % Diff vs Composite |
| 1003 | Ag | 9 | 25.006 | 43.452 | 18.446 | 0.738 |
| 1003 | Au | 9 | 0.842 | 0.65 | -0.192 | -0.228 |
| 1003 | Cu | 9 | 0.124 | 0.07 | -0.054 | -0.435 |
| 1003 | Fe | 9 | 15.167 | 21.307 | 6.141 | 0.405 |
| 1003 | Pb | 9 | 0.43 | 0.39 | -0.041 | -0.095 |
| 1003 | Zn | 9 | 1.087 | 1.65 | 0.563 | 0.518 |
| 1004 | Ag | 9 | 39.464 | 56.953 | 17.488 | 0.443 |
| 1004 | Au | 9 | 0.29 | 0.322 | 0.033 | 0.113 |
| 1004 | Cu | 9 | 0.043 | 0.035 | -0.008 | -0.179 |
| 1004 | Fe | 9 | 9.642 | 8.809 | -0.833 | -0.086 |
| 1004 | Pb | 9 | 1.156 | 1.174 | 0.018 | 0.016 |
| 1004 | Zn | 9 | 1.919 | 1.607 | -0.312 | -0.163 |
| 1005 | Ag | 4 | 72.631 | 82.245 | 9.614 | 0.132 |
| 1005 | Au | 4 | 0.579 | 0.584 | 0.005 | 0.009 |
| 1005 | Cu | 4 | 0.036 | 0.042 | 0.006 | 0.153 |
| 1005 | Fe | 4 | 11.318 | 11.652 | 0.335 | 0.03 |
| 1005 | Pb | 4 | 0.342 | 0.298 | -0.044 | -0.13 |
| 1005 | Zn | 4 | 1.494 | 1.083 | -0.411 | -0.275 |
| 1006 | Ag | 4 | 47.424 | 24.022 | -23.402 | -0.493 |
| 1006 | Au | 4 | 0.531 | 0.298 | -0.233 | -0.439 |
| 1006 | Cu | 4 | 0.026 | 0.018 | -0.008 | -0.304 |
| 1006 | Fe | 4 | 11.135 | 9.846 | -1.289 | -0.116 |
| 1006 | Pb | 4 | 0.7 | 0.356 | -0.344 | -0.492 |
| 1006 | Zn | 4 | 3.05 | 1.094 | -1.956 | -0.641 |
| 1007 | Ag | 5 | 190.479 | 117.16 | -73.319 | -0.385 |
| 1007 | Au | 5 | 0.489 | 0.434 | -0.055 | -0.113 |
| 1007 | Cu | 5 | 0.249 | 0.144 | -0.106 | -0.424 |
| 1007 | Fe | 5 | 10.196 | 9.15 | -1.046 | -0.103 |
| 1007 | Pb | 5 | 0.34 | 0.439 | 0.099 | 0.293 |
| 1007 | Zn | 5 | 2.006 | 1.845 | -0.16 | -0.08 |
| 1011 | Ag | 3 | 36.567 | 33.313 | -3.254 | -0.089 |
| 1011 | Au | 3 | 1.364 | 0.931 | -0.433 | -0.318 |
| 1011 | Cu | 3 | 0.032 | 0.021 | -0.011 | -0.352 |
| 1011 | Fe | 3 | 21.01 | 25.409 | 4.399 | 0.209 |
| 1011 | Pb | 3 | 0.329 | 0.274 | -0.055 | -0.166 |
| 1011 | Zn | 3 | 0.639 | 0.537 | -0.102 | -0.16 |
| 1012 | Ag | 2 | 63.015 | 68.283 | 5.268 | 0.084 |
| 1012 | Au | 2 | 0.533 | 0.607 | 0.074 | 0.139 |
| 1012 | Cu | 2 | 0.123 | 0.113 | -0.01 | -0.082 |
| 1012 | Fe | 2 | 11.265 | 12.505 | 1.241 | 0.11 |
| 1012 | Pb | 2 | 0.469 | 0.409 | -0.06 | -0.128 |
| 1012 | Zn | 2 | 0.837 | 0.708 | -0.129 | -0.154 |
| 1013 | Ag | 3 | 28.711 | 33.134 | 4.423 | 0.154 |
| 1013 | Au | 3 | 0.144 | 0.134 | -0.01 | -0.071 |
AYA GOLD & SILVER INC., BOUMADINE POLYMETALLIC PROJECT 465
| | | | | | | | | | | | | | | | | | | | |
| 1013 | Cu | 3 | 0.031 | 0.026 | -0.005 | -0.171 |
| 1013 | Fe | 3 | 15.41 | 20.177 | 4.767 | 0.309 |
| 1013 | Pb | 3 | 0.281 | 0.58 | 0.299 | 1.064 |
| 1013 | Zn | 3 | 0.586 | 1.277 | 0.692 | 1.18 |
| 1030 | Ag | 9 | 67.483 | 85.794 | 18.312 | 0.271 |
| 1030 | Au | 9 | 0.906 | 1.634 | 0.728 | 0.804 |
| 1030 | Cu | 9 | 0.093 | 0.158 | 0.065 | 0.696 |
| 1030 | Fe | 9 | 15.351 | 15.146 | -0.205 | -0.013 |
| 1030 | Pb | 9 | 1.051 | 1.08 | 0.029 | 0.027 |
| 1030 | Zn | 9 | 3.831 | 5.279 | 1.449 | 0.378 |
| 1031 | Ag | 31 | 79.26 | 61.836 | -17.424 | -0.22 |
| 1031 | Au | 31 | 0.586 | 1.21 | 0.624 | 1.064 |
| 1031 | Cu | 31 | 0.049 | 0.062 | 0.013 | 0.254 |
| 1031 | Fe | 31 | 13.762 | 19.455 | 5.693 | 0.414 |
| 1031 | Pb | 31 | 0.737 | 0.556 | -0.182 | -0.247 |
| 1031 | Zn | 31 | 1.666 | 2.035 | 0.369 | 0.222 |
| 1033 | Ag | 6 | 20.884 | 19.051 | -1.833 | -0.088 |
| 1033 | Au | 6 | 0.767 | 1.046 | 0.28 | 0.365 |
| 1033 | Cu | 6 | 0.035 | 0.023 | -0.012 | -0.342 |
| 1033 | Fe | 6 | 11.637 | 13.512 | 1.875 | 0.161 |
| 1033 | Pb | 6 | 0.34 | 0.218 | -0.122 | -0.359 |
| 1033 | Zn | 6 | 0.462 | 0.256 | -0.206 | -0.447 |
| 1040 | Ag | 11 | 48.208 | 36.631 | -11.577 | -0.24 |
| 1040 | Au | 11 | 1.05 | 1.282 | 0.232 | 0.22 |
| 1040 | Cu | 11 | 0.039 | 0.027 | -0.011 | -0.296 |
| 1040 | Fe | 11 | 12.626 | 12.015 | -0.611 | -0.048 |
| 1040 | Pb | 11 | 0.789 | 1.219 | 0.43 | 0.545 |
| 1040 | Zn | 11 | 1.24 | 2.325 | 1.084 | 0.874 |
| 1041 | Ag | 26 | 85.314 | 88.671 | 3.357 | 0.039 |
| 1041 | Au | 26 | 0.904 | 1.284 | 0.38 | 0.42 |
| 1041 | Cu | 26 | 0.03 | 0.032 | 0.002 | 0.053 |
| 1041 | Fe | 26 | 14.664 | 13.173 | -1.491 | -0.102 |
| 1041 | Pb | 26 | 1.332 | 1.354 | 0.022 | 0.017 |
| 1041 | Zn | 26 | 2.153 | 2.05 | -0.102 | -0.048 |
| 1050 | Ag | 11 | 23.867 | 35.727 | 11.859 | 0.497 |
| 1050 | Au | 11 | 1.132 | 2.034 | 0.903 | 0.798 |
| 1050 | Cu | 11 | 0.368 | 0.123 | -0.245 | -0.667 |
| 1050 | Fe | 11 | 11.143 | 18.397 | 7.253 | 0.651 |
| 1050 | Pb | 11 | 0.363 | 0.49 | 0.127 | 0.351 |
| 1050 | Zn | 11 | 1.175 | 1.284 | 0.109 | 0.093 |
| 1051 | Ag | 2 | 67.605 | 77.187 | 9.582 | 0.142 |
| 1051 | Au | 2 | 0.845 | 0.736 | -0.109 | -0.129 |
| 1051 | Cu | 2 | 0.03 | 0.034 | 0.004 | 0.122 |
| 1051 | Fe | 2 | 9.998 | 8.919 | -1.079 | -0.108 |
| 1051 | Pb | 2 | 0.271 | 0.301 | 0.03 | 0.109 |
| 1051 | Zn | 2 | 0.085 | 0.103 | 0.018 | 0.213 |
| 1052 | Ag | 31 | 46.61 | 50.742 | 4.132 | 0.089 |
| 1052 | Au | 31 | 0.992 | 0.502 | -0.489 | -0.493 |
| 1052 | Cu | 31 | 0.14 | 0.115 | -0.025 | -0.179 |
| 1052 | Fe | 31 | 13.861 | 14.403 | 0.542 | 0.039 |
| 1052 | Pb | 31 | 0.809 | 0.279 | -0.53 | -0.655 |
AYA GOLD & SILVER INC., BOUMADINE POLYMETALLIC PROJECT 466
| | | | | | | | | | | | | | | | | | | | |
| 1052 | Zn | 31 | 0.877 | 0.579 | -0.298 | -0.34 |
| 1053 | Ag | 6 | 51.842 | 28.546 | -23.296 | -0.449 |
| 1053 | Au | 6 | 0.823 | 0.65 | -0.173 | -0.211 |
| 1053 | Cu | 6 | 0.068 | 0.053 | -0.015 | -0.216 |
| 1053 | Fe | 6 | 12.348 | 10.279 | -2.069 | -0.168 |
| 1053 | Pb | 6 | 1.039 | 0.462 | -0.577 | -0.555 |
| 1053 | Zn | 6 | 3.246 | 1.251 | -1.995 | -0.615 |
| 1054 | Ag | 7 | 21.778 | 18.616 | -3.162 | -0.145 |
| 1054 | Au | 7 | 0.04 | 0.043 | 0.004 | 0.092 |
| 1054 | Cu | 7 | 0.459 | 0.194 | -0.265 | -0.577 |
| 1054 | Fe | 7 | 5.623 | 8.377 | 2.754 | 0.49 |
| 1054 | Pb | 7 | 0.654 | 0.808 | 0.154 | 0.235 |
| 1054 | Zn | 7 | 0.846 | 2.037 | 1.191 | 1.408 |
| 1055 | Ag | 2 | 202.533 | 189.429 | -13.104 | -0.065 |
| 1055 | Au | 2 | 0.479 | 0.463 | -0.016 | -0.034 |
| 1055 | Cu | 2 | 0.033 | 0.047 | 0.013 | 0.401 |
| 1055 | Fe | 2 | 13.436 | 12.766 | -0.67 | -0.05 |
| 1055 | Pb | 2 | 3.121 | 3.035 | -0.086 | -0.027 |
| 1055 | Zn | 2 | 2.363 | 2.911 | 0.549 | 0.232 |
| 1056 | Ag | 8 | 25.144 | 26.189 | 1.045 | 0.042 |
| 1056 | Au | 8 | 0.339 | 0.394 | 0.054 | 0.16 |
| 1056 | Cu | 8 | 0.468 | 0.247 | -0.221 | -0.472 |
| 1056 | Fe | 8 | 17.736 | 18.237 | 0.5 | 0.028 |
| 1056 | Pb | 8 | 0.369 | 0.364 | -0.004 | -0.012 |
| 1056 | Zn | 8 | 0.352 | 0.314 | -0.038 | -0.107 |
| 1061 | Ag | 2 | 50.719 | 56.54 | 5.82 | 0.115 |
| 1061 | Au | 2 | 0.236 | 0.292 | 0.055 | 0.234 |
| 1061 | Cu | 2 | 0.017 | 0.014 | -0.003 | -0.166 |
| 1061 | Fe | 2 | 12.097 | 12.849 | 0.752 | 0.062 |
| 1061 | Pb | 2 | 1.84 | 1.243 | -0.597 | -0.324 |
| 1061 | Zn | 2 | 4.754 | 2.926 | -1.828 | -0.385 |
| 1062 | Ag | 3 | 2.318 | 4.426 | 2.108 | 0.909 |
| 1062 | Au | 3 | 0.023 | 0.012 | -0.012 | -0.507 |
| 1062 | Cu | 3 | 0.162 | 0.04 | -0.121 | -0.751 |
| 1062 | Fe | 3 | 6.15 | 3.042 | -3.107 | -0.505 |
| 1062 | Pb | 3 | 0.402 | 1.043 | 0.641 | 1.597 |
| 1062 | Zn | 3 | 0.765 | 2 | 1.235 | 1.614 |
| 1063 | Ag | 2 | 1.651 | 2.041 | 0.39 | 0.236 |
| 1063 | Au | 2 | 9.18 | 4.783 | -4.397 | -0.479 |
| 1063 | Cu | 2 | 0.01 | 0.01 | 0 | 0.024 |
| 1063 | Fe | 2 | 17.472 | 29.482 | 12.01 | 0.687 |
| 1063 | Pb | 2 | 0.012 | 0.013 | 0.001 | 0.114 |
| 1063 | Zn | 2 | 0.016 | 0.022 | 0.007 | 0.419 |
| 1090 | Ag | 44 | 76.29 | 65.609 | -10.681 | -0.14 |
| 1090 | Au | 44 | 1.381 | 1.483 | 0.101 | 0.073 |
| 1090 | Cu | 44 | 0.089 | 0.073 | -0.016 | -0.176 |
| 1090 | Fe | 44 | 16.092 | 17.873 | 1.781 | 0.111 |
| 1090 | Pb | 44 | 0.697 | 0.691 | -0.005 | -0.007 |
| 1090 | Zn | 44 | 2.463 | 2.202 | -0.261 | -0.106 |
| 1091 | Ag | 62 | 180.145 | 158.283 | -21.862 | -0.121 |
| 1091 | Au | 62 | 0.684 | 0.694 | 0.01 | 0.014 |
AYA GOLD & SILVER INC., BOUMADINE POLYMETALLIC PROJECT 467
| | | | | | | | | | | | | | | | | | | | |
| 1091 | Cu | 62 | 0.097 | 0.067 | -0.03 | -0.313 |
| 1091 | Fe | 62 | 14.611 | 14.8 | 0.189 | 0.013 |
| 1091 | Pb | 62 | 1.249 | 1.116 | -0.133 | -0.106 |
| 1091 | Zn | 62 | 2.022 | 1.789 | -0.233 | -0.115 |
| 1092 | Ag | 42 | 27.059 | 33.562 | 6.504 | 0.24 |
| 1092 | Au | 42 | 1.475 | 1.477 | 0.001 | 0.001 |
| 1092 | Cu | 42 | 0.088 | 0.114 | 0.026 | 0.29 |
| 1092 | Fe | 42 | 14.605 | 15.414 | 0.809 | 0.055 |
| 1092 | Pb | 42 | 0.474 | 0.442 | -0.032 | -0.067 |
| 1092 | Zn | 42 | 1.039 | 1.016 | -0.023 | -0.023 |
| 1093 | Ag | 9 | 71.142 | 152.319 | 81.176 | 1.141 |
| 1093 | Au | 9 | 1.37 | 1.806 | 0.436 | 0.318 |
| 1093 | Cu | 9 | 0.095 | 0.134 | 0.039 | 0.405 |
| 1093 | Fe | 9 | 15.417 | 16.04 | 0.624 | 0.04 |
| 1093 | Pb | 9 | 0.566 | 0.507 | -0.059 | -0.105 |
| 1093 | Zn | 9 | 1.259 | 1.605 | 0.346 | 0.275 |
| 1094 | Ag | 11 | 61.518 | 28.85 | -32.668 | -0.531 |
| 1094 | Au | 11 | 1.533 | 1.829 | 0.296 | 0.193 |
| 1094 | Cu | 11 | 0.059 | 0.057 | -0.001 | -0.022 |
| 1094 | Fe | 11 | 15.294 | 14.582 | -0.712 | -0.047 |
| 1094 | Pb | 11 | 0.855 | 0.313 | -0.542 | -0.634 |
| 1094 | Zn | 11 | 0.526 | 0.46 | -0.066 | -0.126 |
| 1201 | Ag | 17 | 138.451 | 311.071 | 172.62 | 1.247 |
| 1201 | Au | 17 | 0.913 | 1.356 | 0.443 | 0.485 |
| 1201 | Cu | 17 | 0.039 | 0.042 | 0.003 | 0.074 |
| 1201 | Fe | 17 | 14.604 | 17.245 | 2.64 | 0.181 |
| 1201 | Pb | 17 | 1.437 | 2.843 | 1.406 | 0.979 |
| 1201 | Zn | 17 | 2.201 | 2.895 | 0.694 | 0.315 |
| 1202 | Ag | 15 | 44.071 | 100.007 | 55.937 | 1.269 |
| 1202 | Au | 15 | 0.517 | 1.352 | 0.835 | 1.614 |
| 1202 | Cu | 15 | 0.115 | 0.025 | -0.09 | -0.785 |
| 1202 | Fe | 15 | 11.9 | 10.482 | -1.418 | -0.119 |
| 1202 | Pb | 15 | 1.009 | 0.97 | -0.039 | -0.038 |
| 1202 | Zn | 15 | 1.56 | 1.953 | 0.393 | 0.252 |
| 1203 | Ag | 15 | 35.376 | 58.295 | 22.919 | 0.648 |
| 1203 | Au | 15 | 0.487 | 1.264 | 0.777 | 1.596 |
| 1203 | Cu | 15 | 0.024 | 0.028 | 0.004 | 0.174 |
| 1203 | Fe | 15 | 10.587 | 12.753 | 2.166 | 0.205 |
| 1203 | Pb | 15 | 0.7 | 0.978 | 0.277 | 0.396 |
| 1203 | Zn | 15 | 1.739 | 2.279 | 0.54 | 0.311 |
| 1208 | Ag | 4 | 25.537 | 28.351 | 2.814 | 0.11 |
| 1208 | Au | 4 | 0.863 | 0.768 | -0.095 | -0.11 |
| 1208 | Cu | 4 | 0.086 | 0.057 | -0.029 | -0.34 |
| 1208 | Fe | 4 | 16.077 | 16.362 | 0.285 | 0.018 |
| 1208 | Pb | 4 | 0.252 | 0.186 | -0.066 | -0.261 |
| 1208 | Zn | 4 | 0.239 | 0.174 | -0.065 | -0.272 |
| 1209 | Ag | 6 | 15.177 | 16.39 | 1.213 | 0.08 |
| 1209 | Au | 6 | 0.303 | 0.44 | 0.137 | 0.451 |
| 1209 | Cu | 6 | 0.173 | 0.117 | -0.056 | -0.323 |
| 1209 | Fe | 6 | 6.489 | 5.943 | -0.546 | -0.084 |
| 1209 | Pb | 6 | 0.27 | 0.278 | 0.008 | 0.029 |
AYA GOLD & SILVER INC., BOUMADINE POLYMETALLIC PROJECT 468
| | | | | | | | | | | | | | | | | | | | |
| 1209 | Zn | 6 | 1.143 | 1.076 | -0.067 | -0.059 |
| 1304 | Ag | 6 | 18.882 | 14.93 | -3.952 | -0.209 |
| 1304 | Au | 6 | 1.224 | 0.547 | -0.677 | -0.553 |
| 1304 | Cu | 6 | 0.055 | 0.034 | -0.021 | -0.377 |
| 1304 | Fe | 6 | 14.602 | 12.578 | -2.024 | -0.139 |
| 1304 | Pb | 6 | 0.634 | 0.762 | 0.129 | 0.203 |
| 1304 | Zn | 6 | 0.74 | 0.685 | -0.054 | -0.073 |
| 1305 | Ag | 29 | 25.308 | 26.546 | 1.238 | 0.049 |
| 1305 | Au | 29 | 1.142 | 0.997 | -0.145 | -0.127 |
| 1305 | Cu | 29 | 0.085 | 0.069 | -0.016 | -0.191 |
| 1305 | Fe | 29 | 18.845 | 17.485 | -1.36 | -0.072 |
| 1305 | Pb | 29 | 0.276 | 0.24 | -0.036 | -0.132 |
| 1305 | Zn | 29 | 0.758 | 0.493 | -0.265 | -0.35 |
| 1306 | Ag | 10 | 50.538 | 69.685 | 19.147 | 0.379 |
| 1306 | Au | 10 | 0.57 | 0.841 | 0.271 | 0.475 |
| 1306 | Cu | 10 | 0.057 | 0.071 | 0.014 | 0.242 |
| 1306 | Fe | 10 | 10.368 | 11.145 | 0.777 | 0.075 |
| 1306 | Pb | 10 | 0.574 | 0.342 | -0.231 | -0.403 |
| 1306 | Zn | 10 | 0.829 | 0.615 | -0.213 | -0.257 |
| 1310 | Ag | 18 | 23.585 | 18.649 | -4.936 | -0.209 |
| 1310 | Au | 18 | 1.045 | 1.118 | 0.073 | 0.07 |
| 1310 | Cu | 18 | 0.073 | 0.075 | 0.001 | 0.019 |
| 1310 | Fe | 18 | 14.076 | 17.07 | 2.994 | 0.213 |
| 1310 | Pb | 18 | 0.494 | 0.311 | -0.183 | -0.37 |
| 1310 | Zn | 18 | 1.86 | 0.68 | -1.18 | -0.634 |
| 1311 | Ag | 6 | 26.335 | 33.47 | 7.135 | 0.271 |
| 1311 | Au | 6 | 0.568 | 1.1 | 0.532 | 0.938 |
| 1311 | Cu | 6 | 0.068 | 0.079 | 0.01 | 0.149 |
| 1311 | Fe | 6 | 20.791 | 23.431 | 2.64 | 0.127 |
| 1311 | Pb | 6 | 0.117 | 0.083 | -0.034 | -0.292 |
| 1311 | Zn | 6 | 0.423 | 0.319 | -0.104 | -0.245 |
| 1312 | Ag | 13 | 22.733 | 15.166 | -7.567 | -0.333 |
| 1312 | Au | 13 | 0.349 | 0.41 | 0.061 | 0.174 |
| 1312 | Cu | 13 | 0.043 | 0.049 | 0.006 | 0.139 |
| 1312 | Fe | 13 | 7.715 | 6.399 | -1.316 | -0.171 |
| 1312 | Pb | 13 | 0.365 | 0.243 | -0.123 | -0.336 |
| 1312 | Zn | 13 | 1.086 | 1.458 | 0.373 | 0.343 |
| 1313 | Ag | 8 | 12.043 | 21.926 | 9.883 | 0.821 |
| 1313 | Au | 8 | 0.156 | 0.139 | -0.017 | -0.112 |
| 1313 | Cu | 8 | 0.027 | 0.023 | -0.005 | -0.167 |
| 1313 | Fe | 8 | 7.921 | 6.154 | -1.767 | -0.223 |
| 1313 | Pb | 8 | 0.766 | 1.571 | 0.805 | 1.051 |
| 1313 | Zn | 8 | 1.513 | 1.29 | -0.223 | -0.147 |
| 1314 | Ag | 8 | 13.727 | 13.457 | -0.27 | -0.02 |
| 1314 | Au | 8 | 0.714 | 0.712 | -0.002 | -0.003 |
| 1314 | Cu | 8 | 0.068 | 0.071 | 0.003 | 0.04 |
| 1314 | Fe | 8 | 14.609 | 14.235 | -0.374 | -0.026 |
| 1314 | Pb | 8 | 0.182 | 0.181 | -0.001 | -0.006 |
| 1314 | Zn | 8 | 0.288 | 0.287 | -0.001 | -0.003 |
| 1331 | Ag | 14 | 28.39 | 27.687 | -0.702 | -0.025 |
| 1331 | Au | 14 | 0.64 | 1.206 | 0.567 | 0.886 |
AYA GOLD & SILVER INC., BOUMADINE POLYMETALLIC PROJECT 469
| | | | | | | | | | | | | | | | | | | | |
| 1331 | Cu | 14 | 0.055 | 0.079 | 0.024 | 0.445 |
| 1331 | Fe | 14 | 12.13 | 15.118 | 2.987 | 0.246 |
| 1331 | Pb | 14 | 1.099 | 0.977 | -0.121 | -0.111 |
| 1331 | Zn | 14 | 1.957 | 1.292 | -0.665 | -0.34 |
| 1341 | Ag | 14 | 13.475 | 17.724 | 4.249 | 0.315 |
| 1341 | Au | 14 | 0.319 | 0.299 | -0.02 | -0.062 |
| 1341 | Cu | 14 | 0.043 | 0.059 | 0.015 | 0.358 |
| 1341 | Fe | 14 | 8.902 | 7.798 | -1.104 | -0.124 |
| 1341 | Pb | 14 | 0.765 | 0.991 | 0.226 | 0.296 |
| 1341 | Zn | 14 | 1.485 | 1.487 | 0.002 | 0.001 |
| 1403 | Ag | 7 | 18.74 | 18.585 | -0.155 | -0.008 |
| 1403 | Au | 7 | 0.311 | 0.392 | 0.081 | 0.26 |
| 1403 | Cu | 7 | 0.046 | 0.044 | -0.002 | -0.037 |
| 1403 | Fe | 7 | 17.885 | 16.088 | -1.797 | -0.1 |
| 1403 | Pb | 7 | 1.651 | 1.931 | 0.281 | 0.17 |
| 1403 | Zn | 7 | 2.066 | 1.684 | -0.382 | -0.185 |
| 1404 | Ag | 15 | 35.756 | 29.244 | -6.513 | -0.182 |
| 1404 | Au | 15 | 0.349 | 0.197 | -0.152 | -0.436 |
| 1404 | Cu | 15 | 0.125 | 0.096 | -0.029 | -0.234 |
| 1404 | Fe | 15 | 15.532 | 15.534 | 0.002 | 0 |
| 1404 | Pb | 15 | 0.572 | 0.439 | -0.133 | -0.232 |
| 1404 | Zn | 15 | 2.113 | 1.234 | -0.879 | -0.416 |
| 1407 | Ag | 17 | 17.809 | 21.77 | 3.961 | 0.222 |
| 1407 | Au | 17 | 0.639 | 1.2 | 0.56 | 0.876 |
| 1407 | Cu | 17 | 0.059 | 0.086 | 0.027 | 0.456 |
| 1407 | Fe | 17 | 14.893 | 18.028 | 3.135 | 0.211 |
| 1407 | Pb | 17 | 0.458 | 0.429 | -0.029 | -0.063 |
| 1407 | Zn | 17 | 0.733 | 0.83 | 0.096 | 0.132 |
| 1501 | Ag | 12 | 70.94 | 72.539 | 1.598 | 0.023 |
| 1501 | Au | 12 | 0.823 | 1.129 | 0.307 | 0.373 |
| 1501 | Cu | 12 | 0.032 | 0.056 | 0.024 | 0.765 |
| 1501 | Fe | 12 | 16.317 | 16.132 | -0.185 | -0.011 |
| 1501 | Pb | 12 | 0.897 | 0.81 | -0.087 | -0.097 |
| 1501 | Zn | 12 | 1.68 | 3.153 | 1.473 | 0.877 |
| 1502 | Ag | 19 | 100.706 | 126.634 | 25.928 | 0.257 |
| 1502 | Au | 19 | 0.582 | 0.708 | 0.126 | 0.217 |
| 1502 | Cu | 19 | 0.033 | 0.032 | -0.002 | -0.048 |
| 1502 | Fe | 19 | 12.732 | 13.707 | 0.975 | 0.077 |
| 1502 | Pb | 19 | 0.987 | 1.253 | 0.265 | 0.269 |
| 1502 | Zn | 19 | 2.468 | 3.237 | 0.769 | 0.312 |
| 1503 | Ag | 18 | 79.693 | 62.083 | -17.61 | -0.221 |
| 1503 | Au | 18 | 0.518 | 0.612 | 0.094 | 0.181 |
| 1503 | Cu | 18 | 0.054 | 0.04 | -0.014 | -0.259 |
| 1503 | Fe | 18 | 14.953 | 15.957 | 1.003 | 0.067 |
| 1503 | Pb | 18 | 0.738 | 0.625 | -0.113 | -0.153 |
| 1503 | Zn | 18 | 1.711 | 1.465 | -0.246 | -0.144 |
| 1504 | Ag | 8 | 119.388 | 119.237 | -0.151 | -0.001 |
| 1504 | Au | 8 | 0.802 | 1.179 | 0.376 | 0.469 |
| 1504 | Cu | 8 | 0.027 | 0.023 | -0.004 | -0.135 |
| 1504 | Fe | 8 | 15.004 | 14.011 | -0.993 | -0.066 |
| 1504 | Pb | 8 | 0.914 | 1.103 | 0.189 | 0.207 |
AYA GOLD & SILVER INC., BOUMADINE POLYMETALLIC PROJECT 470
| | | | | | | | | | | | | | | | | | | | |
| 1504 | Zn | 8 | 1.555 | 1.71 | 0.154 | 0.099 |
| 1505 | Ag | 10 | 69.453 | 70.657 | 1.204 | 0.017 |
| 1505 | Au | 10 | 0.599 | 0.592 | -0.007 | -0.011 |
| 1505 | Cu | 10 | 0.03 | 0.029 | -0.001 | -0.047 |
| 1505 | Fe | 10 | 14.318 | 15.654 | 1.336 | 0.093 |
| 1505 | Pb | 10 | 0.49 | 0.714 | 0.223 | 0.455 |
| 1505 | Zn | 10 | 1.156 | 0.946 | -0.21 | -0.182 |
| 1601 | Ag | 6 | 37.935 | 22.985 | -14.95 | -0.394 |
| 1601 | Au | 6 | 0.234 | 0.203 | -0.031 | -0.133 |
| 1601 | Cu | 6 | 0.149 | 0.092 | -0.057 | -0.382 |
| 1601 | Fe | 6 | 16.423 | 16.363 | -0.061 | -0.004 |
| 1601 | Pb | 6 | 2.295 | 1.235 | -1.06 | -0.462 |
| 1601 | Zn | 6 | 2.595 | 1.936 | -0.659 | -0.254 |
| 1614 | Ag | 5 | 23.656 | 21.429 | -2.227 | -0.094 |
| 1614 | Au | 5 | 0.625 | 0.619 | -0.006 | -0.01 |
| 1614 | Cu | 5 | 0.115 | 0.065 | -0.05 | -0.437 |
| 1614 | Fe | 5 | 16.995 | 16.937 | -0.057 | -0.003 |
| 1614 | Pb | 5 | 0.135 | 0.128 | -0.008 | -0.056 |
| 1614 | Zn | 5 | 0.15 | 0.122 | -0.028 | -0.186 |
| 1631 | Ag | 6 | 25.869 | 27.727 | 1.858 | 0.072 |
| 1631 | Au | 6 | 0.518 | 0.648 | 0.13 | 0.251 |
| 1631 | Cu | 6 | 0.034 | 0.018 | -0.016 | -0.476 |
| 1631 | Fe | 6 | 11.692 | 10.96 | -0.732 | -0.063 |
| 1631 | Pb | 6 | 0.643 | 0.443 | -0.199 | -0.31 |
| 1631 | Zn | 6 | 0.686 | 0.594 | -0.091 | -0.133 |
| 1632 | Ag | 15 | 19.574 | 20.809 | 1.235 | 0.063 |
| 1632 | Au | 15 | 0.943 | 0.977 | 0.035 | 0.037 |
| 1632 | Cu | 15 | 0.033 | 0.039 | 0.006 | 0.187 |
| 1632 | Fe | 15 | 11.956 | 10.91 | -1.046 | -0.087 |
| 1632 | Pb | 15 | 0.556 | 0.269 | -0.288 | -0.517 |
| 1632 | Zn | 15 | 1.392 | 0.559 | -0.834 | -0.599 |
| 2002 | Ag | 21 | 26.508 | 23.63 | -2.879 | -0.109 |
| 2002 | Au | 21 | 1.143 | 2.025 | 0.882 | 0.771 |
| 2002 | Cu | 21 | 0.046 | 0.061 | 0.016 | 0.341 |
| 2002 | Fe | 21 | 14.844 | 13.801 | -1.042 | -0.07 |
| 2002 | Pb | 21 | 0.924 | 0.514 | -0.411 | -0.444 |
| 2002 | Zn | 21 | 1.101 | 0.918 | -0.183 | -0.166 |
| 2004 | Ag | 9 | 67.003 | 73.827 | 6.824 | 0.102 |
| 2004 | Au | 9 | 1.135 | 1.455 | 0.32 | 0.282 |
| 2004 | Cu | 9 | 0.147 | 0.191 | 0.044 | 0.3 |
| 2004 | Fe | 9 | 17.733 | 17.992 | 0.259 | 0.015 |
| 2004 | Pb | 9 | 0.328 | 0.383 | 0.055 | 0.168 |
| 2004 | Zn | 9 | 1.839 | 1.611 | -0.228 | -0.124 |
| 2005 | Ag | 11 | 23.936 | 17.389 | -6.547 | -0.274 |
| 2005 | Au | 11 | 0.219 | 0.32 | 0.101 | 0.461 |
| 2005 | Cu | 11 | 0.014 | 0.014 | 0 | -0.001 |
| 2005 | Fe | 11 | 14.874 | 14.324 | -0.55 | -0.037 |
| 2005 | Pb | 11 | 0.405 | 0.477 | 0.073 | 0.18 |
| 2005 | Zn | 11 | 1.488 | 1.831 | 0.343 | 0.231 |
| 2006 | Ag | 9 | 36.885 | 16.973 | -19.912 | -0.54 |
| 2006 | Au | 9 | 0.282 | 0.846 | 0.564 | 2 |
AYA GOLD & SILVER INC., BOUMADINE POLYMETALLIC PROJECT 471
| | | | | | | | | | | | | | | | | | | | |
| 2006 | Cu | 9 | 0.029 | 0.026 | -0.003 | -0.1 |
| 2006 | Fe | 9 | 10.756 | 12.808 | 2.052 | 0.191 |
| 2006 | Pb | 9 | 1.824 | 0.963 | -0.862 | -0.472 |
| 2006 | Zn | 9 | 1.634 | 1.438 | -0.196 | -0.12 |
| 2009 | Ag | 14 | 40.554 | 25.07 | -15.485 | -0.382 |
| 2009 | Au | 14 | 1.561 | 0.905 | -0.656 | -0.42 |
| 2009 | Cu | 14 | 0.059 | 0.036 | -0.023 | -0.397 |
| 2009 | Fe | 14 | 17.293 | 15.63 | -1.664 | -0.096 |
| 2009 | Pb | 14 | 0.901 | 0.505 | -0.397 | -0.44 |
| 2009 | Zn | 14 | 1.181 | 0.89 | -0.29 | -0.246 |
| 2012 | Ag | 13 | 37.485 | 37.831 | 0.345 | 0.009 |
| 2012 | Au | 13 | 0.584 | 0.775 | 0.191 | 0.328 |
| 2012 | Cu | 13 | 0.025 | 0.036 | 0.011 | 0.449 |
| 2012 | Fe | 13 | 13.047 | 12.846 | -0.201 | -0.015 |
| 2012 | Pb | 13 | 1.116 | 1.037 | -0.078 | -0.07 |
| 2012 | Zn | 13 | 2.778 | 3.416 | 0.638 | 0.23 |
| 2018 | Ag | 9 | 57.536 | 79.426 | 21.89 | 0.38 |
| 2018 | Au | 9 | 1.486 | 2.408 | 0.922 | 0.62 |
| 2018 | Cu | 9 | 0.03 | 0.043 | 0.013 | 0.419 |
| 2018 | Fe | 9 | 17.03 | 25.585 | 8.555 | 0.502 |
| 2018 | Pb | 9 | 0.744 | 0.613 | -0.131 | -0.176 |
| 2018 | Zn | 9 | 3.691 | 2.868 | -0.823 | -0.223 |
| 2019 | Ag | 4 | 78.913 | 58.768 | -20.145 | -0.255 |
| 2019 | Au | 4 | 1.697 | 2.029 | 0.332 | 0.195 |
| 2019 | Cu | 4 | 0.161 | 0.147 | -0.014 | -0.088 |
| 2019 | Fe | 4 | 16.958 | 22.49 | 5.532 | 0.326 |
| 2019 | Pb | 4 | 0.238 | 0.203 | -0.035 | -0.148 |
| 2019 | Zn | 4 | 0.46 | 0.581 | 0.121 | 0.263 |
| 2020 | Ag | 8 | 30.084 | 46.517 | 16.433 | 0.546 |
| 2020 | Au | 8 | 2.327 | 4.203 | 1.877 | 0.807 |
| 2020 | Cu | 8 | 0.045 | 0.064 | 0.018 | 0.405 |
| 2020 | Fe | 8 | 14.912 | 17.952 | 3.04 | 0.204 |
| 2020 | Pb | 8 | 0.342 | 0.376 | 0.034 | 0.098 |
| 2020 | Zn | 8 | 1.115 | 0.72 | -0.395 | -0.354 |
| 2026 | Ag | 4 | 14.069 | 13.826 | -0.243 | -0.017 |
| 2026 | Au | 4 | 0.342 | 0.534 | 0.192 | 0.562 |
| 2026 | Cu | 4 | 0.013 | 0.016 | 0.003 | 0.246 |
| 2026 | Fe | 4 | 12.246 | 13.743 | 1.497 | 0.122 |
| 2026 | Pb | 4 | 0.347 | 0.794 | 0.447 | 1.288 |
| 2026 | Zn | 4 | 1.052 | 1.912 | 0.86 | 0.818 |
| 2091 | Ag | 118 | 53.233 | 45.397 | -7.836 | -0.147 |
| 2091 | Au | 118 | 2.853 | 2.455 | -0.399 | -0.14 |
| 2091 | Cu | 118 | 0.085 | 0.082 | -0.003 | -0.037 |
| 2091 | Fe | 118 | 17.978 | 17.516 | -0.462 | -0.026 |
| 2091 | Pb | 118 | 0.593 | 0.522 | -0.071 | -0.12 |
| 2091 | Zn | 118 | 1.722 | 1.542 | -0.18 | -0.105 |
| 2101 | Ag | 8 | 41.468 | 38.322 | -3.145 | -0.076 |
| 2101 | Au | 8 | 1.363 | 1.221 | -0.142 | -0.104 |
| 2101 | Cu | 8 | 0.048 | 0.044 | -0.004 | -0.078 |
| 2101 | Fe | 8 | 12.145 | 11.766 | -0.379 | -0.031 |
| 2101 | Pb | 8 | 0.435 | 0.46 | 0.024 | 0.056 |
AYA GOLD & SILVER INC., BOUMADINE POLYMETALLIC PROJECT 472
| | | | | | | | | | | | | | | | | | | | |
| 2101 | Zn | 8 | 2.401 | 2.821 | 0.42 | 0.175 |
| 2103 | Ag | 32 | 39.127 | 35.979 | -3.148 | -0.08 |
| 2103 | Au | 32 | 0.806 | 0.952 | 0.146 | 0.181 |
| 2103 | Cu | 32 | 0.061 | 0.051 | -0.011 | -0.171 |
| 2103 | Fe | 32 | 14.083 | 16.109 | 2.026 | 0.144 |
| 2103 | Pb | 32 | 0.847 | 0.57 | -0.277 | -0.327 |
| 2103 | Zn | 32 | 2.401 | 1.711 | -0.689 | -0.287 |
| 2104 | Ag | 39 | 38.454 | 49.081 | 10.627 | 0.276 |
| 2104 | Au | 39 | 1.216 | 1.769 | 0.553 | 0.455 |
| 2104 | Cu | 39 | 0.085 | 0.09 | 0.005 | 0.058 |
| 2104 | Fe | 39 | 14.677 | 19.514 | 4.837 | 0.33 |
| 2104 | Pb | 39 | 0.646 | 0.553 | -0.093 | -0.144 |
| 2104 | Zn | 39 | 2.018 | 1.809 | -0.209 | -0.104 |
| 2106 | Ag | 18 | 24.79 | 16.758 | -8.032 | -0.324 |
| 2106 | Au | 18 | 1.784 | 1.058 | -0.725 | -0.407 |
| 2106 | Cu | 18 | 0.106 | 0.048 | -0.058 | -0.549 |
| 2106 | Fe | 18 | 14.966 | 11.653 | -3.313 | -0.221 |
| 2106 | Pb | 18 | 0.457 | 0.303 | -0.153 | -0.335 |
| 2106 | Zn | 18 | 1.35 | 0.916 | -0.434 | -0.321 |
| 2113 | Ag | 6 | 27.045 | 23.665 | -3.38 | -0.125 |
| 2113 | Au | 6 | 0.756 | 0.606 | -0.15 | -0.199 |
| 2113 | Cu | 6 | 0.064 | 0.053 | -0.011 | -0.167 |
| 2113 | Fe | 6 | 13.277 | 11.879 | -1.399 | -0.105 |
| 2113 | Pb | 6 | 0.758 | 0.636 | -0.122 | -0.161 |
| 2113 | Zn | 6 | 1.081 | 1.084 | 0.003 | 0.003 |
| 2115 | Ag | 6 | 17 | 18.138 | 1.138 | 0.067 |
| 2115 | Au | 6 | 0.275 | 0.26 | -0.015 | -0.054 |
| 2115 | Cu | 6 | 0.034 | 0.035 | 0.002 | 0.048 |
| 2115 | Fe | 6 | 12.384 | 13.413 | 1.03 | 0.083 |
| 2115 | Pb | 6 | 0.523 | 0.599 | 0.077 | 0.146 |
| 2115 | Zn | 6 | 1.208 | 1.307 | 0.099 | 0.082 |
| 2117 | Ag | 23 | 58.768 | 71.693 | 12.925 | 0.22 |
| 2117 | Au | 23 | 1.806 | 2.485 | 0.679 | 0.376 |
| 2117 | Cu | 23 | 0.098 | 0.133 | 0.035 | 0.358 |
| 2117 | Fe | 23 | 16.809 | 17.398 | 0.588 | 0.035 |
| 2117 | Pb | 23 | 0.71 | 0.483 | -0.227 | -0.319 |
| 2117 | Zn | 23 | 1.546 | 0.771 | -0.775 | -0.501 |
| 2118 | Ag | 8 | 25.872 | 28.667 | 2.795 | 0.108 |
| 2118 | Au | 8 | 0.803 | 1.2 | 0.397 | 0.494 |
| 2118 | Cu | 8 | 0.059 | 0.091 | 0.032 | 0.535 |
| 2118 | Fe | 8 | 14.142 | 22.868 | 8.725 | 0.617 |
| 2118 | Pb | 8 | 0.596 | 0.464 | -0.132 | -0.221 |
| 2118 | Zn | 8 | 1.921 | 1.123 | -0.798 | -0.415 |
| 2120 | Ag | 7 | 89.449 | 77.787 | -11.662 | -0.13 |
| 2120 | Au | 7 | 2.524 | 2.787 | 0.263 | 0.104 |
| 2120 | Cu | 7 | 0.2 | 0.169 | -0.031 | -0.155 |
| 2120 | Fe | 7 | 20.178 | 21.365 | 1.186 | 0.059 |
| 2120 | Pb | 7 | 0.462 | 0.546 | 0.083 | 0.18 |
| 2120 | Zn | 7 | 1.175 | 1.677 | 0.502 | 0.427 |
| 2122 | Ag | 6 | 208.21 | 65.847 | -142.363 | -0.684 |
| 2122 | Au | 6 | 0.796 | 1.431 | 0.635 | 0.797 |
AYA GOLD & SILVER INC., BOUMADINE POLYMETALLIC PROJECT 473
| | | | | | | | | | | | | | | | | | | | |
| 2122 | Cu | 6 | 0.069 | 0.054 | -0.015 | -0.218 |
| 2122 | Fe | 6 | 14.47 | 21.296 | 6.826 | 0.472 |
| 2122 | Pb | 6 | 2.192 | 1.106 | -1.086 | -0.495 |
| 2122 | Zn | 6 | 0.446 | 0.627 | 0.181 | 0.405 |
| 2127 | Ag | 2 | 39.5 | 22.478 | -17.022 | -0.431 |
| 2127 | Au | 2 | 0.135 | 0.075 | -0.06 | -0.448 |
| 2127 | Cu | 2 | 0.21 | 0.119 | -0.091 | -0.435 |
| 2127 | Fe | 2 | 16.726 | 10.638 | -6.089 | -0.364 |
| 2127 | Pb | 2 | 0.129 | 0.153 | 0.024 | 0.186 |
| 2127 | Zn | 2 | 1.157 | 1.681 | 0.524 | 0.453 |
| 2130 | Ag | 7 | 24.558 | 15.776 | -8.782 | -0.358 |
| 2130 | Au | 7 | 1.558 | 0.739 | -0.819 | -0.526 |
| 2130 | Cu | 7 | 0.097 | 0.147 | 0.05 | 0.516 |
| 2130 | Fe | 7 | 15.189 | 9.078 | -6.11 | -0.402 |
| 2130 | Pb | 7 | 1.478 | 1.25 | -0.228 | -0.154 |
| 2130 | Zn | 7 | 1.687 | 2.302 | 0.615 | 0.365 |
| 2131 | Ag | 6 | 19.957 | 17.587 | -2.371 | -0.119 |
| 2131 | Au | 6 | 2.131 | 1.746 | -0.385 | -0.181 |
| 2131 | Cu | 6 | 0.027 | 0.029 | 0.001 | 0.054 |
| 2131 | Fe | 6 | 20.165 | 22.919 | 2.754 | 0.137 |
| 2131 | Pb | 6 | 0.483 | 0.48 | -0.003 | -0.006 |
| 2131 | Zn | 6 | 1.123 | 1.554 | 0.431 | 0.384 |
| 2132 | Ag | 12 | 18.931 | 25.137 | 6.206 | 0.328 |
| 2132 | Au | 12 | 0.417 | 0.64 | 0.223 | 0.536 |
| 2132 | Cu | 12 | 0.039 | 0.065 | 0.026 | 0.654 |
| 2132 | Fe | 12 | 9.943 | 12.086 | 2.143 | 0.216 |
| 2132 | Pb | 12 | 0.616 | 0.65 | 0.034 | 0.055 |
| 2132 | Zn | 12 | 1.177 | 1.058 | -0.118 | -0.101 |
| 2203 | Ag | 10 | 96.192 | 46.891 | -49.301 | -0.513 |
| 2203 | Au | 10 | 0.404 | 0.363 | -0.042 | -0.103 |
| 2203 | Cu | 10 | 0.013 | 0.012 | -0.001 | -0.08 |
| 2203 | Fe | 10 | 12.686 | 13.154 | 0.468 | 0.037 |
| 2203 | Pb | 10 | 1.398 | 0.878 | -0.521 | -0.372 |
| 2203 | Zn | 10 | 3.171 | 3.04 | -0.131 | -0.041 |
| 2207 | Ag | 5 | 51.618 | 47.062 | -4.556 | -0.088 |
| 2207 | Au | 5 | 1.233 | 1.311 | 0.078 | 0.063 |
| 2207 | Cu | 5 | 0.01 | 0.01 | 0 | 0.024 |
| 2207 | Fe | 5 | 12.226 | 7.956 | -4.271 | -0.349 |
| 2207 | Pb | 5 | 0.467 | 0.422 | -0.045 | -0.097 |
| 2207 | Zn | 5 | 1.177 | 0.486 | -0.692 | -0.587 |
| 2213 | Ag | 4 | 37.305 | 35.18 | -2.125 | -0.057 |
| 2213 | Au | 4 | 2.405 | 1.973 | -0.432 | -0.18 |
| 2213 | Cu | 4 | 0.104 | 0.055 | -0.049 | -0.474 |
| 2213 | Fe | 4 | 15.064 | 10.333 | -4.731 | -0.314 |
| 2213 | Pb | 4 | 0.359 | 0.32 | -0.039 | -0.109 |
| 2213 | Zn | 4 | 0.482 | 0.697 | 0.215 | 0.446 |
| 2215 | Ag | 4 | 4.797 | 5.602 | 0.805 | 0.168 |
| 2215 | Au | 4 | 0.159 | 0.095 | -0.064 | -0.401 |
| 2215 | Cu | 4 | 0.012 | 0.013 | 0.001 | 0.073 |
| 2215 | Fe | 4 | 12.417 | 9.901 | -2.516 | -0.203 |
| 2215 | Pb | 4 | 0.243 | 0.276 | 0.034 | 0.138 |
AYA GOLD & SILVER INC., BOUMADINE POLYMETALLIC PROJECT 474
| | | | | | | | | | | | | | | | | | | | |
| 2215 | Zn | 4 | 2.904 | 4.02 | 1.116 | 0.384 |
| 2216 | Ag | 10 | 21.086 | 20.471 | -0.615 | -0.029 |
| 2216 | Au | 10 | 0.717 | 0.477 | -0.239 | -0.334 |
| 2216 | Cu | 10 | 0.013 | 0.014 | 0.001 | 0.055 |
| 2216 | Fe | 10 | 10.24 | 9.907 | -0.333 | -0.033 |
| 2216 | Pb | 10 | 0.43 | 0.333 | -0.097 | -0.226 |
| 2216 | Zn | 10 | 1.148 | 1.505 | 0.357 | 0.311 |
| 2219 | Ag | 9 | 68.299 | 98.258 | 29.959 | 0.439 |
| 2219 | Au | 9 | 2.123 | 3.665 | 1.542 | 0.726 |
| 2219 | Cu | 9 | 0.121 | 0.172 | 0.052 | 0.429 |
| 2219 | Fe | 9 | 22.521 | 31.386 | 8.865 | 0.394 |
| 2219 | Pb | 9 | 1.848 | 0.988 | -0.86 | -0.465 |
| 2219 | Zn | 9 | 0.552 | 1.036 | 0.484 | 0.877 |
| 2221 | Ag | 7 | 24.914 | 26.571 | 1.657 | 0.066 |
| 2221 | Au | 7 | 0.488 | 0.558 | 0.069 | 0.142 |
| 2221 | Cu | 7 | 0.022 | 0.024 | 0.002 | 0.087 |
| 2221 | Fe | 7 | 11.272 | 11.021 | -0.251 | -0.022 |
| 2221 | Pb | 7 | 0.798 | 0.854 | 0.056 | 0.07 |
| 2221 | Zn | 7 | 0.868 | 0.787 | -0.082 | -0.094 |
| 2222 | Ag | 5 | 15.722 | 15.854 | 0.132 | 0.008 |
| 2222 | Au | 5 | 0.243 | 0.12 | -0.123 | -0.506 |
| 2222 | Cu | 5 | 0.05 | 0.063 | 0.013 | 0.267 |
| 2222 | Fe | 5 | 9.672 | 4.298 | -5.374 | -0.556 |
| 2222 | Pb | 5 | 0.531 | 0.841 | 0.31 | 0.585 |
| 2222 | Zn | 5 | 5.083 | 9.063 | 3.98 | 0.783 |
| 2223 | Ag | 8 | 81.908 | 31.693 | -50.214 | -0.613 |
| 2223 | Au | 8 | 0.941 | 0.982 | 0.041 | 0.044 |
| 2223 | Cu | 8 | 0.024 | 0.016 | -0.009 | -0.358 |
| 2223 | Fe | 8 | 10.776 | 11.975 | 1.199 | 0.111 |
| 2223 | Pb | 8 | 0.725 | 0.611 | -0.114 | -0.157 |
| 2223 | Zn | 8 | 1.44 | 1.617 | 0.177 | 0.123 |
| 2224 | Ag | 2 | 35.93 | 30.328 | -5.602 | -0.156 |
| 2224 | Au | 2 | 0.6 | 0.941 | 0.341 | 0.569 |
| 2224 | Cu | 2 | 0.036 | 0.023 | -0.014 | -0.372 |
| 2224 | Fe | 2 | 6.92 | 7.947 | 1.026 | 0.148 |
| 2224 | Pb | 2 | 3.477 | 1.605 | -1.872 | -0.538 |
| 2224 | Zn | 2 | 0.621 | 0.819 | 0.198 | 0.319 |
| 2225 | Ag | 6 | 27.299 | 33.416 | 6.117 | 0.224 |
| 2225 | Au | 6 | 2.714 | 2.907 | 0.193 | 0.071 |
| 2225 | Cu | 6 | 0.062 | 0.077 | 0.015 | 0.246 |
| 2225 | Fe | 6 | 18.796 | 21.567 | 2.771 | 0.147 |
| 2225 | Pb | 6 | 0.254 | 0.294 | 0.04 | 0.156 |
| 2225 | Zn | 6 | 0.713 | 0.421 | -0.292 | -0.41 |
| 2235 | Ag | 5 | 11.755 | 14.143 | 2.389 | 0.203 |
| 2235 | Au | 5 | 3.347 | 3.273 | -0.074 | -0.022 |
| 2235 | Cu | 5 | 0.024 | 0.024 | -0.001 | -0.029 |
| 2235 | Fe | 5 | 8.832 | 10.162 | 1.329 | 0.151 |
| 2235 | Pb | 5 | 0.432 | 0.439 | 0.006 | 0.014 |
| 2235 | Zn | 5 | 2.226 | 2.41 | 0.184 | 0.083 |
| 2236 | Ag | 2 | 52.923 | 61.065 | 8.142 | 0.154 |
| 2236 | Au | 2 | 0.476 | 0.593 | 0.117 | 0.246 |
AYA GOLD & SILVER INC., BOUMADINE POLYMETALLIC PROJECT 475
| | | | | | | | | | | | | | | | | | | | |
| 2236 | Cu | 2 | 0.02 | 0.025 | 0.005 | 0.245 |
| 2236 | Fe | 2 | 16.528 | 15.226 | -1.302 | -0.079 |
| 2236 | Pb | 2 | 0.448 | 0.485 | 0.037 | 0.083 |
| 2236 | Zn | 2 | 1.137 | 1.316 | 0.179 | 0.157 |
| 2309 | Ag | 7 | 78.947 | 63.33 | -15.618 | -0.198 |
| 2309 | Au | 7 | 1.243 | 1.014 | -0.229 | -0.184 |
| 2309 | Cu | 7 | 0.09 | 0.052 | -0.038 | -0.419 |
| 2309 | Fe | 7 | 19.435 | 16.026 | -3.41 | -0.175 |
| 2309 | Pb | 7 | 1.44 | 0.53 | -0.91 | -0.632 |
| 2309 | Zn | 7 | 0.694 | 0.3 | -0.394 | -0.568 |
| 2311 | Ag | 13 | 28.545 | 26.104 | -2.441 | -0.086 |
| 2311 | Au | 13 | 1.187 | 1.11 | -0.078 | -0.065 |
| 2311 | Cu | 13 | 0.044 | 0.043 | -0.001 | -0.026 |
| 2311 | Fe | 13 | 15.921 | 13.932 | -1.989 | -0.125 |
| 2311 | Pb | 13 | 0.593 | 0.494 | -0.099 | -0.167 |
| 2311 | Zn | 13 | 1.71 | 1.368 | -0.342 | -0.2 |
| 2314 | Ag | 4 | 73.161 | 57.317 | -15.844 | -0.217 |
| 2314 | Au | 4 | 0.603 | 0.598 | -0.005 | -0.009 |
| 2314 | Cu | 4 | 0.142 | 0.138 | -0.004 | -0.029 |
| 2314 | Fe | 4 | 22.157 | 25.913 | 3.756 | 0.17 |
| 2314 | Pb | 4 | 0.887 | 0.882 | -0.005 | -0.005 |
| 2314 | Zn | 4 | 1.745 | 2.509 | 0.764 | 0.438 |
| 2327 | Ag | 6 | 39.443 | 35.109 | -4.334 | -0.11 |
| 2327 | Au | 6 | 0.826 | 0.914 | 0.088 | 0.107 |
| 2327 | Cu | 6 | 0.019 | 0.019 | -0.001 | -0.033 |
| 2327 | Fe | 6 | 15.266 | 17.324 | 2.058 | 0.135 |
| 2327 | Pb | 6 | 0.312 | 0.25 | -0.062 | -0.2 |
| 2327 | Zn | 6 | 1.766 | 1.178 | -0.588 | -0.333 |
| 2400 | Ag | 20 | 68.845 | 62.483 | -6.362 | -0.092 |
| 2400 | Au | 20 | 1.191 | 1.15 | -0.041 | -0.035 |
| 2400 | Cu | 20 | 0.065 | 0.052 | -0.013 | -0.196 |
| 2400 | Fe | 20 | 17.745 | 17.228 | -0.517 | -0.029 |
| 2400 | Pb | 20 | 0.56 | 0.465 | -0.095 | -0.17 |
| 2400 | Zn | 20 | 0.62 | 0.754 | 0.134 | 0.217 |
| 2401 | Ag | 18 | 36.651 | 43.911 | 7.259 | 0.198 |
| 2401 | Au | 18 | 0.252 | 0.404 | 0.152 | 0.604 |
| 2401 | Cu | 18 | 0.029 | 0.042 | 0.013 | 0.465 |
| 2401 | Fe | 18 | 11.424 | 10.957 | -0.467 | -0.041 |
| 2401 | Pb | 18 | 1.776 | 1.812 | 0.035 | 0.02 |
| 2401 | Zn | 18 | 1.129 | 0.978 | -0.15 | -0.133 |
| 2405 | Ag | 5 | 28.589 | 21.057 | -7.532 | -0.263 |
| 2405 | Au | 5 | 0.316 | 0.202 | -0.114 | -0.36 |
| 2405 | Cu | 5 | 0.02 | 0.026 | 0.006 | 0.31 |
| 2405 | Fe | 5 | 15.555 | 18.318 | 2.763 | 0.178 |
| 2405 | Pb | 5 | 0.552 | 0.792 | 0.24 | 0.435 |
| 2405 | Zn | 5 | 0.637 | 0.806 | 0.169 | 0.265 |
| 2408 | Ag | 7 | 52.679 | 50.904 | -1.774 | -0.034 |
| 2408 | Au | 7 | 1.203 | 0.872 | -0.332 | -0.275 |
| 2408 | Cu | 7 | 0.053 | 0.057 | 0.004 | 0.067 |
| 2408 | Fe | 7 | 13.325 | 10.782 | -2.543 | -0.191 |
| 2408 | Pb | 7 | 0.323 | 0.342 | 0.019 | 0.059 |
AYA GOLD & SILVER INC., BOUMADINE POLYMETALLIC PROJECT 476
| | | | | | | | | | | | | | | | | | | | |
| 2408 | Zn | 7 | 0.508 | 0.517 | 0.009 | 0.018 |
| 2410 | Ag | 13 | 43.166 | 80.849 | 37.684 | 0.873 |
| 2410 | Au | 13 | 0.757 | 1.707 | 0.951 | 1.256 |
| 2410 | Cu | 13 | 0.028 | 0.056 | 0.027 | 0.959 |
| 2410 | Fe | 13 | 15.677 | 18.964 | 3.286 | 0.21 |
| 2410 | Pb | 13 | 0.8 | 0.837 | 0.038 | 0.047 |
| 2410 | Zn | 13 | 2.003 | 1.86 | -0.143 | -0.071 |
| 2411 | Ag | 6 | 22.431 | 19.751 | -2.68 | -0.119 |
| 2411 | Au | 6 | 0.903 | 0.982 | 0.079 | 0.087 |
| 2411 | Cu | 6 | 0.046 | 0.036 | -0.01 | -0.213 |
| 2411 | Fe | 6 | 20.349 | 20.551 | 0.202 | 0.01 |
| 2411 | Pb | 6 | 0.446 | 0.342 | -0.104 | -0.233 |
| 2411 | Zn | 6 | 0.863 | 0.757 | -0.106 | -0.123 |
| 2417 | Ag | 4 | 44.163 | 30.685 | -13.478 | -0.305 |
| 2417 | Au | 4 | 1.81 | 1.211 | -0.599 | -0.331 |
| 2417 | Cu | 4 | 0.015 | 0.012 | -0.002 | -0.144 |
| 2417 | Fe | 4 | 19.297 | 19.69 | 0.393 | 0.02 |
| 2417 | Pb | 4 | 0.448 | 0.268 | -0.181 | -0.403 |
| 2417 | Zn | 4 | 0.789 | 0.47 | -0.319 | -0.404 |
| 2424 | Ag | 4 | 27.333 | 22.051 | -5.282 | -0.193 |
| 2424 | Au | 4 | 0.594 | 0.614 | 0.02 | 0.034 |
| 2424 | Cu | 4 | 0.018 | 0.019 | 0.001 | 0.042 |
| 2424 | Fe | 4 | 17.448 | 15.106 | -2.343 | -0.134 |
| 2424 | Pb | 4 | 0.701 | 0.592 | -0.109 | -0.156 |
| 2424 | Zn | 4 | 1.742 | 1.424 | -0.318 | -0.183 |
| 2425 | Ag | 4 | 39.579 | 43.547 | 3.968 | 0.1 |
| 2425 | Au | 4 | 0.263 | 0.398 | 0.135 | 0.516 |
| 2425 | Cu | 4 | 0.315 | 0.191 | -0.125 | -0.396 |
| 2425 | Fe | 4 | 2.369 | 2.025 | -0.345 | -0.145 |
| 2425 | Pb | 4 | 2.58 | 2.435 | -0.145 | -0.056 |
| 2425 | Zn | 4 | 0.955 | 0.969 | 0.013 | 0.014 |
| 2502 | Ag | 11 | 28.064 | 21.315 | -6.748 | -0.24 |
| 2502 | Au | 11 | 0.698 | 0.839 | 0.141 | 0.202 |
| 2502 | Cu | 11 | 0.248 | 0.068 | -0.18 | -0.724 |
| 2502 | Fe | 11 | 15.97 | 16.075 | 0.105 | 0.007 |
| 2502 | Pb | 11 | 1.507 | 0.705 | -0.801 | -0.532 |
| 2502 | Zn | 11 | 1.32 | 0.84 | -0.481 | -0.364 |
| 2507 | Ag | 23 | 52.038 | 66.802 | 14.764 | 0.284 |
| 2507 | Au | 23 | 1.087 | 2.424 | 1.337 | 1.23 |
| 2507 | Cu | 23 | 0.105 | 0.089 | -0.016 | -0.152 |
| 2507 | Fe | 23 | 14.921 | 17.944 | 3.023 | 0.203 |
| 2507 | Pb | 23 | 0.739 | 0.724 | -0.014 | -0.019 |
| 2507 | Zn | 23 | 1.784 | 1.821 | 0.037 | 0.021 |
| 2510 | Ag | 7 | 21.334 | 21.873 | 0.539 | 0.025 |
| 2510 | Au | 7 | 0.521 | 0.649 | 0.127 | 0.245 |
| 2510 | Cu | 7 | 0.074 | 0.116 | 0.043 | 0.58 |
| 2510 | Fe | 7 | 17.277 | 20.883 | 3.606 | 0.209 |
| 2510 | Pb | 7 | 0.348 | 0.351 | 0.003 | 0.01 |
| 2510 | Zn | 7 | 0.399 | 0.411 | 0.012 | 0.03 |
| 2538 | Ag | 9 | 20.913 | 14.832 | -6.081 | -0.291 |
| 2538 | Au | 9 | 0.188 | 0.161 | -0.026 | -0.139 |
AYA GOLD & SILVER INC., BOUMADINE POLYMETALLIC PROJECT 477
| | | | | | | | | | | | | | | | | | | | |
| 2538 | Cu | 9 | 0.02 | 0.027 | 0.007 | 0.328 |
| 2538 | Fe | 9 | 11.743 | 7.469 | -4.274 | -0.364 |
| 2538 | Pb | 9 | 0.804 | 1.001 | 0.197 | 0.245 |
| 2538 | Zn | 9 | 2.478 | 3.507 | 1.028 | 0.415 |
| 2614 | Ag | 4 | 30.864 | 23.221 | -7.643 | -0.248 |
| 2614 | Au | 4 | 0.215 | 0.215 | 0 | -0.002 |
| 2614 | Cu | 4 | 0.07 | 0.16 | 0.09 | 1.287 |
| 2614 | Fe | 4 | 20.711 | 16.634 | -4.077 | -0.197 |
| 2614 | Pb | 4 | 0.483 | 0.487 | 0.004 | 0.009 |
| 2614 | Zn | 4 | 1.352 | 2.018 | 0.667 | 0.493 |
| 2729 | Ag | 4 | 24.075 | 26.631 | 2.556 | 0.106 |
| 2729 | Au | 4 | 1.26 | 1.412 | 0.152 | 0.12 |
| 2729 | Cu | 4 | 0.07 | 0.077 | 0.008 | 0.109 |
| 2729 | Fe | 4 | 20.68 | 23.654 | 2.974 | 0.144 |
| 2729 | Pb | 4 | 0.482 | 0.361 | -0.121 | -0.252 |
| 2729 | Zn | 4 | 0.472 | 0.442 | -0.03 | -0.063 |
| 2802 | Ag | 6 | 39.183 | 44.573 | 5.39 | 0.138 |
| 2802 | Au | 6 | 0.698 | 1.038 | 0.34 | 0.486 |
| 2802 | Cu | 6 | 0.039 | 0.035 | -0.004 | -0.093 |
| 2802 | Fe | 6 | 11.077 | 12.646 | 1.57 | 0.142 |
| 2802 | Pb | 6 | 1.989 | 1.679 | -0.31 | -0.156 |
| 2802 | Zn | 6 | 2.506 | 3.661 | 1.156 | 0.461 |
| 3001 | Ag | 27 | 19.677 | 29.821 | 10.144 | 0.516 |
| 3001 | Au | 27 | 0.618 | 0.628 | 0.01 | 0.016 |
| 3001 | Cu | 27 | 0.037 | 0.049 | 0.013 | 0.344 |
| 3001 | Fe | 27 | 13.147 | 15.181 | 2.034 | 0.155 |
| 3001 | Pb | 27 | 0.408 | 0.227 | -0.182 | -0.445 |
| 3001 | Zn | 27 | 0.831 | 0.526 | -0.305 | -0.367 |
| 3002 | Ag | 7 | 28.225 | 25.017 | -3.208 | -0.114 |
| 3002 | Au | 7 | 0.809 | 0.704 | -0.105 | -0.13 |
| 3002 | Cu | 7 | 0.028 | 0.023 | -0.005 | -0.165 |
| 3002 | Fe | 7 | 13.037 | 13.059 | 0.022 | 0.002 |
| 3002 | Pb | 7 | 0.619 | 0.82 | 0.201 | 0.325 |
| 3002 | Zn | 7 | 1.444 | 1.378 | -0.066 | -0.046 |
| 3003 | Ag | 8 | 12.122 | 11.834 | -0.288 | -0.024 |
| 3003 | Au | 8 | 0.175 | 0.148 | -0.027 | -0.152 |
| 3003 | Cu | 8 | 0.025 | 0.027 | 0.002 | 0.1 |
| 3003 | Fe | 8 | 10.897 | 11.422 | 0.524 | 0.048 |
| 3003 | Pb | 8 | 0.26 | 0.252 | -0.008 | -0.03 |
| 3003 | Zn | 8 | 0.477 | 0.515 | 0.037 | 0.079 |
| 3004 | Ag | 7 | 16.008 | 19.307 | 3.299 | 0.206 |
| 3004 | Au | 7 | 0.531 | 0.757 | 0.226 | 0.426 |
| 3004 | Cu | 7 | 0.021 | 0.03 | 0.009 | 0.446 |
| 3004 | Fe | 7 | 10.042 | 10.048 | 0.006 | 0.001 |
| 3004 | Pb | 7 | 0.301 | 0.458 | 0.157 | 0.522 |
| 3004 | Zn | 7 | 0.569 | 0.746 | 0.177 | 0.312 |
| 3005 | Ag | 11 | 23.019 | 22.089 | -0.931 | -0.04 |
| 3005 | Au | 11 | 0.94 | 1.117 | 0.177 | 0.188 |
| 3005 | Cu | 11 | 0.022 | 0.018 | -0.004 | -0.161 |
| 3005 | Fe | 11 | 13.15 | 14.629 | 1.479 | 0.113 |
| 3005 | Pb | 11 | 0.347 | 0.295 | -0.052 | -0.15 |
AYA GOLD & SILVER INC., BOUMADINE POLYMETALLIC PROJECT 478
| | | | | | | | | | | | | | | | | | | | |
| 3005 | Zn | 11 | 0.777 | 0.766 | -0.011 | -0.014 |
| 3006 | Ag | 10 | 21.284 | 32.247 | 10.963 | 0.515 |
| 3006 | Au | 10 | 0.5 | 0.521 | 0.021 | 0.043 |
| 3006 | Cu | 10 | 0.078 | 0.077 | 0 | -0.006 |
| 3006 | Fe | 10 | 15.81 | 22.135 | 6.325 | 0.4 |
| 3006 | Pb | 10 | 0.538 | 0.38 | -0.158 | -0.294 |
| 3006 | Zn | 10 | 2.279 | 2.778 | 0.499 | 0.219 |
| 3007 | Ag | 7 | 24.601 | 27.105 | 2.504 | 0.102 |
| 3007 | Au | 7 | 0.209 | 0.257 | 0.048 | 0.227 |
| 3007 | Cu | 7 | 0.06 | 0.062 | 0.003 | 0.045 |
| 3007 | Fe | 7 | 14.749 | 13.065 | -1.684 | -0.114 |
| 3007 | Pb | 7 | 0.357 | 0.465 | 0.108 | 0.304 |
| 3007 | Zn | 7 | 0.944 | 0.976 | 0.033 | 0.035 |
| 3008 | Ag | 5 | 46.08 | 40.136 | -5.944 | -0.129 |
| 3008 | Au | 5 | 0.222 | 0.144 | -0.078 | -0.352 |
| 3008 | Cu | 5 | 0.02 | 0.018 | -0.002 | -0.114 |
| 3008 | Fe | 5 | 17.965 | 20.246 | 2.281 | 0.127 |
| 3008 | Pb | 5 | 0.385 | 0.259 | -0.127 | -0.329 |
| 3008 | Zn | 5 | 1.217 | 0.91 | -0.307 | -0.252 |
| 3009 | Ag | 13 | 20.921 | 27.766 | 6.845 | 0.327 |
| 3009 | Au | 13 | 0.824 | 1.911 | 1.087 | 1.319 |
| 3009 | Cu | 13 | 0.024 | 0.037 | 0.013 | 0.565 |
| 3009 | Fe | 13 | 15.947 | 16.938 | 0.99 | 0.062 |
| 3009 | Pb | 13 | 0.378 | 0.388 | 0.011 | 0.028 |
| 3009 | Zn | 13 | 0.573 | 0.507 | -0.066 | -0.116 |
| 3010 | Ag | 12 | 16.781 | 18.476 | 1.695 | 0.101 |
| 3010 | Au | 12 | 1.219 | 1.296 | 0.077 | 0.063 |
| 3010 | Cu | 12 | 0.043 | 0.053 | 0.011 | 0.25 |
| 3010 | Fe | 12 | 11.118 | 10.684 | -0.434 | -0.039 |
| 3010 | Pb | 12 | 0.38 | 0.291 | -0.089 | -0.233 |
| 3010 | Zn | 12 | 0.539 | 0.395 | -0.145 | -0.268 |
| 3011 | Ag | 8 | 15.821 | 17.584 | 1.763 | 0.111 |
| 3011 | Au | 8 | 0.588 | 0.565 | -0.023 | -0.039 |
| 3011 | Cu | 8 | 0.027 | 0.032 | 0.004 | 0.163 |
| 3011 | Fe | 8 | 12.779 | 12.353 | -0.426 | -0.033 |
| 3011 | Pb | 8 | 0.435 | 0.476 | 0.041 | 0.095 |
| 3011 | Zn | 8 | 1.774 | 1.947 | 0.173 | 0.098 |
| 3100 | Ag | 2 | 16.833 | 19.072 | 2.239 | 0.133 |
| 3100 | Au | 2 | 0.202 | 0.154 | -0.048 | -0.238 |
| 3100 | Cu | 2 | 0.011 | 0.01 | 0 | -0.022 |
| 3100 | Fe | 2 | 6.755 | 6.854 | 0.099 | 0.015 |
| 3100 | Pb | 2 | 0.596 | 0.7 | 0.104 | 0.175 |
| 3100 | Zn | 2 | 3.476 | 4.742 | 1.266 | 0.364 |
| 3101 | Ag | 46 | 30.546 | 30.74 | 0.194 | 0.006 |
| 3101 | Au | 46 | 1.109 | 1.205 | 0.096 | 0.086 |
| 3101 | Cu | 46 | 0.056 | 0.072 | 0.016 | 0.278 |
| 3101 | Fe | 46 | 15.401 | 17.084 | 1.683 | 0.109 |
| 3101 | Pb | 46 | 0.325 | 0.291 | -0.034 | -0.103 |
| 3101 | Zn | 46 | 0.913 | 0.777 | -0.137 | -0.149 |
| 3102 | Ag | 17 | 37.569 | 49.928 | 12.359 | 0.329 |
| 3102 | Au | 17 | 0.816 | 0.869 | 0.053 | 0.065 |
AYA GOLD & SILVER INC., BOUMADINE POLYMETALLIC PROJECT 479
| | | | | | | | | | | | | | | | | | | | |
| 3102 | Cu | 17 | 0.042 | 0.049 | 0.007 | 0.169 |
| 3102 | Fe | 17 | 14.514 | 16.471 | 1.957 | 0.135 |
| 3102 | Pb | 17 | 0.432 | 0.357 | -0.075 | -0.174 |
| 3102 | Zn | 17 | 0.811 | 0.701 | -0.109 | -0.135 |
| 3103 | Ag | 21 | 22.738 | 30.128 | 7.389 | 0.325 |
| 3103 | Au | 21 | 1.313 | 1.388 | 0.075 | 0.057 |
| 3103 | Cu | 21 | 0.047 | 0.101 | 0.055 | 1.171 |
| 3103 | Fe | 21 | 16.856 | 20.094 | 3.238 | 0.192 |
| 3103 | Pb | 21 | 0.255 | 0.173 | -0.082 | -0.321 |
| 3103 | Zn | 21 | 0.618 | 0.409 | -0.208 | -0.337 |
| 3121 | Ag | 20 | 34.323 | 26.172 | -8.151 | -0.237 |
| 3121 | Au | 20 | 1.182 | 1.369 | 0.187 | 0.158 |
| 3121 | Cu | 20 | 0.119 | 0.112 | -0.006 | -0.051 |
| 3121 | Fe | 20 | 19.549 | 21.369 | 1.82 | 0.093 |
| 3121 | Pb | 20 | 0.48 | 0.308 | -0.172 | -0.358 |
| 3121 | Zn | 20 | 1.018 | 0.823 | -0.194 | -0.191 |
| 3191 | Ag | 77 | 41.141 | 35.812 | -5.329 | -0.13 |
| 3191 | Au | 77 | 1.713 | 1.714 | 0.001 | 0.001 |
| 3191 | Cu | 77 | 0.084 | 0.07 | -0.014 | -0.162 |
| 3191 | Fe | 77 | 16.96 | 16.823 | -0.137 | -0.008 |
| 3191 | Pb | 77 | 0.518 | 0.318 | -0.2 | -0.386 |
| 3191 | Zn | 77 | 1.206 | 0.879 | -0.328 | -0.271 |
| 3192 | Ag | 17 | 53.341 | 29.819 | -23.522 | -0.441 |
| 3192 | Au | 17 | 1.541 | 1.213 | -0.328 | -0.213 |
| 3192 | Cu | 17 | 0.072 | 0.047 | -0.025 | -0.344 |
| 3192 | Fe | 17 | 22.151 | 23.727 | 1.576 | 0.071 |
| 3192 | Pb | 17 | 0.375 | 0.153 | -0.222 | -0.592 |
| 3192 | Zn | 17 | 1.218 | 0.36 | -0.859 | -0.705 |
| 3193 | Ag | 16 | 23.467 | 20.547 | -2.92 | -0.124 |
| 3193 | Au | 16 | 1.202 | 0.869 | -0.333 | -0.277 |
| 3193 | Cu | 16 | 0.034 | 0.044 | 0.009 | 0.269 |
| 3193 | Fe | 16 | 16.45 | 25.233 | 8.783 | 0.534 |
| 3193 | Pb | 16 | 0.369 | 0.285 | -0.084 | -0.227 |
| 3193 | Zn | 16 | 1.061 | 1.512 | 0.451 | 0.425 |
| 3204 | Ag | 15 | 46.945 | 28.169 | -18.776 | -0.4 |
| 3204 | Au | 15 | 1.035 | 1.119 | 0.084 | 0.081 |
| 3204 | Cu | 15 | 0.083 | 0.039 | -0.044 | -0.531 |
| 3204 | Fe | 15 | 16.559 | 16.659 | 0.099 | 0.006 |
| 3204 | Pb | 15 | 0.351 | 0.219 | -0.132 | -0.375 |
| 3204 | Zn | 15 | 0.723 | 0.932 | 0.209 | 0.289 |
| 3205 | Ag | 15 | 21.495 | 31.025 | 9.53 | 0.443 |
| 3205 | Au | 15 | 0.343 | 0.224 | -0.12 | -0.348 |
| 3205 | Cu | 15 | 0.029 | 0.026 | -0.003 | -0.101 |
| 3205 | Fe | 15 | 16.537 | 15.825 | -0.712 | -0.043 |
| 3205 | Pb | 15 | 0.411 | 0.363 | -0.048 | -0.117 |
| 3205 | Zn | 15 | 1.311 | 1.138 | -0.173 | -0.132 |
| 3206 | Ag | 18 | 27.744 | 16.404 | -11.34 | -0.409 |
| 3206 | Au | 18 | 0.624 | 0.696 | 0.071 | 0.114 |
| 3206 | Cu | 18 | 0.049 | 0.05 | 0 | 0.008 |
| 3206 | Fe | 18 | 18.044 | 14.377 | -3.667 | -0.203 |
| 3206 | Pb | 18 | 0.354 | 0.267 | -0.087 | -0.245 |
AYA GOLD & SILVER INC., BOUMADINE POLYMETALLIC PROJECT 480
| | | | | | | | | | | | | | | | | | | | |
| 3206 | Zn | 18 | 1.301 | 1.001 | -0.3 | -0.231 |
| 3207 | Ag | 10 | 23.048 | 14.677 | -8.371 | -0.363 |
| 3207 | Au | 10 | 0.948 | 0.886 | -0.062 | -0.065 |
| 3207 | Cu | 10 | 0.088 | 0.078 | -0.011 | -0.119 |
| 3207 | Fe | 10 | 25.692 | 24.156 | -1.535 | -0.06 |
| 3207 | Pb | 10 | 0.528 | 0.234 | -0.294 | -0.556 |
| 3207 | Zn | 10 | 1.044 | 0.485 | -0.559 | -0.536 |
| 3222 | Ag | 20 | 20.483 | 24.554 | 4.07 | 0.199 |
| 3222 | Au | 20 | 0.451 | 0.391 | -0.061 | -0.135 |
| 3222 | Cu | 20 | 0.064 | 0.067 | 0.003 | 0.053 |
| 3222 | Fe | 20 | 14.246 | 11.592 | -2.654 | -0.186 |
| 3222 | Pb | 20 | 0.734 | 0.772 | 0.039 | 0.053 |
| 3222 | Zn | 20 | 1.599 | 1.18 | -0.419 | -0.262 |
| 3223 | Ag | 16 | 16.129 | 20.761 | 4.632 | 0.287 |
| 3223 | Au | 16 | 0.596 | 0.767 | 0.172 | 0.288 |
| 3223 | Cu | 16 | 0.037 | 0.04 | 0.003 | 0.085 |
| 3223 | Fe | 16 | 12.905 | 13.332 | 0.427 | 0.033 |
| 3223 | Pb | 16 | 0.685 | 0.753 | 0.068 | 0.099 |
| 3223 | Zn | 16 | 1.398 | 1.172 | -0.226 | -0.161 |
| 3224 | Ag | 13 | 22.829 | 17.866 | -4.963 | -0.217 |
| 3224 | Au | 13 | 0.591 | 0.349 | -0.242 | -0.409 |
| 3224 | Cu | 13 | 0.062 | 0.082 | 0.019 | 0.31 |
| 3224 | Fe | 13 | 15.994 | 11.613 | -4.381 | -0.274 |
| 3224 | Pb | 13 | 0.571 | 0.386 | -0.185 | -0.324 |
| 3224 | Zn | 13 | 1.752 | 1.235 | -0.517 | -0.295 |
| 3225 | Ag | 3 | 20.595 | 20.495 | -0.101 | -0.005 |
| 3225 | Au | 3 | 0.942 | 0.859 | -0.083 | -0.088 |
| 3225 | Cu | 3 | 0.115 | 0.117 | 0.002 | 0.02 |
| 3225 | Fe | 3 | 11.259 | 11.94 | 0.681 | 0.06 |
| 3225 | Pb | 3 | 1.477 | 1.413 | -0.063 | -0.043 |
| 3225 | Zn | 3 | 0.891 | 0.969 | 0.078 | 0.088 |
| 3226 | Ag | 19 | 17.715 | 15.868 | -1.848 | -0.104 |
| 3226 | Au | 19 | 0.376 | 0.341 | -0.035 | -0.092 |
| 3226 | Cu | 19 | 0.083 | 0.056 | -0.027 | -0.328 |
| 3226 | Fe | 19 | 11.317 | 9.155 | -2.161 | -0.191 |
| 3226 | Pb | 19 | 0.741 | 0.531 | -0.21 | -0.283 |
| 3226 | Zn | 19 | 1.142 | 1.02 | -0.122 | -0.107 |
| 3227 | Ag | 8 | 32.543 | 30.644 | -1.9 | -0.058 |
| 3227 | Au | 8 | 1.068 | 0.789 | -0.279 | -0.261 |
| 3227 | Cu | 8 | 0.05 | 0.052 | 0.001 | 0.023 |
| 3227 | Fe | 8 | 13.363 | 12.367 | -0.996 | -0.075 |
| 3227 | Pb | 8 | 0.288 | 0.193 | -0.095 | -0.329 |
| 3227 | Zn | 8 | 0.948 | 0.589 | -0.359 | -0.379 |
| 3230 | Ag | 3 | 24.961 | 28.679 | 3.719 | 0.149 |
| 3230 | Au | 3 | 0.371 | 0.354 | -0.017 | -0.045 |
| 3230 | Cu | 3 | 0.026 | 0.02 | -0.006 | -0.223 |
| 3230 | Fe | 3 | 8.5 | 7.062 | -1.437 | -0.169 |
| 3230 | Pb | 3 | 0.638 | 0.585 | -0.052 | -0.082 |
| 3230 | Zn | 3 | 0.903 | 0.809 | -0.094 | -0.104 |
| 3291 | Ag | 92 | 44.288 | 35.786 | -8.502 | -0.192 |
| 3291 | Au | 92 | 0.931 | 1.01 | 0.079 | 0.085 |
AYA GOLD & SILVER INC., BOUMADINE POLYMETALLIC PROJECT 481
| | | | | | | | | | | | | | | | | | | | |
| 3291 | Cu | 92 | 0.056 | 0.054 | -0.002 | -0.027 |
| 3291 | Fe | 92 | 18.019 | 17.327 | -0.692 | -0.038 |
| 3291 | Pb | 92 | 0.593 | 0.504 | -0.089 | -0.149 |
| 3291 | Zn | 92 | 1.124 | 1.014 | -0.11 | -0.098 |
| 3292 | Ag | 28 | 38.833 | 23.427 | -15.406 | -0.397 |
| 3292 | Au | 28 | 0.864 | 0.817 | -0.048 | -0.055 |
| 3292 | Cu | 28 | 0.046 | 0.037 | -0.009 | -0.193 |
| 3292 | Fe | 28 | 17.075 | 17.816 | 0.741 | 0.043 |
| 3292 | Pb | 28 | 0.431 | 0.262 | -0.169 | -0.392 |
| 3292 | Zn | 28 | 1.639 | 0.707 | -0.931 | -0.568 |
| 3293 | Ag | 41 | 24.417 | 20.73 | -3.687 | -0.151 |
| 3293 | Au | 41 | 0.541 | 0.534 | -0.007 | -0.013 |
| 3293 | Cu | 41 | 0.035 | 0.031 | -0.005 | -0.135 |
| 3293 | Fe | 41 | 16.022 | 13.445 | -2.578 | -0.161 |
| 3293 | Pb | 41 | 0.516 | 0.481 | -0.035 | -0.067 |
| 3293 | Zn | 41 | 1.051 | 0.8 | -0.251 | -0.239 |
| 3294 | Ag | 3 | 41.597 | 32.508 | -9.089 | -0.219 |
| 3294 | Au | 3 | 1.367 | 1.237 | -0.13 | -0.095 |
| 3294 | Cu | 3 | 0.091 | 0.054 | -0.037 | -0.406 |
| 3294 | Fe | 3 | 31.214 | 20.491 | -10.722 | -0.344 |
| 3294 | Pb | 3 | 0.056 | 0.047 | -0.009 | -0.162 |
| 3294 | Zn | 3 | 0.183 | 0.278 | 0.095 | 0.516 |
| 3295 | Ag | 33 | 34.646 | 37.046 | 2.4 | 0.069 |
| 3295 | Au | 33 | 0.328 | 0.292 | -0.035 | -0.108 |
| 3295 | Cu | 33 | 0.092 | 0.089 | -0.003 | -0.035 |
| 3295 | Fe | 33 | 16.446 | 16.928 | 0.481 | 0.029 |
| 3295 | Pb | 33 | 0.807 | 0.671 | -0.137 | -0.169 |
| 3295 | Zn | 33 | 1.368 | 1.399 | 0.031 | 0.022 |
| 3301 | Ag | 58 | 77.165 | 78.11 | 0.945 | 0.012 |
| 3301 | Au | 58 | 0.598 | 0.587 | -0.011 | -0.018 |
| 3301 | Cu | 58 | 0.098 | 0.081 | -0.017 | -0.172 |
| 3301 | Fe | 58 | 13.877 | 13.006 | -0.871 | -0.063 |
| 3301 | Pb | 58 | 0.559 | 0.471 | -0.088 | -0.158 |
| 3301 | Zn | 58 | 0.86 | 0.848 | -0.012 | -0.014 |
| 3402 | Ag | 5 | 11.989 | 10.624 | -1.365 | -0.114 |
| 3402 | Au | 5 | 0.329 | 0.386 | 0.057 | 0.172 |
| 3402 | Cu | 5 | 0.027 | 0.027 | -0.001 | -0.026 |
| 3402 | Fe | 5 | 11.929 | 11.712 | -0.217 | -0.018 |
| 3402 | Pb | 5 | 0.158 | 0.149 | -0.01 | -0.062 |
| 3402 | Zn | 5 | 0.474 | 0.529 | 0.055 | 0.116 |
| 3409 | Ag | 8 | 18.627 | 25.499 | 6.872 | 0.369 |
| 3409 | Au | 8 | 1.29 | 0.985 | -0.305 | -0.237 |
| 3409 | Cu | 8 | 0.018 | 0.023 | 0.005 | 0.296 |
| 3409 | Fe | 8 | 11.919 | 13.706 | 1.787 | 0.15 |
| 3409 | Pb | 8 | 0.304 | 0.233 | -0.071 | -0.234 |
| 3409 | Zn | 8 | 1.137 | 1.321 | 0.183 | 0.161 |
| 3410 | Ag | 6 | 28.02 | 12.419 | -15.601 | -0.557 |
| 3410 | Au | 6 | 0.659 | 0.839 | 0.18 | 0.274 |
| 3410 | Cu | 6 | 0.033 | 0.024 | -0.008 | -0.257 |
| 3410 | Fe | 6 | 19.76 | 17.426 | -2.333 | -0.118 |
| 3410 | Pb | 6 | 0.208 | 0.108 | -0.1 | -0.48 |
AYA GOLD & SILVER INC., BOUMADINE POLYMETALLIC PROJECT 482
| | | | | | | | | | | | | | | | | | | | |
| 3410 | Zn | 6 | 1.482 | 0.852 | -0.63 | -0.425 |
| 3411 | Ag | 10 | 17.61 | 15.394 | -2.216 | -0.126 |
| 3411 | Au | 10 | 0.638 | 0.715 | 0.077 | 0.121 |
| 3411 | Cu | 10 | 0.026 | 0.024 | -0.001 | -0.049 |
| 3411 | Fe | 10 | 12.875 | 12.856 | -0.019 | -0.001 |
| 3411 | Pb | 10 | 0.799 | 0.491 | -0.308 | -0.386 |
| 3411 | Zn | 10 | 1.38 | 1.273 | -0.106 | -0.077 |
| 3508 | Ag | 7 | 20.82 | 25.177 | 4.358 | 0.209 |
| 3508 | Au | 7 | 0.883 | 1.049 | 0.167 | 0.189 |
| 3508 | Cu | 7 | 0.017 | 0.018 | 0.001 | 0.048 |
| 3508 | Fe | 7 | 17.48 | 18.304 | 0.824 | 0.047 |
| 3508 | Pb | 7 | 0.587 | 0.753 | 0.166 | 0.283 |
| 3508 | Zn | 7 | 1.578 | 1.656 | 0.078 | 0.049 |
| 3600 | Ag | 20 | 24.782 | 18.132 | -6.649 | -0.268 |
| 3600 | Au | 20 | 0.506 | 0.492 | -0.014 | -0.028 |
| 3600 | Cu | 20 | 0.024 | 0.03 | 0.007 | 0.285 |
| 3600 | Fe | 20 | 11.078 | 10.522 | -0.556 | -0.05 |
| 3600 | Pb | 20 | 0.789 | 0.536 | -0.253 | -0.321 |
| 3600 | Zn | 20 | 1.871 | 1.446 | -0.425 | -0.227 |
| 4001 | Ag | 3 | 483.308 | 535.819 | 52.511 | 0.109 |
| 4001 | Au | 3 | 0.071 | 0.043 | -0.028 | -0.392 |
| 4001 | Cu | 3 | 2.447 | 1.795 | -0.652 | -0.266 |
| 4001 | Fe | 3 | 5.155 | 3.459 | -1.696 | -0.329 |
| 4001 | Pb | 3 | 0.094 | 0.114 | 0.02 | 0.21 |
| 4001 | Zn | 3 | 0.088 | 0.097 | 0.009 | 0.101 |
| 4002 | Ag | 3 | 81.507 | 38.259 | -43.248 | -0.531 |
| 4002 | Au | 3 | 0.01 | 0.01 | 0 | -0.002 |
| 4002 | Cu | 3 | 0.158 | 0.109 | -0.049 | -0.312 |
| 4002 | Fe | 3 | 3.666 | 2.996 | -0.67 | -0.183 |
| 4002 | Pb | 3 | 4.974 | 2.236 | -2.738 | -0.551 |
| 4002 | Zn | 3 | 6.715 | 4.543 | -2.172 | -0.323 |
| 4003 | Ag | 2 | 153.304 | 125.18 | -28.124 | -0.183 |
| 4003 | Au | 2 | 0.141 | 0.088 | -0.053 | -0.377 |
| 4003 | Cu | 2 | 0.594 | 0.391 | -0.203 | -0.342 |
| 4003 | Fe | 2 | 4.598 | 4.878 | 0.28 | 0.061 |
| 4003 | Pb | 2 | 7.782 | 5.972 | -1.809 | -0.233 |
| 4003 | Zn | 2 | 24.913 | 32.252 | 7.34 | 0.295 |
AYA GOLD & SILVER INC., BOUMADINE POLYMETALLIC PROJECT 483