
Nasdaq Hits a Record as Small Caps Fall Further Behind




On Monday, October 5, 2026, the Nasdaq Composite closed at a record 27,477.31, and on that same day 206 Nasdaq-listed stocks hit a new 52-week low while only 46 hit a new high. The index and the stocks inside it have been drifting apart since the summer, and the further we went into StockTitan’s price and short interest data the wider the gap looked.
By our count 54% of Nasdaq-listed stocks are at least 20% below their highest close since June, and more than half of US small caps fell 20% or more at some point in the same months. Short sellers have been building up too, and the median small cap now has a larger share of its stock sold short than at any point in our data, which begins in 2020.
Key numbers at a glance
On this page
- A record for the Nasdaq, four lows for every high
- How far small caps have fallen since the summer
- What the typical Nasdaq stock has done since June
- Which sectors took the hardest hit
- Short sellers have been adding to small caps for two years
- Why small caps are lagging: rates and yields
- Small caps are still up for the year
- How we measured it
- What this data does not tell you
- Frequently asked questions
A record for the Nasdaq, four lows for every high
The Nasdaq Composite rose 1.05% on October 5 to close at 27,477.31, a record, while the S&P 500 gained 0.66% and the Russell 2000, the most widely followed small-cap index, gained 0.50% to 2,847.14, according to Yahoo Finance’s market report. Nvidia closed at $238.90, above its previous record close of $235.74 from May 14. Judged by the index levels alone it was a good day for almost everyone.
The count of individual stocks told a different story. Of the 2,857 Nasdaq-listed common stocks with at least 200 sessions of trading history, 206 traded below their lowest price of the previous 52 weeks during the session and only 46 above their highest, so on the day the index set a record, new lows outnumbered new highs by more than four to one. Among US small caps (companies worth $300 million to $5 billion) there were 61 new lows and 28 new highs, more than two lows for every high, while the 670 US companies worth $10 billion or more were roughly even at 19 highs and 18 lows.
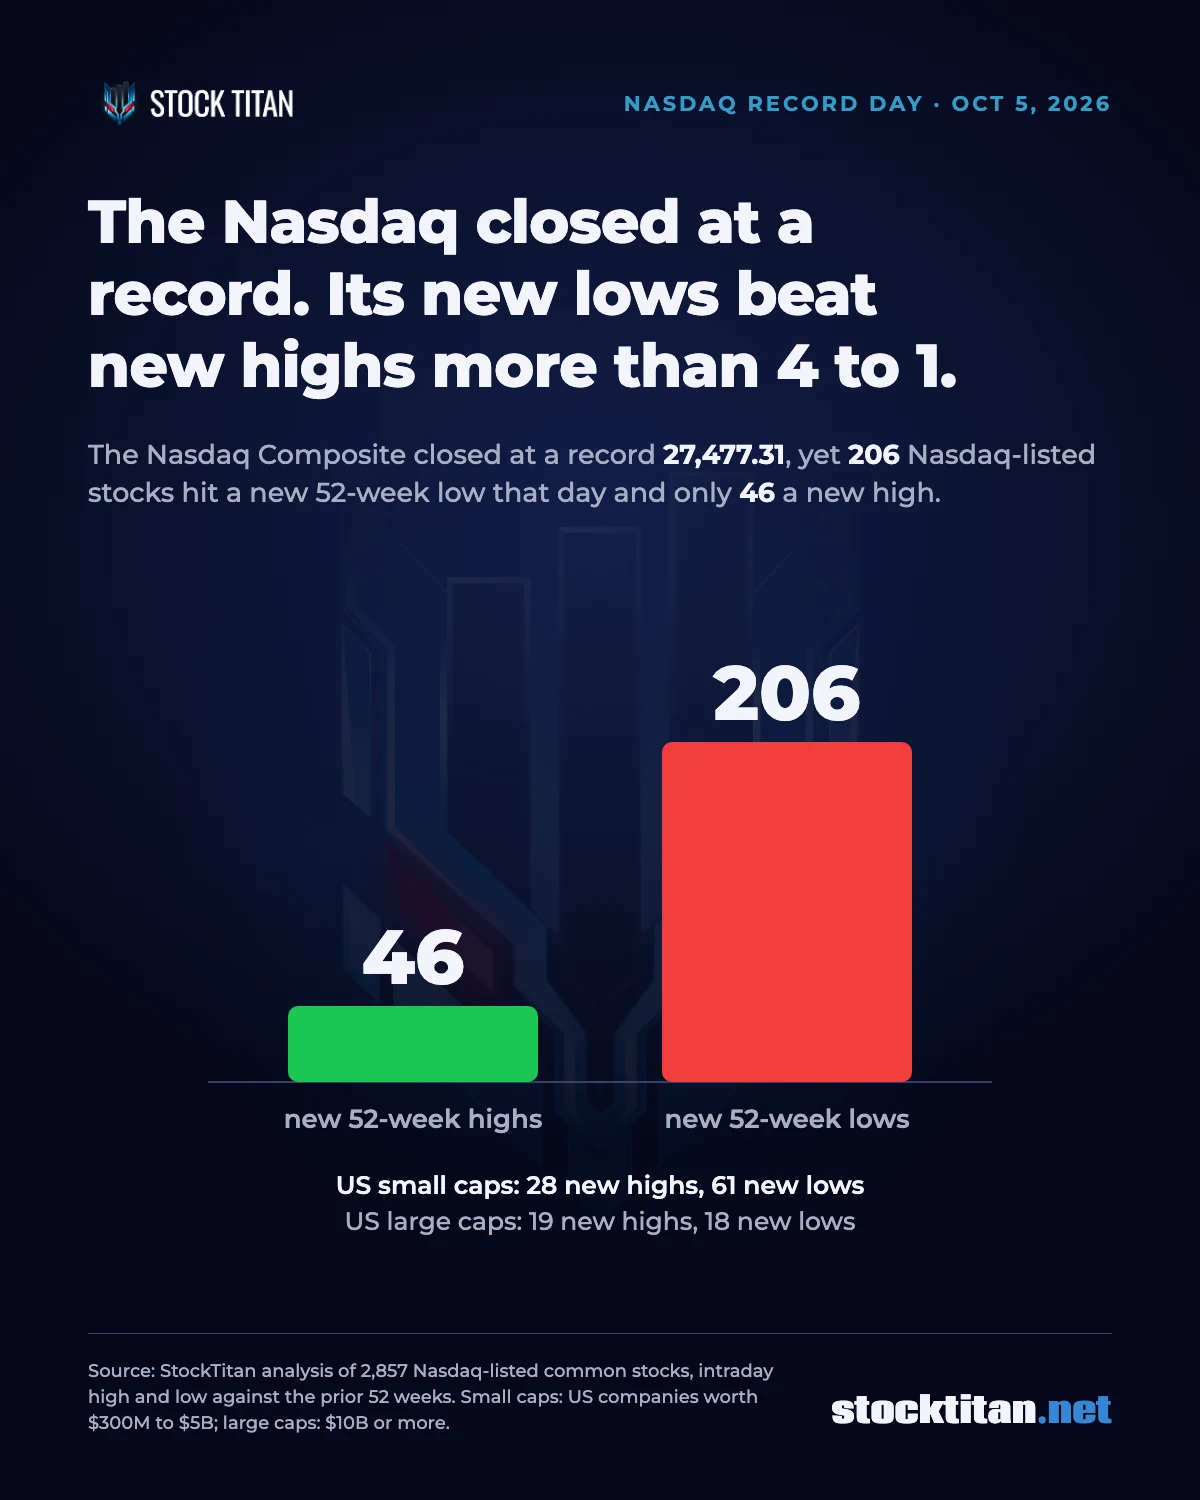
Each stock’s intraday high and low on October 5, 2026 compared with its intraday highs and lows over the previous 52 weeks, for stocks with at least 200 sessions of history. Source: StockTitan price data.
A record close next to a pile of new lows is possible because the Nasdaq Composite is weighted by market value. A company worth several trillion dollars moves the index far more than hundreds of small companies put together, so a strong day for a few of the largest stocks can carry the index to a new high while the median stock goes nowhere, or falls.
How far small caps have fallen since the summer
We measured every stock against its highest close between June 1 and October 5, 2026. By that yardstick, 42.1% of the 1,552 US small caps in our data closed on October 5 at least 20% below their summer high, and 22.7% were down 30% or more. Only 8.3% were within 2% of that high, while the Invesco QQQ Trust (QQQ), the fund that tracks the Nasdaq 100, closed exactly at its high for the period.
| Measure, June 1 to October 5, 2026 | US small caps | US large caps |
|---|---|---|
| Fell 20% or more at some point since June 1 | 57.5% | 40.1% |
| Closed October 5 at least 20% below their summer high | 42.1% | 22.9% |
| Closed October 5 at least 30% below their summer high | 22.7% | 7.2% |
| Within 2% of their summer high on October 5 | 8.3% | 10.3% |
| Trading below their 50-day average | 72.3% | 67.1% |
| Lower than on May 29 | 50.4% | 50.9% |
| Median price change since May 29 | -0.2% | -0.3% |
| Number of companies | 1,552 | 678 |
The last rows matter as much as the first ones. The median small cap and the median large cap are both roughly flat since the end of May, and about half of each group is lower, so the typical large company has not done better than the typical small one. What separates the two groups is how deep the falls went, with small caps far more likely to have dropped 20% or 30% along the way, and how the indexes are built. QQQ is up 2.4% since May 29 and the iShares Russell 2000 ETF (IWM) is down 2.4%, because a small group of the largest companies has gained enough to lift a market-value-weighted index on its own.
The first row is the one closest to the Wall Street shorthand of a bear market, which traders use loosely for a fall of 20% or more from a peak. By that informal yardstick, more than half of US small caps went through one of their own at some point in the past four months, even though the Russell 2000 as a whole did not; IWM closed October 5 about 7.1% below its 2026 closing high of August 14.
Mike Wilson, Morgan Stanley’s chief investment officer and chief US equity strategist, described the same pattern on September 28, saying on the bank’s Thoughts on the Market podcast that "more than half of the Russell 3000 is at least 20 percent below its June highs." His figure covers a different list of stocks a week earlier, so it is a second reading of the trend and it is not meant to match ours.
The numbers to remember: 206 new 52-week lows and 46 new highs among Nasdaq-listed stocks on a record day for the index; 57.5% of US small caps fell 20% or more at some point since June 1; only 8.3% of them are within 2% of their summer high.
What the typical Nasdaq stock has done since June
The split reaches well beyond small caps. Across 2,701 Nasdaq-listed common stocks of every size, 54.2% closed on October 5 at least 20% below their highest close since June 1, and 59.3% were lower than on May 29. The median Nasdaq-listed stock fell 6.5% over that stretch, while QQQ rose 2.4% and closed at its high. Across that full list, which is where the typical Nasdaq stock sits, a loss since June has been the more common outcome.
The list includes many very small and foreign companies that never make it into the Nasdaq 100, and those weigh on the numbers. Restricting it to the 1,520 Nasdaq-listed companies worth at least $300 million gives a milder picture, with 41.3% of them 20% or more below their summer high, about half (49.4%) lower than at the end of May and a median change of +0.4%.
Which sectors took the hardest hit
Among small caps, most of the market took damage. In five of the ten sectors with enough companies to measure, roughly half or more of the stocks are at least 20% below their summer high, and in materials, consumer cyclical companies and industrials the figure is above 53%.
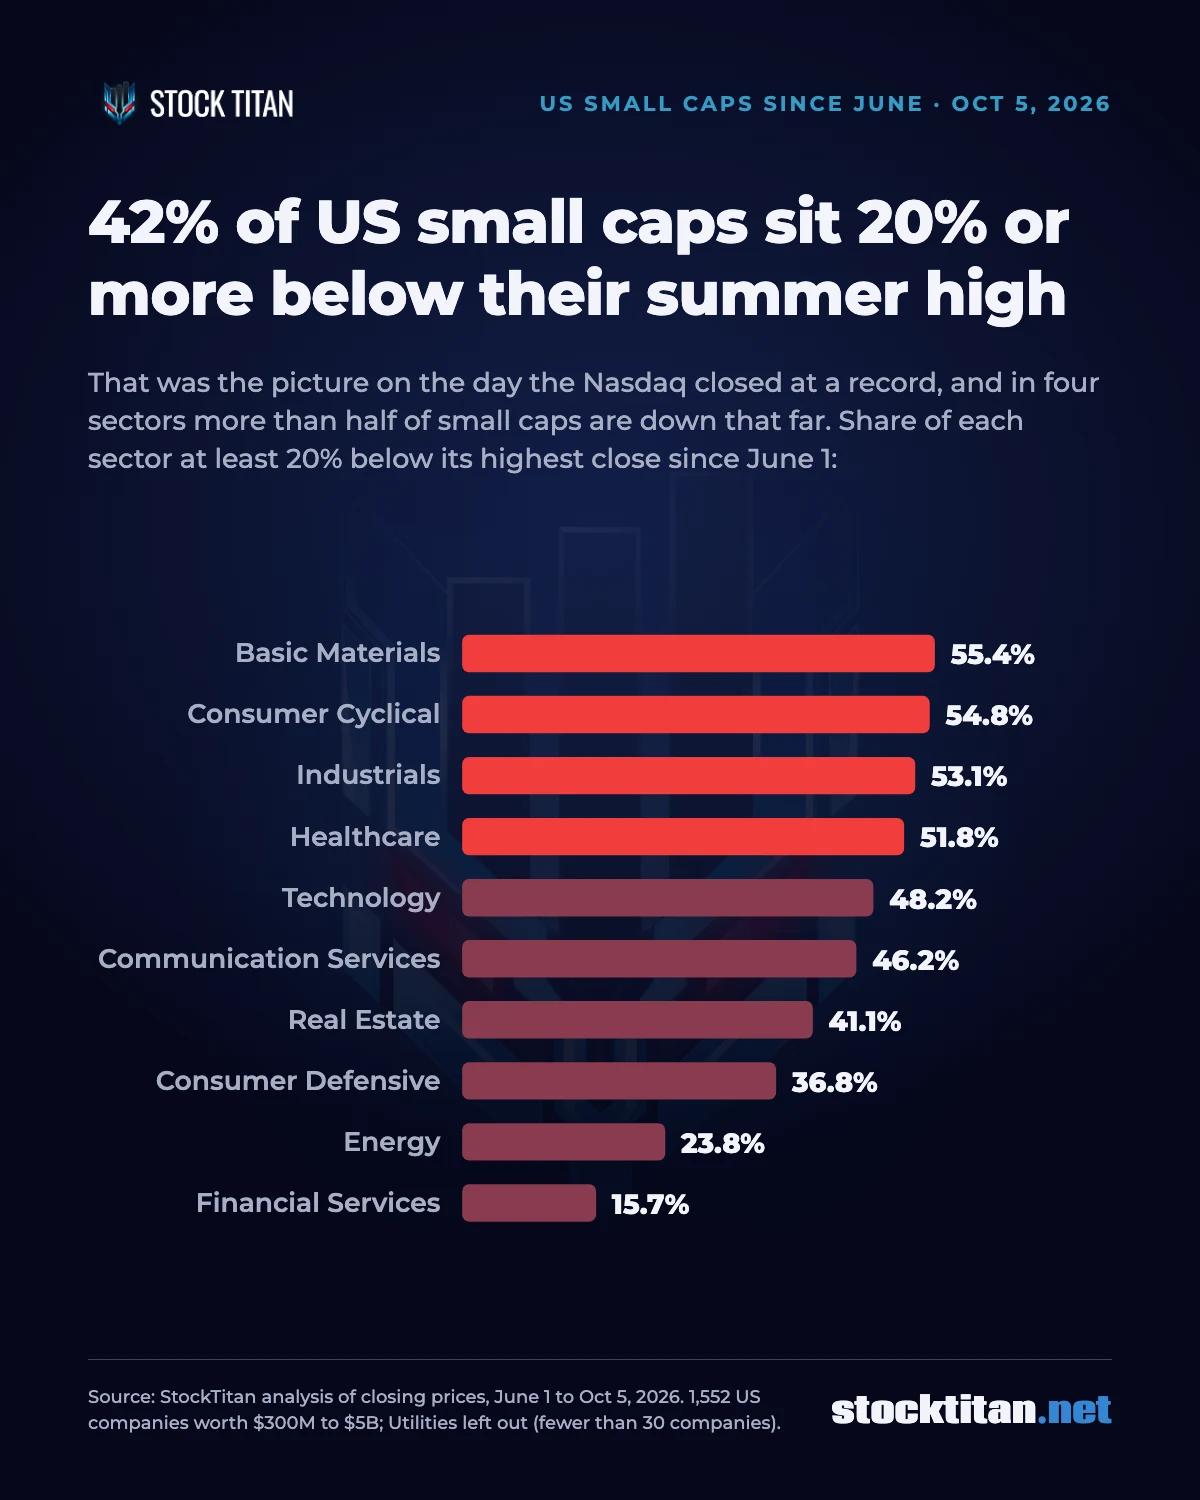
US companies worth $300 million to $5 billion, measured against their highest close from June 1 to October 5, 2026. Utilities had fewer than 30 small caps and are left out. Source: StockTitan price data.
Two sectors stand out for opposite reasons. Small financial companies held up far better than everything else, with only 15.7% of the 286 in our list 20% or more below their summer high, a median gain of 7.4% since May 29 (the best of any sector) and 68% still above their 200-day average. Healthcare shows how far apart winners and losers can be inside one group. Its median small cap is up 6.1% since May 29, yet 51.8% of the group sits at least 20% below its summer high and 70.6% fell that far at some point, a spread that tends to appear in sectors with many single-product biotech companies, where one trial result or share sale can move a stock by double digits.
Small technology companies had the largest share falling 20% or more at some point after June 1, at 76.7%. Their median price is roughly where it was at the end of May (up 0.2%), and 64% of them trade above their 200-day average, second only to financials, so the group fell hard and then recovered part of the way.
Short sellers have been adding to small caps for two years
Short interest is the number of shares that investors have borrowed and sold, usually to profit from a fall in price or to hedge another position, and broker-dealers report it to FINRA twice a month. For the 1,326 small caps where we can match FINRA’s figures to the share count in a company’s SEC filings, the median short position reached 6.96% of shares outstanding on the September 15 settlement date. That is the highest median in our data, which starts in March 2020, and three times the 2.32% of December 31, 2021.
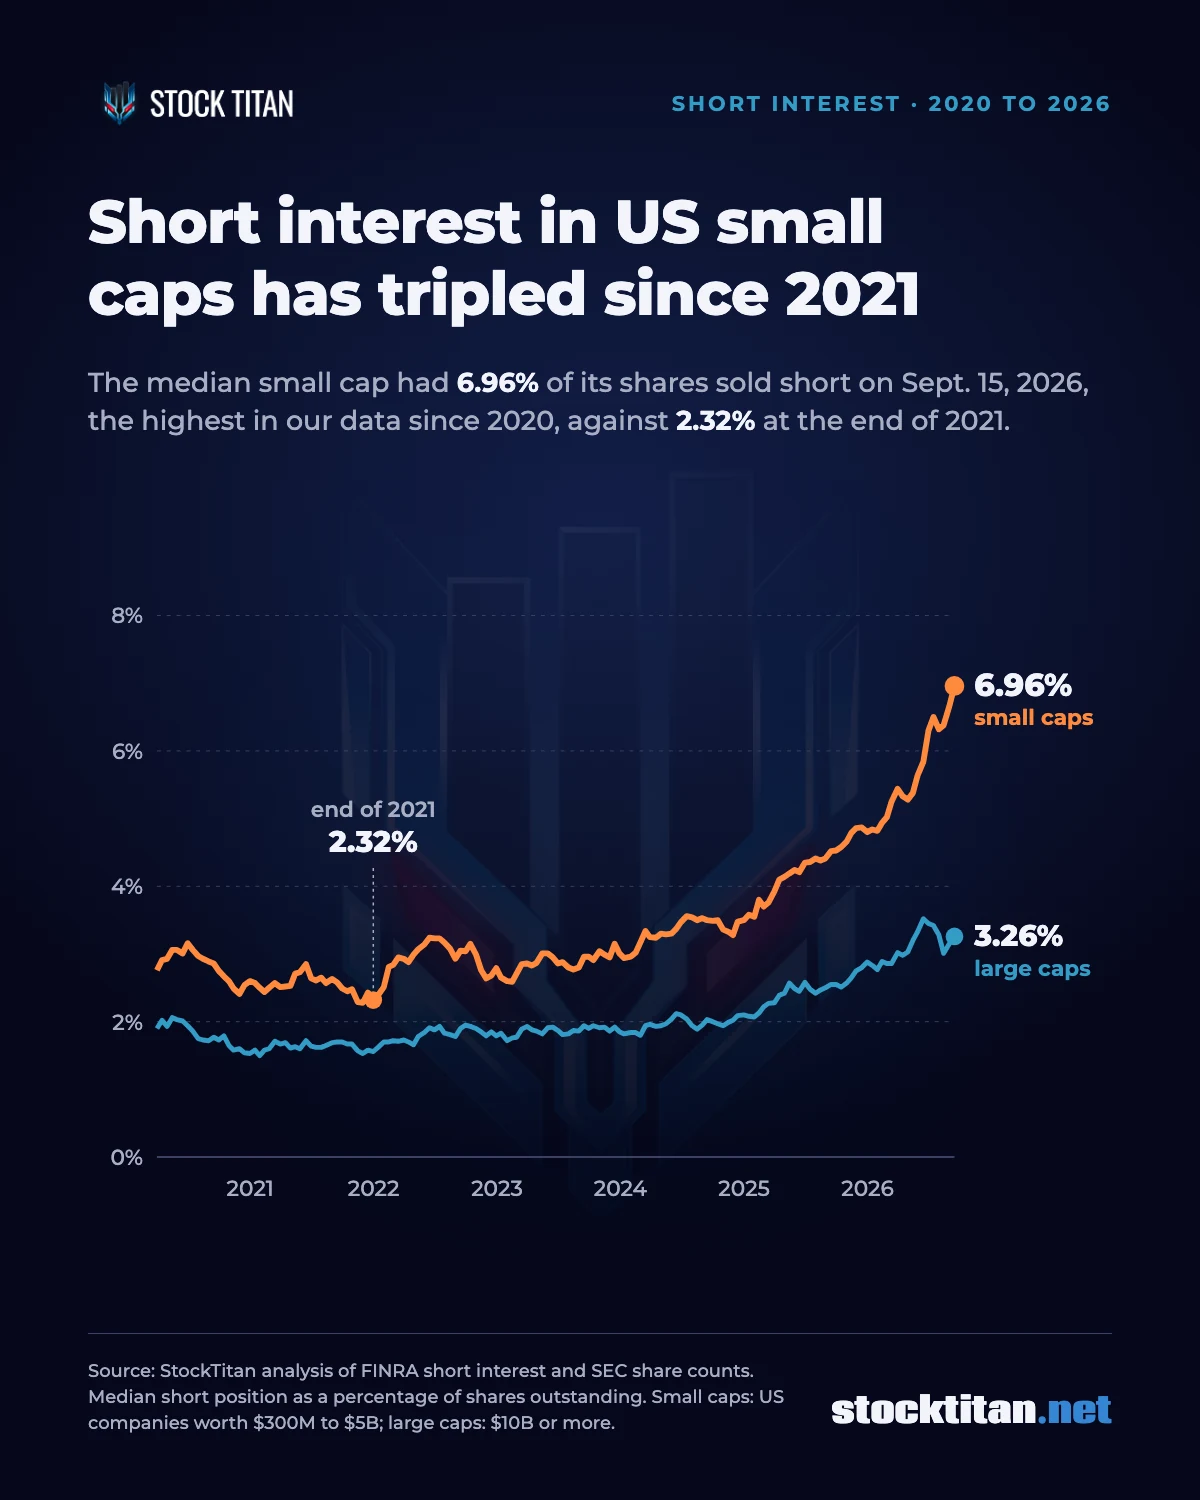
FINRA short positions at each twice-monthly settlement date divided by the shares outstanding in each company’s most recent quarterly or annual report. The lines follow the companies that are small caps and large caps today. Source: FINRA short interest data and SEC filings, compiled by StockTitan.
The climb did not start this autumn. Median small-cap short interest was 3.47% at the end of June 2024 and 4.53% at the end of September 2025, and it has risen at 17 of the 22 settlements since. It stood at 6.38% on August 14, the day IWM posted its highest close of 2026, well above where it began the summer, and it has kept rising since small caps turned lower. A few other ways to see the same change:
- 30.5% of small caps now have at least 10% of their shares sold short, against 6.7% at the end of 2021, which takes the share from about 1 in 15 to nearly 1 in 3.
- Across the 1,552 small caps in our price analysis, about $237 billion of stock was sold short on September 15, roughly 8.5% of their combined market value.
- FINRA’s days-to-cover figure, which divides the short position by average daily trading volume and so does not depend on our share counts, has a median of 6.3 days for small caps, up from 3.6 at the end of 2021.
- Large caps have risen too, from 1.56% at the end of 2021 to 3.26%, so small caps now carry a little more than twice the short interest of their larger peers, up from about one and a half times.
A high short interest is easy to read as a crowd of investors betting against small companies, and some of it is exactly that. Part of it, which FINRA’s data cannot separate out, comes from hedging, such as funds that buy a company’s convertible bonds and short its stock against them, or traders who own a small-cap ETF and short some of its members. The heavy positioning has also not worked as a timing signal this year, since short interest rose through the summer rally in small caps and through the sell-off that followed.
Checking the trend for survivorship bias: the lines above follow companies that are listed today, which leaves out the ones that were acquired or went out of business along the way. Running the same calculation across every exchange-listed company of any size with SEC share data at each date, including companies since delisted, gives a median of 1.69% in June 2023 and 3.73% on September 15, 2026, the highest of the dates we tested. The direction of the rise does not come from the way the list was built, though on that broader measure the median roughly doubled rather than tripled.
Why small caps are lagging: rates and yields
The explanation strategists commonly give is interest rates, as CNBC reported. Smaller companies tend to rely more on borrowing to grow, so they feel higher borrowing costs sooner than large companies with cash piles and long-dated bonds. "It’s all about interest rates," Sam Stovall, chief investment strategist at CFRA Research, told CNBC on September 29, adding that when rates go up, "it tends to be a bigger drag on the finances" of small caps.
The rate backdrop shifted sharply this quarter. The Federal Reserve raised its target range to 3.75% to 4.00% on September 16, its first increase since 2023 (our article on the September Fed hike covers the decision), and the 10-year Treasury yield closed at 5.31% on October 5, which Yahoo Finance described as near its highest levels since 2002. CNBC reported on September 29 that the Russell 2000 was on track to trail the S&P 500 by more than 9 percentage points in the third quarter, which would be the steepest gap since the first quarter of 2020. The funds that track the two indexes finished the quarter close to that, with IWM down 7.5% from June 30 to September 30 and the SPDR S&P 500 ETF (SPY) up 2.1%.
The timing fits that account, though a price series cannot prove a cause on its own, and the picture is a little more complicated than yields alone. In the same September 28 podcast Wilson noted that "breadth improved through most of the summer even as crude and yields moved higher," and placed the turn later, at the Federal Reserve Bank of Kansas City’s annual Jackson Hole conference in late August. "The deterioration came after Jackson Hole," he said. "That’s when markets began discounting a more hawkish Fed reaction function." IWM had posted its 2026 closing high on August 14.
Small caps are still up for the year
None of this means small caps have had a bad 2026 overall. IWM is up 15.1% since December 31, 2025, which is still ahead of SPY’s 13.6%, though behind the 23.1% gain in QQQ. On price alone the fund also rose 15.1% in 2023, 10.1% in 2024 and 11.4% in 2025, so small caps are on course for a fourth straight year of double-digit gains if 2026 ends near current levels. The change since mid-August is one of direction, and the figures in this article describe a pullback from a summer peak inside a year that is still positive.
Key point: the Nasdaq record and the small-cap slide are both true at the same time. The index measures where the money is, and a small group of the largest companies, led by Nvidia and Microsoft, has gained enough to carry it, while the typical stock shows what most companies have done, and since June more of them have fallen than risen.
How we measured it
- Universe: common stocks listed on the Nasdaq, NYSE, NYSE American and Cboe exchanges, with market values from StockTitan’s market cap rankings as of October 5, 2026. Warrants, units, rights, preferred shares, blank-check and shell companies, and closed-end funds and similar listed investment funds are excluded, as are stocks without a closing price on both May 29 and October 5.
- Size groups: small caps are US-based companies worth $300 million to $5 billion (1,552 companies), a range close to the one the Russell 2000 covers, though not its official membership. Large caps are US companies worth $10 billion or more (678). The Nasdaq figures include companies of every size and country listed on that exchange.
- Price measures: drawdowns use daily closing prices adjusted for stock splits, and the summer high is the highest close from June 1 to October 5, 2026. New 52-week highs and lows follow the exchange convention: a stock counts when its intraday high (or low) on October 5 went beyond every intraday high (or low) of the previous 52 weeks, and stocks with fewer than 200 sessions of history are left out. Measured on closing prices instead, the Nasdaq count is 66 highs and 231 lows.
- Nasdaq-wide figures: for the percentages we left out 262 stocks with a recorded stock split or a single-day jump of more than 150% or drop of more than 60% since June, since those can distort a price history; including them raises the share 20% or more below the summer high from 54.2% to 57.5%. The 52-week high and low counts keep those stocks, since a new high or low is measured on a single day’s prices.
- Short interest: FINRA’s twice-monthly short positions divided by the shares outstanding in each company’s most recent 10-Q or 10-K, using only reports for periods that ended within 200 days before the settlement date. Our FINRA records begin with the March 31, 2020 settlement. The latest settlement in our data is September 15, 2026; FINRA’s September 30 figures were not yet published when this article was written.
StockTitan’s editorial policy explains how we source and check articles like this one.
What this data does not tell you
- Our small-cap group is close to the Russell 2000 but it is a different list, so its numbers will not match the index provider’s.
- Stocks that were delisted or acquired after May are missing from the price figures, which probably makes the damage look slightly smaller than it was.
- Short interest includes hedges as well as outright bets against a company, and the data cannot tell them apart. A high reading describes how investors are positioned and carries no information on its own about where prices go next.
- The figures describe the past four months and say nothing about whether the gap between the largest companies and everyone else will narrow from here.
Frequently asked questions
Why are small-cap stocks underperforming in 2026?
Strategists most often point to interest rates. The Fed raised rates on September 16, 2026 for the first time since 2023, the 10-year Treasury yield reached 5.31% on October 5, and smaller companies tend to rely more on borrowing. CNBC reported that the Russell 2000 was on track to trail the S&P 500 by more than 9 percentage points in the third quarter, the steepest gap since early 2020, and IWM finished the quarter down 7.5% against a 2.1% gain for SPY.
Is the Russell 2000 in a bear market?
The index is not; IWM, the largest fund tracking it, closed October 5 about 7.1% below its 2026 high of August 14. Many of the stocks in that size range are another matter. In our count, 42.1% of US small caps are at least 20% below their highest close since June, and 57.5% fell 20% or more at some point after June 1.
How can the Nasdaq hit a record while most stocks are down?
The Nasdaq Composite is weighted by market value, so the largest companies dominate its moves. On October 5 it closed at a record 27,477.31 even though 54.2% of Nasdaq-listed common stocks were at least 20% below their summer highs, and 206 Nasdaq-listed stocks hit a new 52-week low that day against 46 new highs.
What does high short interest in small caps mean?
It means a larger share of small-company stock has been borrowed and sold. The median small cap had 6.96% of its shares sold short on September 15, 2026, up from 2.32% at the end of 2021 and the highest in our data, which begins in 2020. Some of that is investors expecting prices to fall and some is hedging, and the data does not separate the two. Short interest also rose both during the summer rally and the decline that followed, so this year it has not worked as a timing signal.
Are small caps up or down in 2026?
Still up. IWM has gained 15.1% since December 31, 2025, slightly more than SPY’s 13.6% and less than QQQ’s 23.1%. The weakness is concentrated in the weeks since mid-August.
Where can I check a stock’s short interest on StockTitan?
The short interest increase rankings list the stocks where FINRA-reported short positions grew most in the latest report, and each company’s overview page shows its float and short interest. Our guide to what short interest is and what it is not explains how to read the numbers, and our article on small-cap, mid-cap and large-cap categories covers how companies are grouped by size.
Sources
- StockTitan data: daily prices, FINRA short interest and SEC share counts as stored on October 5, 2026; market cap rankings; short interest increase rankings.
- Market reports: Yahoo Finance, October 5, 2026 (index levels and the 10-year yield); CNBC, September 29, 2026.
- Analysts and data providers: Morgan Stanley, Thoughts on the Market, September 28, 2026; FINRA equity short interest data.
- Related StockTitan articles: the September 2026 Fed rate hike; short interest explained; market cap categories.
The information provided in this article is for educational and informational purposes only. It does not constitute financial advice, investment recommendation, or an endorsement of any particular investment strategy. Past performance does not guarantee future results. Investors should conduct their own research and consult with a qualified financial advisor before making investment decisions.