
Aura Announces Q2 2026 and H1 2026 Financial and Operational Results, a Record First Half Result
Aura (NASDAQ:AUGO) reported record first-half 2026 results, with H1 production of 157,574 GEO, up 27% year over year, and on track with full-year guidance of 340k–390k GEO.
Rhea-AI Summary
Aura (NASDAQ:AUGO) reported record first-half 2026 results, with H1 production of 157,574 GEO, up 27% year over year, and on track with full-year guidance of 340k–390k GEO. Q2 2026 production was 75,437 GEO, down 8% sequentially but 18% above Q2 2025.
H1 2026 Net Revenue reached US$718.6 million (+104% YoY), and Adjusted EBITDA was US$440.5 million (+135% YoY). Q2 Net Revenue was US$336.0 million (+76% YoY, -12% QoQ); Q2 Adjusted EBITDA was US$196.7 million (+85% YoY, -19% QoQ). H1 Net Income totaled US$312.8 million versus a loss in H1 2025, with Q2 Net Income at US$217.7 million. Q2 AISC rose to US$1,985/GEO (+37% YoY), or US$1,653/GEO excluding MSG. Recurring free cash flow was US$175.1 million in H1 (+107% YoY). Net debt stood at US$168.0 million, 0.21x LTM Adjusted EBITDA. Aura also approved share repurchase programs of up to US$200 million through June 2027, advanced construction at Era Dorada, and completed the US$9.0 million sale of the São Francisco mine.
Positive
- Record H1 2026 production 157,574 GEO, up 27% YoY
- H1 2026 Net Revenue US$718.6 million, up 104% YoY
- H1 2026 Adjusted EBITDA US$440.5 million, up 135% YoY
- H1 2026 Net Income US$312.8 million versus a prior-year loss
- H1 2026 Recurring free cash flow US$175.1 million, up 107% YoY
- Low leverage Net Debt/Adjusted EBITDA LTM at 0.21x
- Share repurchase authorization up to US$200 million through June 18, 2027
Negative
- Q2 2026 production 75,437 GEO, down 8% quarter over quarter
- Q2 2026 Net Revenue US$336.0 million, down 12% QoQ
- Q2 2026 Adjusted EBITDA US$196.7 million, down 19% QoQ
- Q2 2026 AISC US$1,985/GEO, up 37% year over year
- MSG AISC US$5,277/GEO in Q2 2026, contributing to higher consolidated costs
- Net debt increase up US$52.8 million QoQ to US$168.0 million, driven by capex and shareholder returns
Details
News Market Reaction – AUGO
On Aug 6, the first trading day after this news, AUGO closed 0.20% below the previous close. Argus tracked a peak move of +7.6% during that session. Our momentum scanner recorded 50 alerts in the available session data.
Data tracked by StockTitan Argus for the Aug 6 session.
Key Figures
- H1 Production
- 157,574 GEO
- H1 2026; 27% higher year over year
- 2026 Production Guidance
- 340k–390k GEO
- Full-year 2026 guidance
- LTM Adjusted EBITDA
- US$802 million
- LTM through Q2 2026; 12th consecutive quarterly increase
- H1 Net Revenue
- US$718.6 million
- H1 2026; 104% higher year over year
- H1 AISC
- US$1,906/GEO
- H1 2026; 31% higher year over year
- Net Debt
- US$168,026 thousand
- Q2 2026; 0.21x Net Debt/LTM Adjusted EBITDA
- Share Repurchase Authorization
- US$200 million
- Approved June 2026; valid through June 18, 2027
- Era Dorada Earthmoving
- 60% complete
- Construction update as of August 2026
Previous Earnings Reports
-
Strong Q1 financial metrics and reiterated 2026 production guidance preceded a negative 24-hour reaction.
-
Record FY adjusted EBITDA, MSG acquisition completion, and 2026 production outlook preceded a negative reaction.
-
Record Q3 production, EBITDA, revenue, and lower AISC accompanied a positive reaction.
24h Move is the share-price change in the day after each event; other market factors may also have contributed.
Key Terms
gold equivalent ounces technical
adjusted EBITDA financial
AISC financial
MTM financial
AI-generated analysis. How Rhea-AI works. Not financial advice.




ROAD TOWN, British Virgin Islands, Aug. 05, 2026 (GLOBE NEWSWIRE) -- Aura Minerals Inc. (NASDAQ: AUGO) (B3: AURA33) (“Aura” or the “Company”) announces that it has filed its audited consolidated financial statements and earnings release (together, “Financial and Operational Results”) for the period ended June 30, 2026. The full version of the Financial and Operational Results can be viewed on the Company’s website at www.auraminerals.com, on SEDAR+ at www.sedarplus.ca. or on SEC www.sec.com.
Rodrigo Barbosa, Aura’s President, and CEO commented: “Aura delivered a record first half, producing 158k GEO in H1 2026. With second-half guidance of 182k to 232k GEO, we remain firmly on track with our full-year target of 340k to 390k GEO. Our LTM Adjusted EBITDA reached US
Operational & Financial Headlines Q2 2026 and H1 2026
| (US$ thousand) | Q2 2026 | Q1 2026 | QoQ Change % | Q2 2025 | YoY Change % | H1 2026 | H1 2025 | Change% | ||||||||
| Total Production (GEO) | 75,437 | 82,137 | -8 | % | 64,033 | 18 | % | 157,574 | 124,120 | 27 | % | |||||
| Total Sales (GEO) | 78,414 | 81,368 | -4 | % | 62,452 | 26 | % | 159,782 | 122,943 | 30 | % | |||||
| Net Revenue | 335,967 | 382,606 | -12 | % | 190,436 | 76 | % | 718,573 | 352,240 | 104 | % | |||||
| Gross Profit | 191,477 | 228,828 | -16 | % | 103,939 | 84 | % | 420,305 | 182,367 | 130 | % | |||||
| Gross Margin | 57 | % | 60 | % | -3 p.p. | 55 | % | 2 p.p. | 58 | % | 52 | % | 6 p.p. | |||
| Adjusted EBITDA | 196,659 | 243,868 | -19 | % | 106,224 | 85 | % | 440,527 | 187,703 | 135 | % | |||||
| Adjusted EBITDA Margin | 59 | % | 64 | % | -5 p.p. | 56 | % | 3 p.p. | 61 | % | 53 | % | 8 p.p. | |||
| Net Income | 217,687 | 95,158 | 129 | % | 8,147 | 2572 | % | 312,845 | (65,102 | ) | n.a. | |||||
| Net Income Margin | 65 | % | 25 | % | 40 p.p. | 4 | % | 61 p.p. | 44 | % | -18 | % | 62 p.p. | |||
| Adjusted Net Income | 97,414 | 109,464 | -11 | % | 36,834 | 164 | % | 201,332 | 63,737 | 216 | % | |||||
| Adjusted Net Income Margin | 29 | % | 29 | % | 0 p.p. | 19 | % | 10 p.p. | 28 | % | 18 | % | 10 p.p. | |||
| Cash Cost (US$/GEO) | 1,513 | 1,485 | 2 | % | 1,146 | 32 | % | 1,499 | 1,147 | 31 | % | |||||
| All In Sustaining cost (US$/GEO) | 1,985 | 1,829 | 9 | % | 1,449 | 37 | % | 1,906 | 1,455 | 31 | % | |||||
| Operating Cash Flow | 111,945 | 117,871 | -5 | % | 79,864 | 40 | % | 229,816 | 121,093 | 90 | % | |||||
| Net Debt/LTM Adjusted EBITDA | 0.21x | 0.16x | 0.05x | 0.81x | -0.60x | 0.21x | 0.81x | -0.59x | ||||||||
| Total CAPEX | 84,319 | 44,107 | 91 | % | 50,325 | 68 | % | 128,426 | 102,050 | 26 | % | |||||
Except as otherwise noted in this document, references herein to “US$” or and “$” are to thousands of United States dollars
Headlines
- Record First-Half Production: Q2 2026 total production reached 75,437 GEO, an
8% decrease compared to Q1 2026 and18% higher than Q2 2025 at current metal prices (at constant prices, -9% QoQ and +16% YoY). In H1 2026, Aura produced 157,574 GEO (158,448 GEO at constant prices), a27% increase over H1 2025 and the highest first-half production in the Company's history and is on track to deliver its consolidated guidance of 340k – 390k GEO in 2026. Q2 2026 and H1 2026 highlights:- Aranzazu: 17,882 GEO (+
14% QoQ at current prices; -20% YoY, due to mine plan), primarily reflecting metal price dynamics on GEO conversion; at constant prices, production was +8% QoQ, driven by higher grades from mine sequencing. In H1 2026, total production reached 33,576 GEO (-21% YoY) at current prices. At constant prices, Aranzazu produced 34,450 GEO (-21% YoY), mainly due to lower grades as expected in the mine sequencing. - Almas: 16,130 GEO (+
25% YoY; +2% QoQ), driven by higher ore processed volumes from the ongoing plant expansion. In H1 2026, production totaled 31,968 GEO (+23% YoY), driven mainly by20% higher ore moved volumes and30% higher ore plant feed, reflecting the results of the plant expansion. - Apoena, 5,704 GEO (-
24% QoQ; -31% YoY), due to mine sequencing, in line with the Company's plan to achieve higher grades in the Nosde Pit during the second half of the year. In H1 2026, total production was 13,229 GEO, (-23% YoY), mainly due to lower ore plant feed and lower grades. - Borborema, 14,251 GEO (-
17% QoQ), also driven by lower grades due to mine sequencing, as expected. In H1 2026, the total production was 31,352 GEO, higher than the same period of last year, considering that the commercial production of Borborema started in Q2 2025. - Minosa, 14,284 GEO (-
18% QoQ; -21% YoY), due to the increase in stacking level within the leach pad and lower ore plant feed. In H1 2026, production totaled 31,683 GEO (-11% YoY), mainly due to these impacts in Q2 2026. - MSG, 7,186 GEO (-
16% QoQ), as Aura continues to invest in underground infrastructure and primary development to invert the mining method to bottom-up. In H1 2026, production reached 15,766 GEO.
- Aranzazu: 17,882 GEO (+
- Sales Volumes: Q2 2026 sales were 78,414 GEO, a
4% decrease QoQ but a26% increase YoY at current prices, mainly due to better sales at Almas, Borborema now under commercial production, and the addition of MSG. In H1 2026, Aura sold 159,782 GEO, up30% YoY. - Net Revenues: Q2 reached US
$335,967 , down12% QoQ and up76% YoY, driven by gold prices and production fluctuations. In H1 2026, Net Revenue was US$718,573 , up104% compared to the same period of last year.- Average realized gold prices: Q2 2026: US
$4,304 /oz (-11% QoQ, +35% YoY). H1 2026: US$4,566 /oz (+53% YoY). - Average realized copper prices: Q2 2026: US
$6.09 /lb (+5% QoQ, +41% YoY). H1 2026: US$5.95 /lb (+39% YoY).
- Average realized gold prices: Q2 2026: US
- Adjusted EBITDA: Q2 hit US
$196,659 , down19% QoQ and up85% YoY. Driven by changes in production/sales and gold prices between the periods. In H1 2026, Adjusted EBITDA hit US$ 440,527 , up135% YoY. - AISC Performance: Q2 2026 AISC was US
$1,985 /GEO, up9% QoQ and37% YoY, largely driven by MSG (US$5,277 /GEO, +41% ) as Aura focused the quarter on preparing the mine and advancing on primary development as part of the Company’s plan to shift the mining method to bottom-up. Excluding this impact, Aura’s AISC would have been US$1,653 /GEO, up5% QoQ and14% YoY, reflecting the mine sequencing at Almas and Apoena, and lower production at Minosa. These results were partially offset by a decrease at Borborema. In H1 2026, AISC was US$1,906 /GEO (+31% YoY) and US$1,615 /GEO ex-MSG and the Company remains on track to deliver its AISC Guidance of US$1,720 -US$1,865 in 2026, including MSG. - Recurring Free Cash Flow: Q2 2026 US
$80,230 , -15% QoQ, as lower EBITDA, increased CAPEX (+49% QoQ as part of the Company’s plan and Guidance), and higher realized losses on gold hedges (+12% , to US$37.2 million ) had a bigger impact than favorable changes in working capital and21% lower taxes paid. Compared to Q2 2025, RFCF increased by33% mainly related to the higher sales and gold prices. In H1 2026, US$ 175,083 , +107% YoY. - Net Income: a record US
$217.7 million , +129% QoQ with lower current income taxes. Net Income was +2,572% YoY, benefited from an Operating Income of US$175.3 million (+93% YoY). Both periods were materially impacted by non-cash gains related to the MTM of gold collars.- Excluding non-cash gain, mainly related to the MTM of gold collars, adjusted Net Income was US
$97.4 million , -11% QoQ and +164% YoY, for the reasons discussed above.
- Excluding non-cash gain, mainly related to the MTM of gold collars, adjusted Net Income was US
- Net Debt Position and Financial Leverage: Q2 2026 Net Debt of US
$168,026 (0.21x Net Debt/Adjusted EBITDA LTM), an increase QoQ of US$52.8 million due to dividends and shares buybacks of US$67.7 million and expansion capex of US$53.5 million , partially compensated by Recurring Free Cash Flow of US$80.2 million .
OTHER UPDATES:
Repurchase Program: In June 2026, Aura's Board approved share repurchase programs for the Company's common shares and Brazilian Depositary Receipts. Aura may repurchase up to an aggregate US
2025 Sustainability Report: In May 2026, Aura announced its 6th Annual Sustainability Report showcasing the Company’s progress in promoting safety, responsibility, sustainability, and innovation, prepared with reference to Global Reporting Initiative (GRI) standards, the report ensures clear and transparent disclosure of Aura’s financial, environmental, and social performance. The full report can be found on “Sustainability - Aura Minerals” on Aura’s website.
Advancing Construction, Environment, and Community at Era Dorada: the project continues to advance on all fronts toward becoming a new standard for sustainable mining. Following full Board approval in April 2026, construction is progressing on schedule, with earthmoving at
Sale Agreement to São Francisco Mine: In May 2026, Aura completed the previously announced sale of the São Francisco Mine (part of the Apoena Mine complex) for a total purchase price of
Results Teleconference:
Date: August 6, 2026
Time: 11 a.m. (Brasília) | 10 a.m. (New York and Toronto)
Link to access: Click here
2. Consolidated Financial Results
2.1 Total Production and Sales (GEO)
| (GEO) | Q2 2026 | Q1 2026 | QoQ Change % | Q2 2025 | YoY Change % | H1 2026 | H1 2025 | Change% | |||
| Production | |||||||||||
| Aranzazu | 17,882 | 15,694 | 14 | % | 22,281 | -20 | % | 33,576 | 42,737 | -21 | % |
| Apoena | 5,704 | 7,525 | -24 | % | 8,219 | -31 | % | 13,229 | 17,095 | -23 | % |
| Minosa | 14,284 | 17,399 | -18 | % | 18,039 | -21 | % | 31,683 | 35,693 | -11 | % |
| Almas | 16,130 | 15,838 | 2 | % | 12,917 | 25 | % | 31,968 | 26,018 | 23 | % |
| Borborema | 14,251 | 17,101 | -17 | % | 2,577 | 453 | % | 31,352 | 2,577 | 1117 | % |
| MSG | 7,186 | 8,580 | -16 | % | 0 | n.a. | 15,766 | 0 | n.a. | ||
| Total | 75,437 | 82,137 | -8 | % | 64,033 | 18 | % | 157,574 | 124,120 | 27 | % |
| (GEO) | Q2 2026 | Q1 2026 | QoQ Change % | Q2 2025 | YoY Change % | H1 2026 | H1 2025 | Change% | |||
| Sales | |||||||||||
| Aranzazu | 17,764 | 16,218 | 10 | % | 22,290 | -20 | % | 33,982 | 42,746 | -21 | % |
| Apoena | 5,704 | 7,525 | -24 | % | 8,219 | -31 | % | 13,229 | 17,627 | -25 | % |
| Minosa | 15,296 | 17,465 | -12 | % | 17,836 | -14 | % | 32,762 | 35,362 | -7 | % |
| Almas | 17,920 | 14,048 | 28 | % | 12,917 | 39 | % | 31,968 | 26,018 | 23 | % |
| Borborema | 14,539 | 16,609 | -12 | % | 1,190 | 1122 | % | 31,148 | 1,190 | 2518 | % |
| MSG | 7,190 | 9,503 | -24 | % | - | n.a. | 16,698 | 0 | n.a. | ||
| Total | 78,414 | 81,368 | -4 | % | 62,452 | 26 | % | 159,782 | 122,943 | 30 | % |
Apply the metal sale prices in Aranzazu realized during Q2 2026: Copper price = US
Total production in Q2 2026 reached 75,437 gold equivalent ounces ("GEO"), an
Compared to Q2 2025 production, the growth was mainly attributable to: (i) Declaration of commercial production at Borborema during Q3 2025; (ii) the addition of MSG; and (iii) Almas, up
In H1 2026, production reached a record 157,574 GEO, the highest first-half production in Aura's history, a
2.2. Net Revenue
| (US$ thousand) | Q2 2026 | Q1 2026 | QoQ Change % | Q2 2025 | YoY Change % | H1 2026 | H1 2025 | Change% | |||
| Aranzazu | 74,825 | 69,178 | 8 | % | 62,508 | 20 | % | 144,003 | 112,770 | 28 | % |
| Apoena | 25,376 | 35,814 | -29 | % | 26,711 | -5 | % | 61,190 | 53,064 | 15 | % |
| Minosa | 64,286 | 80,020 | -20 | % | 55,776 | 15 | % | 144,306 | 103,838 | 39 | % |
| Almas | 79,322 | 68,693 | 15 | % | 41,751 | 90 | % | 148,015 | 78,878 | 88 | % |
| Borborema | 63,242 | 81,988 | -23 | % | 3,690 | 1614 | % | 145,230 | 3,690 | 3836 | % |
| MSG | 28,916 | 46,913 | -38 | % | n.a. | n.a. | 75,829 | n.a. | n.a. | ||
| Total | 335,967 | 382,606 | -12 | % | 190,436 | 76 | % | 718,573 | 352,240 | 104 | % |
In Q2 2026, the Company reported Net Revenue of US
In H1 2026, the Net Revenue was US
2.3. Cost and Gross Profit
| (US$ thousand) | Q2 2026 | Q1 2026 | QoQ Change % | Q2 2025 | YoY Change % | H1 2026 | H1 2025 | Change% | ||||||||
| Net Revenue | 335,967 | 382,606 | -12 | % | 190,436 | 76 | % | 718,573 | 352,240 | 104 | % | |||||
| Cost of goods sold | (144,490 | ) | (153,778 | ) | -6 | % | (86,497 | ) | 67 | % | (298,268 | ) | (169,873 | ) | 76 | % |
| Cost of production | (72,546 | ) | (83,528 | ) | -13 | % | (44,470 | ) | 63 | % | (156,074 | ) | (89,389 | ) | 75 | % |
| Cost of production – Contractors | (23,132 | ) | (16,589 | ) | 39 | % | (17,529 | ) | 32 | % | (39,721 | ) | (32,996 | ) | 20 | % |
| Direct mine and mill costs – Salaries | (22,944 | ) | (20,696 | ) | 11 | % | (9,550 | ) | 140 | % | (43,640 | ) | (18,676 | ) | 134 | % |
| Depreciation and amortization | (25,868 | ) | (32,965 | ) | -22 | % | (14,948 | ) | 73 | % | (58,833 | ) | (28,812 | ) | 104 | % |
| Gross Profit | 191,477 | 228,828 | -16 | % | 103,939 | 84 | % | 420,305 | 182,367 | 130 | % | |||||
| Gross Margin | 57 | % | 60 | % | -3 p.p. | 55 | % | 2 p.p. | 58 | % | 52 | % | 6 p.p. | |||
In Q2 2026, Cost of Goods Sold (COGS) totaled US
In the quarter, Gross Profit was US
In H1 2026, COGS totaled US
2.4. Cash Cost and All in Sustaining Costs
| (US$/GEO) | Q2 2026 | Q1 2026 | QoQ Change % | Q2 2025 | YoY Change % | H1 2026 | H1 2025 | Change% | |||
| Cash Cost | 1,513 | 1,485 | 2 | % | 1,146 | 32 | % | 1,499 | 1,147 | 31 | % |
| Aranzazu | 1,409 | 1,558 | -10 | % | 1,110 | 27 | % | 1,480 | 1,136 | 30 | % |
| Apoena | 1,886 | 1,380 | 37 | % | 1,168 | 61 | % | 1,598 | 1,200 | 33 | % |
| Minosa | 1,308 | 1,188 | 10 | % | 1,178 | 11 | % | 1,244 | 1,164 | 7 | % |
| Almas | 1,156 | 1,204 | -4 | % | 1,167 | -1 | % | 1,177 | 1,118 | 5 | % |
| Borborema | 991 | 1,200 | -17 | % | 936 | 6 | % | 1,103 | 936 | 18 | % |
| MSG | 3,852 | 2,900 | 33 | % | n.a. | n.a. | 3,310 | n.a. | n.a | ||
| All-in Sustaining Cost | 1,985 | 1,829 | 9 | % | 1,449 | 37 | % | 1,906 | 1,455 | 31 | % |
| Aranzazu | 1,897 | 2,046 | -7 | % | 1,514 | 25 | % | 1,969 | 1,529 | 29 | % |
| Apoena | 2,668 | 2,129 | 25 | % | 1,751 | 52 | % | 2,362 | 1,906 | 24 | % |
| Minosa | 1,545 | 1,370 | 13 | % | 1,292 | 20 | % | 1,452 | 1,271 | 14 | % |
| Almas | 1,626 | 1,376 | 18 | % | 1,364 | 19 | % | 1,516 | 1,279 | 19 | % |
| Borborema | 1,102 | 1,256 | -12 | % | 1,441 | -24 | % | 1,184 | 1,441 | -18 | % |
| MSG | 5,277 | 3,735 | 41 | % | n.a. | n.a. | 4,399 | n.a. | n.a | ||
In Q2 2026, Cash Cost was US
AISC totaled US
In H1 2026, Cash Cost was US
2.5. Operating Expenses
| (US$ thousand) | Q2 2026 | Q1 2026 | QoQ Change % | Q2 2025 | YoY Change % | H1 2026 | H1 2025 | Change% | ||||||||
| Gross Profit | 191,477 | 228,828 | -16 | % | 103,939 | 84 | % | 420,305 | 182,367 | 130 | % | |||||
| Operational Expenses | (16,176 | ) | (23,509 | ) | -31 | % | (12,937 | ) | 25 | % | (39,685 | ) | (24,703 | ) | 65 | % |
| General and administrative expenses | (22,477 | ) | (15,742 | ) | 43 | % | (11,284 | ) | 99 | % | (38,219 | ) | (20,920 | ) | 83 | % |
| Exploration expenses | (3,569 | ) | (2,359 | ) | 51 | % | (1,714 | ) | 108 | % | (5,928 | ) | (3,090 | ) | 92 | % |
| Other Income/Expenses | 9,870 | (5,408 | ) | n.a. | 61 | n.a. | 4,462 | (693 | ) | n.a. | ||||||
| Operating income | 175,301 | 205,319 | -15 | % | 91,002 | 93 | % | 380,620 | 157,664 | 141 | % | |||||
General and Administrative expenses increased
Exploration expenses totaled US
The Company recorded net Other Income of US
The Company thus ended Q2 2026 with Operating Income of US
For the H1 2026 period, Operating Income totaled US
2.6. Adjusted EBITDA
| (US$ thousand) | Q2 2026 | Q1 2026 | QoQ Change % | Q2 2025 | YoY Change % | H1 2026 | H1 2025 | Change% | ||||||||
| Operating Income | 175,301 | 205,319 | -15 | % | 91,002 | 93 | % | 380,620 | 157,664 | 141 | % | |||||
| Depreciation and Amortization | 26,529 | 33,141 | -20 | % | 15,283 | 74 | % | 59,670 | 29,346 | 103 | % | |||||
| Other Expenses | (9,870 | ) | 5,408 | n.a. | (61 | ) | n.a. | (4,462 | ) | 693 | n.a. | |||||
| Provision for contingent liabilities | 4,699 | 0 | n.a. | 0 | n.a | 4,699 | 0 | n.a. | ||||||||
| Adjusted EBITDA | 196,659 | 243,868 | -19 | % | 106,224 | 85 | % | 440,527 | 187,703 | 135 | % | |||||
| Aranzazu | 47,402 | 41,390 | 15 | % | 35,684 | 33 | % | 88,792 | 60,254 | 47 | % | |||||
| Almas | 56,159 | 49,720 | 13 | % | 24,709 | 127 | % | 105,879 | 47,136 | 125 | % | |||||
| Borborema | 47,297 | 60,939 | -22 | % | 2,084 | 2170 | % | 108,236 | 2,084 | 5094 | % | |||||
| Minosa | 43,249 | 58,105 | -26 | % | 33,533 | 29 | % | 101,354 | 60,646 | 67 | % | |||||
| Apoena | 13,675 | 24,274 | -44 | % | 16,151 | -16 | % | 37,949 | 29,697 | 28 | % | |||||
| MSG | (1,116 | ) | 17,440 | n.a | n.a. | n.a | 16,324 | n.a. | n.a | |||||||
| Corporate, Projects and Other | (10,007 | ) | (8,000 | ) | 25 | % | (7,581 | ) | 32 | % | (18,007 | ) | (12,114 | ) | 47 | % |
| Adjusted EBITDA Margin | 59 | % | 64 | % | -5 p.p. | 56 | % | 3 p.p. | 61 | % | 53 | % | 8p.p. | |||
Adjusted EBITDA was US
In the first half of 2026, Adjusted EBITDA reached US
2.7. Financial Result
| (US$ thousand) | Q2 2026 | Q1 2026 | QoQ Change % | Q2 2025 | YoY Change % | H1 2026 | H1 2025 | Change% | ||||||||
| EBIT | 175,301 | 205,319 | -15 | % | 90,941 | 93 | % | 380,620 | 158,357 | 141 | % | |||||
| Financial Result | 61,054 | (68,921 | ) | n.a. | (59,630 | ) | n.a. | (7,867 | ) | (181,241 | ) | -96 | % | |||
| Accretion expense | (1,981 | ) | (2,279 | ) | -13 | % | (1,134 | ) | 75 | % | (4,260 | ) | (2,800 | ) | 52 | % |
| Lease interest expense | (667 | ) | (810 | ) | -18 | % | (161 | ) | 314 | % | (1,477 | ) | (1,756 | ) | -16 | % |
| Interest expense on loans and debentures | (6,266 | ) | (6,387 | ) | -2 | % | (6,098 | ) | 3 | % | (12,653 | ) | (11,853 | ) | 7 | % |
| Finance cost on post-employment benefit | (595 | ) | (598 | ) | -1 | % | (747 | ) | -20 | % | (1,193 | ) | (1,085 | ) | 10 | % |
| Unrealized gain/(loss) with derivative gold collars | 0 | (24,105 | ) | n.a. | (24,304 | ) | n.a. | 0 | (124,514 | ) | n.a. | |||||
| Realized loss with derivative gold collars | (37,249 | ) | (33,325 | ) | 12 | % | (11,703 | ) | 218 | % | (70,574 | ) | (17,739 | ) | 298 | % |
| Loss on other derivative transactions | (1,981 | ) | (1,188 | ) | 67 | % | (1,305 | ) | 52 | % | (3,169 | ) | (3,132 | ) | 1 | % |
| Foreign exchange | (10,908 | ) | (73 | ) | n.a. | (2,462 | ) | 343 | % | (5,435 | ) | (5,638 | ) | -4 | % | |
| Change in liability measured at fair value | (1,935 | ) | (5,026 | ) | -62 | % | (4,025 | ) | -52 | % | (6,961 | ) | (6,384 | ) | 9 | % |
| Loss on settlement of liability with equity instruments | 0 | 0 | n.a. | (8,768 | ) | n.a. | - | (8,768 | ) | n.a. | ||||||
| Other finance costs | (4,622 | ) | (2,496 | ) | 85 | % | (297 | ) | n.a. | (7,118 | ) | (727 | ) | 879 | % | |
| Finance expenses | (66,204 | ) | (76,287 | ) | -13 | % | (61,004 | ) | 9 | % | (112,840 | ) | (184,396 | ) | -39 | % |
| Unrealized gain/loss with gold derivative | 126,013 | 0 | n.a. | 0 | n.a. | 101,908 | 0 | n.a. | ||||||||
| Foreign exchange | 0 | 5,546 | n.a. | 0 | n.a. | 0 | 0 | n.a. | ||||||||
| Interest income | 1,245 | 1,820 | -32 | % | 1,374 | -9 | % | 3,065 | 3,155 | -3 | % | |||||
| Finance income | 127,258 | 7,366 | 1628 | % | 1,374 | 9162 | % | 104,973 | 3,155 | 3227 | % | |||||
| Profit/ (loss) before income taxes | 236,355 | 136,398 | 73 | % | 31,372 | 653 | % | 372,753 | (23,577 | ) | n.a. | |||||
The Company’s Financial Result in Q2 2026 was a gain of US
- Unrealized gain on gold hedges of US
$126.0 in Q2 2026, arising from mark-to-market (MTM) adjustments related to outstanding gold hedge positions, reflecting decrease in gold prices between the start and the end of the quarter, which closed the quarter at US$4,008.02 per Oz, coming from US$4,646.60 per Oz at the start of the period. In accordance with IFRS standards, the Company records MTM adjustments at the end of each reporting period for all outstanding derivative positions. - Realized losses with gold hedges of US
$37.2 million in Q2 2026 were related to cash settlement of outstanding gold collars during the quarter, driven by the expiration of gold collars within the quarter. - Other finance costs include pre-payment fees related to liability management of certain loans of the Company.
In H1 2026, the Financial Result was US
- Unrealized gain on gold hedges of US
$101.9 in H1 2026, arising from mark-to-market (MTM) adjustments related to outstanding gold hedge positions, reflecting a decrease in gold prices between the start and the end of the semester, which closed the period at US$4,008.02 per Oz, coming from US$4,386.30 per Oz at the end of 2025.
Realized losses with gold hedges of US
2.8. Net Income
| (US$ thousand) | Q2 2026 | Q1 2026 | QoQ Change % | Q2 2025 | YoY Change % | H1 2026 | H1 2025 | Change% | ||||||||
| Profit/ (loss) before income taxes | 236,355 | 136,398 | 73 | % | 31,372 | 653 | % | 372,753 | (23,577 | ) | n.a. | |||||
| Total taxes | (18,668 | ) | (41,240 | ) | -55 | % | (23,225 | ) | -20 | % | (59,908 | ) | (41,525 | ) | 44 | % |
| Current income tax expense | (19,794 | ) | (47,409 | ) | -58 | % | (29,551 | ) | -33 | % | (67,203 | ) | (50,365 | ) | 33 | % |
| Deferred income tax expense | 1,126 | 6,169 | -82 | % | 6,326 | -82 | % | 7,295 | 8,840 | -17 | % | |||||
| Profit/(loss) for the period | 217,687 | 95,158 | 129 | % | 8,147 | 2572 | % | 312,845 | (65,102 | ) | n.a. | |||||
| Net Margin | 65 | % | 25 | % | 40 p.p. | 4 | % | 61 p.p. | 44 | % | -18 | % | n.a.. | |||
| Unrealized gain/(loss) with derivative gold collars | 126,013 | (24,105 | ) | n.a. | (24,304 | ) | n.a. | 101,908 | (124,514 | ) | n.a. | |||||
| Foreign Exchange | (10,908 | ) | (73 | ) | n.a. | (2,462 | ) | 343 | % | (5,435 | ) | (5,638 | ) | -4 | % | |
| Deferred taxes on non-monetary items | 5,168 | 9,872 | -48 | % | 6,847 | -25 | % | 15,040 | 10,081 | 49 | % | |||||
| Loss on settlement of liability with equity instruments | n.a. | n.a. | n.a. | (8,768 | ) | n.a. | n.a. | (8,768 | ) | n.a. | ||||||
| Adjusted Net Income | 97,414 | 109,464 | -11 | % | 36,834 | 164 | % | 201,332 | 63,737 | 216 | % | |||||
Net Income in Q2 2026 was US
In H1 2026, Net Income reached US
Adjusted Net Income
As a result of the increase in the Company's Operating Income, Adjusted Net Income in Q2 2026 was US
- Non-cash gain related to gold hedges: US
$126.0 million - FX losses: US
$(10.9) million - Deferred taxes over non-monetary items: US
$5.2 million
In H1 2026, Adjusted Net Income was US
- Non-cash gain related to gold hedges: US
$101.9 million - FX losses: US
$(5.4) million - Deferred taxes over non-monetary items: US
$15.0 million
3. Performance of the Operating Units
3.1 Aranzazu
| (US$ thousand) | Q2 2026 | Q1 2026 | QoQ Change % | Q2 2025 | YoY Change % | H1 2026 | H1 2025 | Change% | ||||||||
| Production at Constant Prices (GEO)¹ | 17,882 | 16,568 | 8 | % | 23,475 | -24 | % | 34,450 | 43,645 | -21 | % | |||||
| Production at Current Prices (GEO) | 17,882 | 15,694 | 14 | % | 22,281 | -20 | % | 33,576 | 42,737 | -21 | % | |||||
| Sales (GEO) | 17,764 | 16,218 | 10 | % | 22,290 | -20 | % | 33,982 | 42,746 | -21 | % | |||||
| Cash Cost (US$/GEO) | 1,409 | 1,558 | -10 | % | 1,110 | 27 | % | 1,480 | 1,136 | 30 | % | |||||
| AISC (US$/GEO) | 1,897 | 2,046 | -7 | % | 1,514 | 25 | % | 1,969 | 1,529 | 29 | % | |||||
| Net Revenue | 74,825 | 69,178 | 8 | % | 62,508 | 20 | % | 144,003 | 112,770 | 28 | % | |||||
| Cost of goods sold | (31,424 | ) | (32,479 | ) | -3 | % | (31,021 | ) | 1 | % | (63,903 | ) | (61,303 | ) | 4 | % |
| Gross Profit | 43,401 | 36,699 | 18 | % | 31,487 | 38 | % | 80,100 | 51,467 | 56 | % | |||||
| Expenses | (2,348 | ) | (3,755 | ) | -37 | % | (2,840 | ) | -17 | % | (6,103 | ) | (5,895 | ) | 4 | % |
| General and administrative expenses | (1,249 | ) | (1,587 | ) | -21 | % | (1,516 | ) | -18 | % | (2,836 | ) | (3,290 | ) | -14 | % |
| Exploration expenses | (1,146 | ) | (935 | ) | 23 | % | (794 | ) | 44 | % | (2,081 | ) | (1,503 | ) | 38 | % |
| Other income (expenses) | 47 | (1,233 | ) | n.a. | (530 | ) | n.a. | (1,186 | ) | (1,102 | ) | 8 | % | |||
| EBIT | 41,053 | 32,944 | 25 | % | 29,177 | 41 | % | 73,997 | 46,674 | 58 | % | |||||
| Adjusted EBITDA | 47,402 | 41,390 | 15 | % | 35,684 | 33 | % | 88,792 | 60,254 | 47 | % | |||||
| Financial Result | (2,310 | ) | (36 | ) | 6317 | % | (4,292 | ) | -46 | % | (2,346 | ) | (3,796 | ) | -38 | % |
| Financial Income | 51 | 113 | -55 | % | (91 | ) | n.a. | 164 | (1,102 | ) | 8 | % | ||||
| Financial expenses | (2,361 | ) | (149 | ) | 1485 | % | (3,762 | ) | -37 | % | (2,510 | ) | (3,796 | ) | -34 | % |
| EBT | 38,743 | 32,908 | 18 | % | 24,885 | 56 | % | 71,651 | 41,776 | 72 | % | |||||
| Total taxes | (12,033 | ) | (9,232 | ) | 30 | % | (12,532 | ) | -4 | % | (21,265 | ) | (19,915 | ) | 7 | % |
| Current income tax expense | (12,870 | ) | (10,426 | ) | 23 | % | (13,035 | ) | -1 | % | (23,296 | ) | (19,466 | ) | 20 | % |
| Deferred income tax expense | 837 | 1,194 | -30 | % | 503 | 66 | % | 2,031 | (449 | ) | n.a. | |||||
| Profit for the period | 26,710 | 23,676 | 13 | % | 12,353 | 116 | % | 50,386 | 21,861 | 130 | % | |||||
Apply the metal sale prices in Aranzazu realized during Q2 2026: Copper price = US
At Aranzazu, Q2 2026 production reached 17,882 GEO, a
Aranzazu's Net Revenue in Q2 2026 was US
Cost of Goods Sold at Aranzazu remained broadly in line with Q2 2025 and decreased
In the quarter, Aranzazu’s general and administrative expenses decreased
Aranzazu's Adjusted EBITDA reached US
3.2 Apoena
| (US$ thousand) | Q2 2026 | Q1 2026 | QoQ Change % | Q2 2025 | YoY Change % | H1 2026 | H1 2025 | Change% | ||||||||
| Production (GEO) | 5,704 | 7,525 | -24 | % | 8,219 | -31 | % | 13,229 | 17,095 | -23 | % | |||||
| Sales (GEO) | 5,704 | 7,525 | -24 | % | 8,219 | -31 | % | 13,229 | 17,627 | -25 | % | |||||
| Cash Cost (US$/GEO) | 1,886 | 1,380 | 37 | % | 1,168 | 61 | % | 1,598 | 1,200 | 33 | % | |||||
| AISC (US$/GEO) | 2,668 | 2,129 | 25 | % | 1,751 | 52 | % | 2,362 | 1,906 | 24 | % | |||||
| Net Revenue | 25,376 | 35,814 | -29 | % | 26,711 | -5 | % | 61,190 | 53,064 | 15 | % | |||||
| Cost of goods sold | (15,538 | ) | (16,230 | ) | -4 | % | (14,270 | ) | 9 | % | (31,768 | ) | (29,374 | ) | 8 | % |
| Gross Profit | 9,838 | 19,584 | -50 | % | 12,441 | -21 | % | 29,422 | 23,690 | 24 | % | |||||
| Expenses | 5,104 | (1,161 | ) | n.a. | (954 | ) | n.a. | 3,943 | (2,310 | ) | n.a. | |||||
| General and administrative expenses | (5,459 | ) | (1,003 | ) | 444 | % | (936 | ) | 483 | % | (6,462 | ) | (2,237 | ) | 189 | % |
| Exploration expenses | (210 | ) | (177 | ) | 19 | % | (62 | ) | 239 | % | (387 | ) | (186 | ) | 108 | % |
| Other income (expenses) | 10,773 | 19 | n.a. | 44 | n.a. | 10,792 | 113 | 9450 | % | |||||||
| EBIT | 14,942 | 18,423 | -19 | % | 11,443 | 30 | % | 33,365 | 21,267 | 56 | % | |||||
| Adjusted EBITDA | 13,675 | 24,274 | -44 | % | 16,151 | -16 | % | 37,949 | 29,697 | 28 | % | |||||
| Financial Result | (2,051 | ) | (2,013 | ) | 2 | % | (1,453 | ) | 41 | % | (4,064 | ) | (8,133 | ) | -50 | % |
| Financial Income | 32 | 205 | -84 | % | 154 | -79 | % | 371 | 159 | 133 | % | |||||
| Financial expenses | (2,083 | ) | (2,218 | ) | -6 | % | (1,497 | ) | 39 | % | (4,435 | ) | (8,292 | ) | -47 | % |
| EBT | 12,891 | 16,410 | -21 | % | 9,990 | 29 | % | 29,301 | 13,247 | 121 | % | |||||
| Total taxes | (2,924 | ) | (2,804 | ) | 4 | % | (1,211 | ) | 141 | % | (5,728 | ) | 131 | n.a. | ||
| Current income tax expense | (568 | ) | (703 | ) | -19 | % | (862 | ) | -34 | % | (1,271 | ) | (1,525 | ) | -17 | % |
| Deferred income tax expense | (2,356 | ) | (2,101 | ) | 12 | % | (349 | ) | 575 | % | (4,457 | ) | 1,656 | n.a. | ||
| Profit for the period | 9,967 | 13,606 | -27 | % | 8,779 | 14 | % | 23,573 | 13,378 | 76 | % | |||||
At Apoena, Q2 2026 production totaled 5,704 GEO, a
In H1 2026, Apoena produced 13,229 GEO, a
Apoena’s Net Revenue totaled US
In Q2 2026, cost of goods sold (COGS) totaled US
Apoena's general and administrative expenses in the quarter totaled US
Apoena's Adjusted EBITDA in Q2 2026 reached US
3.3 Minosa
| (US$ thousand) | Q2 2026 | Q1 2026 | QoQ Change % | Q2 2025 | YoY Change % | H1 2026 | H1 2025 | Change% | ||||||||
| Production (GEO) | 14,284 | 17,399 | -18 | % | 18,039 | -21 | % | 31,683 | 35,693 | -11 | % | |||||
| Sales (GEO) | 15,296 | 17,456 | -12 | % | 17,836 | -14 | % | 32,762 | 35,362 | -7 | % | |||||
| Cash Cost (US$/GEO) | 1,308 | 1,188 | 10 | % | 1,178 | 11 | % | 1,244 | 1,164 | 7 | % | |||||
| AISC (US$/GEO) | 1,545 | 1,370 | 13 | % | 1,292 | 20 | % | 1,452 | 1,271 | 14 | % | |||||
| Net Revenue | 64,286 | 80,020 | -20 | % | 55,776 | 15 | % | 144,306 | 103,838 | 39 | % | |||||
| Cost of goods sold | (21,346 | ) | (22,680 | ) | -6 | % | (22,056 | ) | -3 | % | (44,026 | ) | (43,532 | ) | 1 | % |
| Gross Profit | 42,940 | 57,340 | -25 | % | 33,720 | 27 | % | 100,280 | 60,306 | 66 | % | |||||
| Expenses | (1,479 | ) | (1,245 | ) | 19 | % | (1,177 | ) | 3 | % | (2,724 | ) | (2,792 | ) | -2 | % |
| General and administrative expenses | (1,004 | ) | (1,101 | ) | -9 | % | (1,166 | ) | -14 | % | (2,105 | ) | (2,301 | ) | -9 | % |
| Exploration expenses | (19 | ) | (65 | ) | -71 | % | (264 | ) | -93 | % | (84 | ) | (500 | ) | -83 | % |
| Other income (expenses) | (456 | ) | (79 | ) | 477 | % | 253 | n.a. | (535 | ) | 9 | n.a. | ||||
| EBIT | 41,461 | 56,095 | -26 | % | 32,290 | 28 | % | 97,556 | 57,505 | 70 | % | |||||
| Adjusted EBITDA | 43,249 | 58,105 | -26 | % | 33,533 | 29 | % | 101,354 | 60,646 | 67 | % | |||||
| Financial Result | (1,252 | ) | (1,246 | ) | 0 | % | (1,189 | ) | 5 | % | (2,498 | ) | (2,754 | ) | -9 | % |
| Financial Income | 89 | 65 | 37 | % | 71 | 25 | % | 154 | 182 | -15 | % | |||||
| Financial expenses | (1,341 | ) | (1,311 | ) | 2 | % | (1,442 | ) | -7 | % | (2,652 | ) | (2,936 | ) | -10 | % |
| Profit before income taxes | 40,209 | 54,849 | -27 | % | 31,101 | 29 | % | 95,058 | 54,760 | 74 | % | |||||
| Total taxes | (9,865 | ) | (14,770 | ) | -33 | % | (7,425 | ) | 33 | % | (24,635 | ) | (13,643 | ) | 81 | % |
| Current income tax expense | (10,707 | ) | (14,489 | ) | -26 | % | (7,774 | ) | 38 | % | (25,196 | ) | (14,385 | ) | 75 | % |
| Deferred income tax expense | 842 | (281 | ) | n.a. | 349 | 141 | % | 561 | 742 | -24 | % | |||||
| Profit for the period | 30,344 | 40,079 | -24 | % | 23,676 | 28 | % | 70,423 | 41,117 | 71 | % | |||||
At Minosa, Q2 2026 production totaled 14,284 GEO, an
Minosa's Net Revenue totaled US
In Q2 2026, Cost of Goods Sold totaled US
G&A expenses were US
Adjusted EBITDA was US
3.4 Almas
| (US$ thousand) | Q2 2026 | Q1 2026 | QoQ Change % | Q2 2025 | YoY Change % | H1 2026 | H1 2025 | Change% | ||||||||
| Production (GEO) | 16,130 | 15,838 | 2 | % | 12,917 | 25 | % | 31,968 | 26,018 | 23 | % | |||||
| Sales (GEO) | 17,920 | 14,048 | 28 | % | 12,917 | 39 | % | 31,968 | 26,018 | 23 | % | |||||
| Cash Cost (US$/GEO) | 1,156 | 1,204 | -4 | % | 1,167 | -1 | % | 1,177 | 1,118 | 5 | % | |||||
| AISC (US$/GEO) | 1,626 | 1,376 | 18 | % | 1,364 | 19 | % | 1,516 | 1,279 | 19 | % | |||||
| Net Revenue | 79,322 | 68,693 | 15 | % | 41,751 | 90 | % | 148,015 | 78,878 | 88 | % | |||||
| Cost of goods sold | (25,105 | ) | (21,670 | ) | 16 | % | (18,036 | ) | 39 | % | (46,775 | ) | (34,550 | ) | 35 | % |
| Gross Profit | 54,217 | 47,023 | 15 | % | 23,715 | 129 | % | 101,240 | 44,328 | 128 | % | |||||
| Expenses | (4,037 | ) | (2,048 | ) | 97 | % | (1,918 | ) | 110 | % | (6,085 | ) | (2,964 | ) | 105 | % |
| General and administrative expenses | (1,041 | ) | (1,137 | ) | -8 | % | (1,475 | ) | -29 | % | (2,178 | ) | (2,278 | ) | -4 | % |
| Exploration expenses | (1,407 | ) | (921 | ) | 53 | % | (423 | ) | 233 | % | (2,328 | ) | (660 | ) | 253 | % |
| Other income (expenses) | (1,589 | ) | 10 | n.a. | (20 | ) | n.a. | (1,579 | ) | (26 | ) | 5973 | % | |||
| EBIT | 50,180 | 44,975 | 12 | % | 21,817 | 130 | % | 95,155 | 41,390 | 130 | % | |||||
| Adjusted EBITDA | 56,159 | 49,720 | 13 | % | 24,709 | 127 | % | 105,879 | 47,136 | 125 | % | |||||
| Financial Result | (7,168 | ) | (1,709 | ) | 319 | % | (4,448 | ) | 61 | % | (8,877 | ) | (8,188 | ) | 8 | % |
| Financial Income | 246 | 317 | -22 | % | 1,015 | -76 | % | 563 | 2,283 | -75 | % | |||||
| Financial expenses | (7,414 | ) | (2,026 | ) | 266 | % | (5,463 | ) | 36 | % | (9,440 | ) | (10,471 | ) | -10 | % |
| Profit before income taxes | 43,012 | 43,266 | -1 | % | 17,349 | 148 | % | 86,278 | 33,176 | 160 | % | |||||
| Total taxes | 11,067 | (2,986 | ) | n.a. | (1,226 | ) | n.a. | 8,081 | (5,983 | ) | n.a. | |||||
| Current income tax expense | 12,493 | (7,590 | ) | n.a. | (7,101 | ) | n.a. | 4,903 | (13,099 | ) | n.a. | |||||
| Deferred income tax expense | (1,426 | ) | 4,604 | n.a. | 5,875 | n.a. | 3,178 | 7,116 | -55 | % | ||||||
| Profit for the period | 54,079 | 40,280 | 34 | % | 16,123 | 231 | % | 94,359 | 27,193 | 247 | % | |||||
At Almas, Q2 2026 production reached 16,130 GEO, a
Net Revenue was US
Cost of Goods Sold totaled US
General and administrative expenses were US
Adjusted EBITDA totaled US
3.5 Borborema
| (US$ thousand) | Q2 2026 | Q1 2026 | QoQ Change % | Q2 2025 | YoY Change % | H1 2026 | ||||||
| Production (GEO) | 14,251 | 17,101 | -17 | % | 2,577 | 453 | % | 31,352 | ||||
| Sales (GEO) | 14,539 | 16,609 | -12 | % | 1,190 | 1122 | % | 31,148 | ||||
| Cash Cost (US$/GEO) | 991 | 1,200 | -17 | % | 936 | 6 | % | 1,103 | ||||
| AISC (US$/GEO) | 1,102 | 1,256 | -12 | % | 1,441 | -24 | % | 1,184 | ||||
| Net revenue | 63,242 | 81,988 | -23 | % | 3,690 | 1614 | % | 145,230 | ||||
| Cost of goods sold | (18,326 | ) | (25,445 | ) | -28 | % | (1,114 | ) | 1545 | % | (43,771 | ) |
| Gross Profit | 44,916 | 56,543 | -21 | % | 2,576 | 1644 | % | 101,459 | ||||
| Expenses | (1,315 | ) | (1,228 | ) | 7 | % | (378 | ) | 248 | % | (2,543 | ) |
| General and administrative expenses | (1,061 | ) | (1,015 | ) | 5 | % | (378 | ) | 181 | % | (2,076 | ) |
| Exploration expenses | (583 | ) | (211 | ) | 176 | % | n.a. | 0 | % | (794 | ) | |
| Other income (expenses) | 329 | (2 | ) | n.a. | 11 | 2891 | % | 327 | ||||
| EBIT | 43,601 | 55,315 | -21 | % | 2,198 | 1884 | % | 98,916 | ||||
| Adjusted EBITDA | 47,297 | 60,939 | -22 | % | 2,084 | 2170 | % | 108,236 | ||||
| Financial Result | (9,117 | ) | (9,521 | ) | -4 | % | (4,982 | ) | 83 | % | (18,638 | ) |
| Financial Income | 172 | 220 | -22 | % | 21 | 719 | % | 392 | ||||
| Finance expenses | (9,289 | ) | (9,741 | ) | -5 | % | (5,003 | ) | 86 | % | (19,030 | ) |
| EBT | 34,484 | 45,794 | -25 | % | (2,773 | ) | n.a. | 80,278 C | ||||
| Total taxes | (5,297 | ) | (5,259 | ) | 1 | % | (309 | ) | 1614 | % | (10,556 | ) |
| Current income tax expense | (5,799 | ) | (6,613 | ) | -12 | % | n.a. | 0 | % | (12,412 | ) | |
| Deferred income tax expense | 502 | 1,354 | -63 | % | (309 | ) | n.a. | 1,856 | ||||
| Profit/(loss) for the period | 29,187 | 40,535 | -28 | % | (3,082 | ) | n.a. | 69,722 | ||||
At Borborema, Q2 2026 production totaled 14,251 GEO, a
Net Revenue was US
In Q2 2026, cost of goods sold (COGS) decreased
General and administrative expenses increased
Adjusted EBITDA was US
3.6 MSG
| (US$ thousand) | Q2 2026 | Q1 2026 | QoQ Change % | H1 2026 | ||||
| Production (GEO) | 7,186 | 8,580 | -16 | % | 15,766 | |||
| Sales (GEO) | 7,190 | 9,503 | -24 | % | 16,693 | |||
| Cash Cost (US$/GEO) | 3,852 | 2,900 | 33 | % | 3,310 | |||
| AISC (US$/GEO) | 5,277 | 3,735 | 41 | % | 4,399 | |||
| Net revenue | 28,916 | 46,913 | -38 | % | 75,829 | |||
| Cost of goods sold | (32,751 | ) | (35,274 | ) | -7 | % | (68,025 | ) |
| Gross Profit | (3,835 | ) | 11,639 | n.a. | 7,804 | |||
| Expenses | (2,766 | ) | (1,911 | ) | 45 | % | (4,677 | ) |
| General and administrative expenses | (2,412 | ) | (1,882 | ) | 28 | % | (4,294 | ) |
| Exploration expenses | (215 | ) | (29 | ) | 641 | % | (244 | ) |
| Other income (expenses) | (139 | ) | - | n.a. | (139 | ) | ||
| EBIT | (6,601 | ) | 9,728 | n.a. | 3,127 | |||
| Adjusted EBITDA | (1,116 | ) | 17,440 | n.a. | 16,324 | |||
| Financial Result | (4,884 | ) | 2,429 | n.a. | (2,455 | ) | ||
| Financial Income | 52 | 42 | 24 | % | 94 | |||
| Finance expenses | (4,936 | ) | 2,387 | n.a. | (2,549 | ) | ||
| Profit before income taxes | (11,485 | ) | 12,157 | n.a. | 672 | |||
| Total taxes | 3,402 | (3,279 | ) | n.a. | 123 | |||
| Current income tax expense | 929 | (4,477 | ) | n.a. | (3,548 | ) | ||
| Deferred income tax expense | 2,473 | 1,198 | 106 | % | 3,671 | |||
| Profit/(loss) for the period | (8,083 | ) | 8,878 | n.a. | 795 | |||
In Q2, MSG continued the Q1 2026 strategy aiming to establish the structural foundations for the assets’ turnaround. Aura advanced underground development, with approximately 1,845 meters completed during the period, ending the semester with 3,645 meters, and accelerated the surface exploration program. This effort complements the previously disclosed resource and reserve update and supports the ramp-up toward the second half of 2026, when the expected production turnaround for 2027 begins to materialize. The technical agenda progressed in line with our safety priorities: the quarter was completed with zero lost-time injuries (LTI), reflecting the strong adoption of the Aura 360° culture across leadership and operational teams, and reinforcing our commitment to safe, disciplined mining and long-term value creation.
Q2 2026 production totaled 7,186 GEO, a
Net Revenue was US
In Q2 2026, cost of goods sold (COGS) decreased
General and administrative expenses increased
The focus on primary development aligned with lower grades, which impacted directly in the sales and contingencies linked to the turnover drove the Adjusted EBITDA to US
4. Cash Flow
| (US$ thousand) | Q2 2026 | Q1 2026 | QoQ Change % | Q2 2025 | YoY Change % | H1 2026 | H1 2025 | Change% | ||||||||
| Adjusted EBITDA | 196,659 | 243,868 | -19 | % | 106,224 | 85 | % | 440,527 | 187,703 | 135 | % | |||||
| (+) Exploration Expenses | 3,569 | 2,359 | 51 | % | 1,714 | 108 | % | 5,928 | 3,090 | 92 | % | |||||
| (-) Sustaining Capex and Exploration Capex in mines in production | (30,111 | ) | (20,259 | ) | 49 | % | (15,151 | ) | 99 | % | (50,370 | ) | (28,342 | ) | 78 | % |
| (+/-) ∆ Working Capital, Changes in Other Assets and Liabilities and Others | (7,494 | ) | (42,247 | ) | -82 | % | 7,024 | n.a. | (49,741 | ) | (12,020 | ) | 314 | % | ||
| (-) Income Taxes Paid | (40,898 | ) | (51,502 | ) | -21 | % | (22,570 | ) | 81 | % | (92,400 | ) | (39,444 | ) | 134 | % |
| (-) Lease Payments | (4,246 | ) | (4,041 | ) | 5 | % | (5,122 | ) | -17 | % | (8,287 | ) | (9,361 | ) | -11 | % |
| (-) Realized Losses on Gold Hedges | (37,249 | ) | (33,325 | ) | 12 | % | (11,703 | ) | 218 | % | (70,574 | ) | (17,759 | ) | 297 | % |
| Recurring Free Cash Flow | 80,230 | 94,852 | -15 | % | 60,420 | 33 | % | 175,083 | 83,867 | 107 | % | |||||
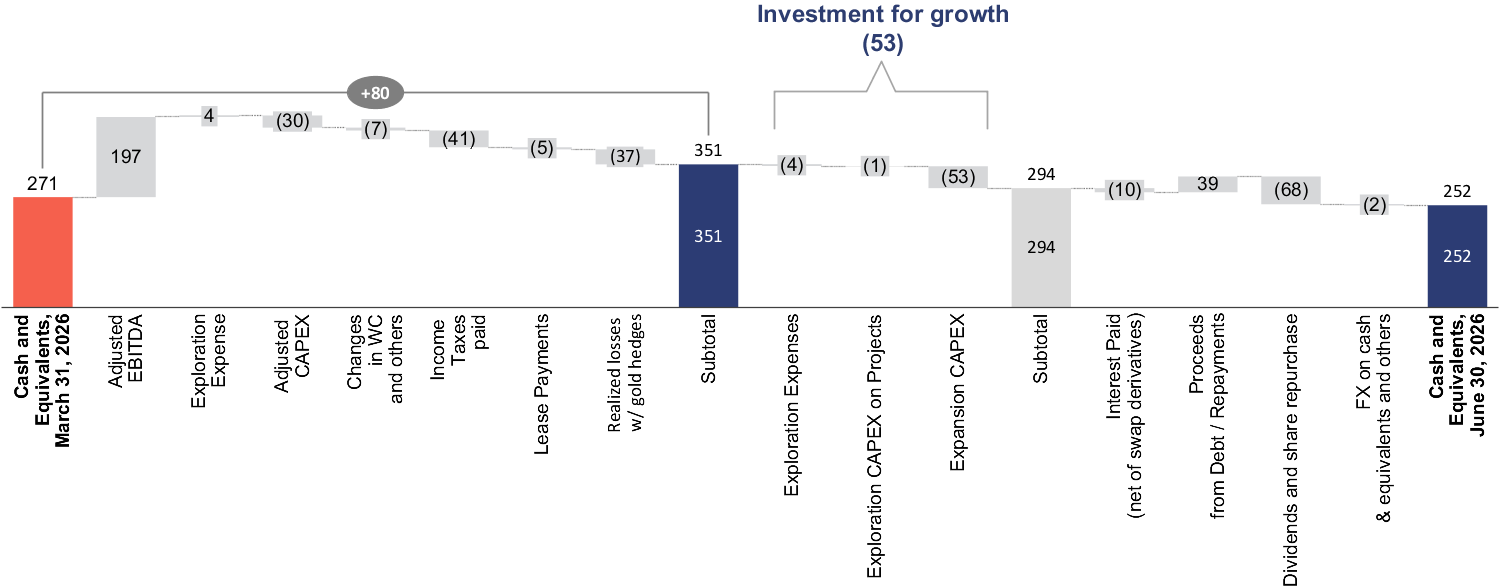
Recurring Free Cash Flow for the quarter was US
The chart below shows the change in cash position for the three and six months ending June 30, 2026, from a management perspective:
Changes to the Cash Position Q1 2026 vs. Q2 2026 – Managerial View (US$ Million)
Changes to the Cash Position Q4 2025 vs. Q2 2026 – Managerial View (US$ Million)
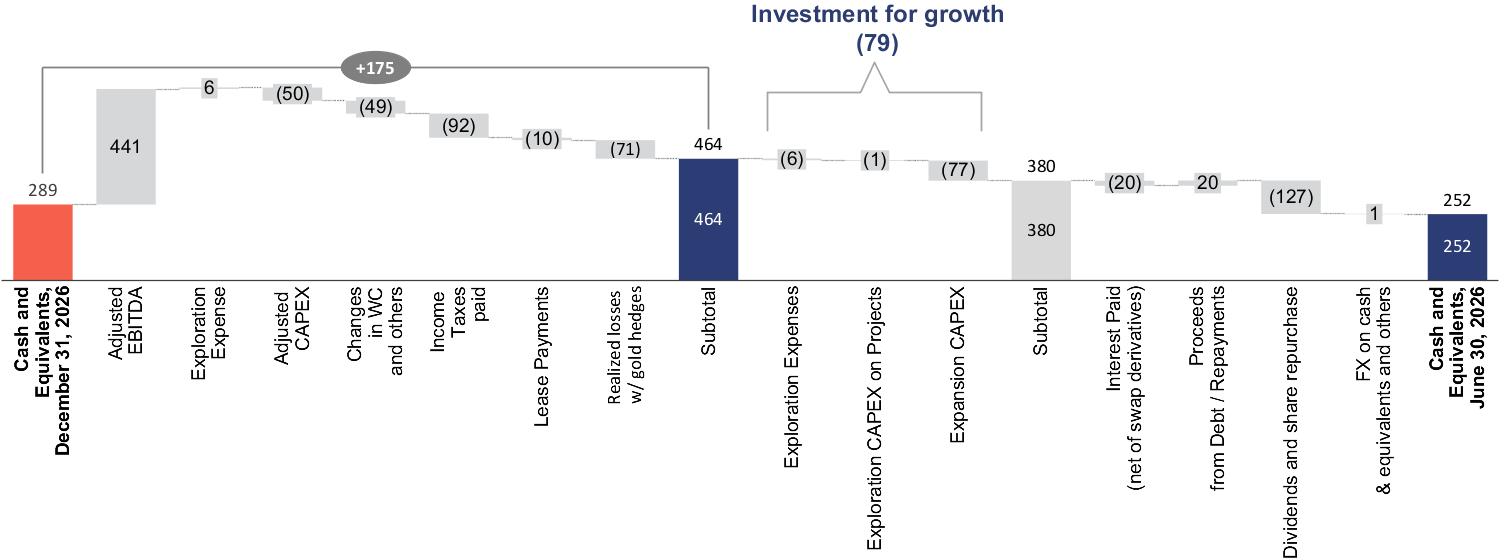
Notes: “Adjusted Capex” includes Exploration and Expansion Capex; “Changes in WC and others” includes changes in Other current and non-current assets and liabilities.
5. Investment
The Company’s consolidated Capex for Q2 2026 totaled US
- Expansion of Capex: US
$53.5 million , mainly on Apoena, Era Dorada and Almas, where US$17.8 million was invested at Apoena, US$8.9 million at Era Dorada and US$8.1 million at Almas. Another US$ 4.8 million was invested at MSG and US$ 7.9 million at Borborema. The remaining US$4.0 million was at Aranzazu and Minosa. US$2.1 million was invested in Projects. - Sustaining Capex: US
$25.3 million , of which US$7.3 million was invested by Aranzazu, US$6.9 million at Almas, US$5.5 million at MSG and another US$5.6 million at Minosa, Apoena and Borborema. - Exploration Capex: US
$5.5 million , allocated to exploration activities. MSG led investment with US$2.2 million , followed by Apoena with US$1.5 million . Aranzazu, Minosa and Almas totaled US$1.1 million . Other exploration projects totaled US$0.7 million .
The Company’s consolidated Capex for H1 2026 totaled US
- Expansion of Capex: US
$76.6 million , mainly on Apoena, Era Dorada and Almas, where US$27.2 million was invested at Apoena, US$15.3 million at Era Dorada and US$11.2 million at Almas. Another US$ 4.8 million was invested at MSG and US$10.1 at Borborema. The remaining US$5.3 million was at Aranzazu and Minosa. US$2.7 million was invested in Projects. - Sustaining Capex: US
$43.1 million , of which US$13.5 million was allocated at Aranzazu, US$11.2 million at MSG, US$7.8 million at Almas and another US$10.5 million at Minosa, Apoena and Borborema. - Exploration Capex: US
$8.8 million , allocated to exploration activities. Apoena led investment with US$2.8 million , followed by MSG with US$2.3 million . Aranzazu, Minosa and Almas totaled US$2.3 million . Other exploration projects totaled US$1.5 million .
6. Gross and Net Debt
Total gross debt (short and long-term portion) was US
The Company’s cash position remains comfortable, closing out the quarter at US
The Company's Net Debt reached US
Net Debt Breakdown
| (US$ thousand) | Q2 2026 | Q1 2026 | QoQ Change % | Q2 2025 | YoY Change % | ||
| Loans and debentures (current) | 64,985 | 97,090 | -33 | % | 78,786 | -18 | % |
| Loans and debentures (non-current) | 376,259 | 311,958 | 21 | % | 375,107 | 0 | % |
| Gross debt | 441,244 | 409,048 | 8 | % | 453,893 | -3 | % |
| Cash and cash equivalents | 248,322 | 267,789 | -7 | % | 167,938 | 48 | % |
| Restricted Cash | 3,492 | 3,352 | 4 | % | n.a. | n.a. | |
| Derivative financial instrument (Almas Swap) | 21,404 | 22,726 | -6 | % | 5,395 | 297 | % |
| Net Debt | 168,026 | 115,181 | 46 | % | 280,560 | -40 | % |
| Net Debt/LTM EBITDA | 0.21x | 0.16x | 0.05x | 0.81x | -0.59x | ||
7. Guidance vs. Actual1
The Company is on track to achieve the 2026 Guidance, including Production, Cash Cost, All-in Sustaining Cost (AISC) and CAPEX, as shown in the results below:
| Gold equivalent ounces production ('000 GEO) – 2026 | |||||
| Low | High | H1 2026 | H1 2026 at Guidance metal prices | % | |
| Aranzazu | 68 | 76 | 34 | 31 | |
| Apoena | 37 | 44 | 13 | 13 | |
| Minosa | 63 | 70 | 32 | 32 | |
| Almas | 57 | 63 | 32 | 32 | |
| Borborema | 65 | 77 | 31 | 31 | |
| MSG | 50 | 60 | 16 | 16 | |
| Total | 340 | 390 | 158 | 155 | |
____________________
1 Key Factors:
The Company’s future profitability, operating cash flow and financial position will be directly related to prevailing gold and copper prices. Key factors that influence the price of gold and copper include, among others, the supply and demand for gold and copper, the relative strength of currencies (especially the US dollar) and macroeconomic factors, such as current and future expectations for inflation and interest rates. Management believes that the economic environment in the short and medium term should remain relatively favorable with respect to commodity prices, albeit with continued volatility.
To reduce the risks associated with commodity prices and currency volatility, the Company will continue to assess and deploy hedging programs. For more information on this subject, please refer to the Reference Form.
Other key factors influencing profitability and operating cash flows are: production levels (affected by grades, ore quantities, process recoveries, labor, country stability and availability of facilities and equipment); production and processing costs (impacted by production levels, prices and the use of key consumables, labor, inflation and exchange rates), and other factors.
| Cash Cost per equivalent ounce of gold produced – 2026 | |||||
| Low | High | H1 2026 | H1 2026 at Guidance metal prices | % | |
| Aranzazu | 1,323 | 1,429 | 1,480 | 1,289 | |
| Apoena | 1,128 | 1,209 | 1,598 | 1,598 | |
| Minosa | 1,208 | 1,305 | 1,244 | 1,244 | |
| Almas | 1,059 | 1,135 | 1,177 | 1,177 | |
| Borborema | 1,009 | 1,089 | 1,103 | 1,103 | |
| Total ex-MSG | 1,151 | 1,238 | 1,287 | 1,243 | |
| MSG | 2,189 | 2,364 | 3,310 | 3,310 | |
| Total w/ MSG | 1,303 | 1,411 | 1,499 | 1,453 | |
| AISC per equivalent ounce of gold produced – 2026 | |||||
| Low | High | H1 2026 | H1 2026 at Guidance metal prices | % | |
| Aranzazu | 1,726 | 1,865 | 1,969 | 1,714 | |
| Apoena | 1,905 | 2,041 | 2,362 | 2,362 | |
| Minosa | 1,372 | 1,481 | 1,452 | 1,452 | |
| Almas | 1,415 | 1,516 | 1,516 | 1,516 | |
| Borborema | 1,177 | 1,271 | 1,184 | 1,184 | |
| Total ex-MSG | 1,488 | 1,602 | 1,615 | 1,560 | |
| MSG | 3,072 | 3,318 | 4,399 | 4,399 | |
| Total w/ MSG | 1,720 | 1,865 | 1,906 | 1,847 | |
| CAPEX – 2026 | ||||
| Low | High | H1 2026 | % | |
| Sustaining | 105 | 123 | 43 | |
| Exploration | 19 | 25 | 9 | |
| Expansion | 262 | 314 | 77 | |
| Total | 386 | 462 | 128 | |
8. Shareholder Information
As of June 30, 2026, the Company had the following outstanding: 83,836,843 Common Shares, 1,089,400 stock options, and 82,785 deferred share units.
9. Attachments
9.1 Non-GAAP Performance Measures
Set out below are reconciliations for certain non-GAAP financial measures (including non-GAAP ratios) utilized by the Company in this Earnings Release: Adjusted EBITDA; Adjusted net Income, cash operating costs per gold equivalent ounce sold; AISCs; Net Debt; and Adjusted EBITDA Margin, which are non-GAAP financial measures. These non-GAAP measures do not have any standardized meaning within IFRS and therefore may not be comparable to similar measures presented by other companies. The Company believes that these measures provide investors with additional information which is useful in evaluating the Company’s performance and should not be considered in isolation or as a substitute for measures of performance prepared in accordance with IFRS.
A. Reconciliation from income for the quarter to Adjusted EBITDA:
(US$ thousand)
| (US$ thousand) | Q2 2026 | Q2 2025 | H1 2026 | H1 2025 | ||||
| Profit / (Loss) for the period | 217,687 | 8,147 | 312,845 | (65,102 | ) | |||
| Current income tax expense | 19,794 | 29,551 | 67,203 | 50,365 | ||||
| Deferred income tax expense | (1,126 | ) | (6,326 | ) | (7,295 | ) | (8,840 | ) |
| Finance expense | 66,204 | 61,004 | 112,840 | 184,396 | ||||
| Finance income | (127,258 | ) | (1,374 | ) | (104,973 | ) | (3,155 | ) |
| Other income (expense) | (9,870 | ) | (61 | ) | (4,462 | ) | 693 | |
| Depletion and amortization | 26,529 | 15,283 | 59,670 | 29,346 | ||||
| Provision for contingent liabilities | 4,699 | - | 4,699 | - | ||||
| Adjusted EBITDA | 196,659 | 106,224 | 440,527 | 187,703 | ||||
B. Reconciliation from the consolidated financial statements to cash operating costs per gold equivalent ounce sold:
(US$ thousand)
| (US$ thousand) | Q2 2026 | Q2 2025 | H1 2026 | H1 2025 | ||||
| Cost of goods sold | (144,490 | ) | (86,497 | ) | (298,268 | ) | (169,873 | ) |
| Depletion and amortization | 25,868 | 14,948 | 58,833 | 28,812 | ||||
| Subtotal | (118,622 | ) | (71,549 | ) | (239,435 | ) | (141,061 | ) |
| Gold Equivalent Ounces sold | 78,414 | 62,452 | 159,782 | 122,943 | ||||
| Cash costs per gold equivalent ounce sold¹ | 1,513 | 1,146 | 1,499 | 1,147 | ||||
C. Reconciliation from the consolidated financial statements to all in sustaining costs per gold equivalent ounce sold:
(US$ thousand)
| (US$ thousand) | Q2 2026 | Q2 2025 | H1 2026 | H1 2025 | |||||||
| Cost of goods sold | (144,490 | ) | (86,497 | ) | (298,268 | ) | (169,873 | ) | |||
| Depletion and amortization | 25,868 | 14,948 | 58,833 | 28,812 | |||||||
| Subtotal | (118,622 | ) | (71,549 | ) | (239,435 | ) | (141,061 | ) | |||
| Adjusted capex | 30,111 | 13,993 | 50,370 | 26,044 | |||||||
| General and Administrative Expenses for the mines in production2 | 10,618 | 3,746 | 16,906 | 7,317 | |||||||
| Legal contingencies at Apoena | (4,699 | ) | n.a | (4,699 | ) | n.a | |||||
| Lease Payments | 894 | 1,226 | 2,342 | 4,449 | |||||||
| Subtotal | (155,546 | ) | (90,515 | ) | (304,354 | ) | (178,870 | ) | |||
| Gold Equivalent Ounces sold (in thousands) | 78,414 | 62,452 | 159,782 | 122,943 | |||||||
| All In Sustaining costs per ounce sold equivalent ounce sold3 | 1,985 | 1,449 | 1,906 | 1,455 | |||||||
D. Reconciliation from the consolidated financial statements to realized average gold price per ounce sold, net4:
____________________
2 Not including Amortization & depletion
3 Considered all mines in production.
4 Realized average gold price per ounce sold, net is a non-GAAP financial measure with no standardized meaning under IFRS, and therefore may not be comparable to similar measures presented by other issuers. For further information and detailed reconciliations to the most directly comparable IFRS measures, see Section 17: Non-GAAP Performance Measures in this MD&A.
(US$ thousand)
| (US$ thousand) | Q2 2026 | Q2 2025 | H1 2026 | H1 2025 |
| Gold Revenue, net of Sales Taxes | 261,057 | 127,928 | 574,463 | 239,470 |
| Ounces of gold sold | 60,650 | 40,162 | 125,800 | 80,197 |
| Realized average gold price per ounce sold, net | 4,304 | 3,185 | 4,566 | 2,986 |
E. Net Debt:
(US$ thousand)
| (US$ thousand) | H1 2026 | H1 2025 | ||
| Loans and debentures (current) | 64,985 | 78,786 | ||
| Loans and debentures (non-current) | 376,259 | 375,107 | ||
| Derivative Financial Instrument (Swap – Aura Almas (Itaú Bank) | (21,404 | ) | (5,395 | ) |
| Restricted Cash | (3,492 | ) | - | |
| Cash and Cash Equivalents | (248,322 | ) | (167,938 | ) |
| Net Debt | 168,026 | 280,560 | ||
(1) Derivative Financial Instrument: only includes the swap related to the Aura Almas Debenture.
F. Adjusted EBITDA Margin5 (Adjusted EBITDA/Revenues):
(US$ thousand)
| (US$ thousand) | Q2 2026 | Q2 2025 | H1 2026 | H1 2025 | ||||
| Net Revenue | 335,967 | 190,436 | 718,573 | 352,240 | ||||
| Adjusted EBITDA | 196,659 | 106,224 | 440,527 | 187,703 | ||||
| Adjusted EBITDA Margin (Adjusted EBITDA/Revenues) | 59 | % | 56 | % | 61 | % | 53 | % |
G. Adjusted Net Income
(US$ thousand)
| (US$ thousand) | Q2 2026 | Q2 2025 | H1 2026 | H1 2025 | ||||
| Profit/(Loss) for the period | 217,687 | 8,147 | 312,845 | (65,102 | ) | |||
| Foreign exchange gain (loss) | (10,908 | ) | (2,462 | ) | (5,435 | ) | (5,638 | ) |
| Loss on derivative transactions | 126,013 | (24,304 | ) | 101,908 | (124,514 | ) | ||
| Loss on settlement of liability with equity instruments | - | (8,768 | ) | - | (8,768 | ) | ||
| Deferred taxes over non-monetary items | 5,168 | 6,847 | 15,040 | 10,081 | ||||
| Adjusted Net Income | 97,414 | 36,834 | 201,332 | 63,737 | ||||
Qualified Person
The scientific and technical information contained in this press release has been reviewed and approved by Farshid Ghazanfari, P.Geo., Geology and Mineral Resources Manager, an employee of Aura and a “qualified person” within the meaning of NI 43-101 and SK-1300.
About Aura 360° Mining
Aura is focused on mining in complete terms – thinking holistically about how its business impacts and benefits every one of our stakeholders: our company, our shareholders, our employees, and the countries and communities we serve. We call this 360° Mining.
Aura is a company focused on the development and operation of gold and base metal projects in the Americas. The Company's six operating assets include the Minosa gold mine in Honduras; the Almas, Apoena, Borborema and MSG gold mines in Brazil; and the Aranzazu copper, gold, and silver mine in Mexico. Additionally, the Company owns Era Dorada, a gold project in Guatemala; Tolda Fria, a gold project in Colombia; and two projects in Brazil: Matupá, which is under development and the Carajás copper project in the Carajás region, in the exploration phase.
____________________
5 Adjusted EBITDA Margin is a non-GAAP financial measure with no standardized meaning under IFRS, and therefore may not be comparable to similar measures presented by other issuers. For further information and detailed reconciliations to the most directly comparable IFRS measures, see Section 17: Non-GAAP Performance Measures in this MD&A.
CAUTIONARY NOTES AND ADDITIONAL INFORMATION
This Press Release, and the documents incorporated by reference herein, contain certain “forward-looking information” within the meaning of applicable Canadian securities laws and “forward-looking statements” within the meaning of applicable United States securities laws (together, “forward-looking information”). Forward-looking information relates to future events or future performance of the Company and reflect the Company’s current estimates, predictions, expectations or beliefs regarding future events and include, without limitation, statements with respect to: expected production from, and the further potential of the Company’s properties; the ability of the Company to achieve its long-term outlook and the anticipated timing and results thereof (including the guidance set forth herein); the ability to lower costs and increase production; the economic viability of a project; strategic plans, including the Company’s plans with respect to its properties; the amount of mineral reserves and mineral resources; probable mineral reserves; indicated mineral reserves; inferred mineral reserves; the potential conversion of indicated mineral resources into mineral reserves; the amount of future production over any period; capital expenditures and mine production costs; the outcome of mine permitting; other required permitting; information with respect to the future price of minerals; expected cash costs and AISCs; the Company’s ability expand exploration on its properties; the Company’s ability to obtain assay results; the Company’s exploration and development programs; estimated future expenses; exploration and development capital requirements; the amount of mining costs; cash operating costs; operating costs; expected grades and ounces of metals and minerals; expected processing recoveries; expected time frames; prices of metals and minerals; LOM of certain projects; expectations of gold hedging programs; the implementation of cultural initiatives; expected increases to fleet capacities; non-cash losses translating into cash losses; the ability to continue to finance planned growth; access to additional debt; and the repayment of outstanding balances on revolving credit facilities. Often, but not always, forward-looking information may be identified by the use of words such as “expects”, “anticipates”, “plans”, “projects”, “forecasts”, “estimates”, “assumes”, “intends”, “strategy”, “goals”, “objectives” or variations thereof or stating that certain actions, events or results “may”, “could”, “would”, “might” or “will” be taken, occur or be achieved, or the negative of any of these terms and similar expressions.
Forward-looking information is necessarily based upon a number of estimates and assumptions that, while considered reasonable by the Company, are inherently subject to significant business, economic and competitive uncertainties and contingencies. Forward-looking information in this Press Release is based upon, without limitation, the following estimates and assumptions: the ability of the Company to successfully achieve business objectives; the presence of and continuity of metals at the Company’s projects at modeled grades; gold and copper price volatility; the capacities of various machinery and equipment; the availability of personnel, machinery and equipment at estimated prices; exchange rates; metals and minerals sales prices; cash costs and AISCs; the Company’s ability to expand operations; the Company’s ability to obtain assay results; appropriate discount rates; tax rates and royalty rates applicable to the mining operations; cash operating costs and other financial metrics; anticipated mining losses and dilution; metals recovery rates; reasonable contingency requirements; the Company’s expected ability to develop adequate infrastructure and that the cost of doing so will be reasonable; the Company’s expected ability to develop its projects including financing such projects; and receipt of regulatory approvals on acceptable terms.
Known and unknown risks, uncertainties and other factors, many of which are beyond the Company’s ability to predict or control, could cause actual results to differ materially from those contained in the forward-looking information. Specific reference is made to the Company’s most recent Annual Report on Form 20-F filed with the SEC for a discussion of some of the factors underlying forward-looking information, which include, without limitation: gold and copper or certain other commodity price volatility; changes in debt and equity markets; the uncertainties involved in obtaining and interpreting geological data; increases in costs; environmental compliance and changes in environmental legislation and regulation; interest rate and exchange rate fluctuations; general economic conditions; political stability; and other risks involved in the mineral exploration and development industry. Readers are cautioned that the foregoing list of factors is not exhaustive of the factors that may affect the forward-looking information.
All forward-looking information herein is qualified by this cautionary statement. Accordingly, readers should not place undue reliance on forward-looking information. The Company undertakes no obligation to update publicly or otherwise revise any forward-looking information whether because of new information or future events or otherwise, except as may be required by law. If the Company does update any forward-looking information, no inference should be drawn that it will make additional updates with respect to such or other forward-looking information.
Photos accompanying this announcement are available at:
https://www.globenewswire.com/NewsRoom/AttachmentNg/2de55530-c1bb-4be3-b838-6bd8b4e4c9fa
https://www.globenewswire.com/NewsRoom/AttachmentNg/a70f979e-d958-43cd-94eb-3056ce38f376

For more information, please contact:
Investor Relations
ri@auraminerals.com
www.auraminerals.com
FAQ
AI-generated questions and answers. How Rhea-AI works. Not financial advice.