
Ceva, Inc. Announces Second Quarter 2026 Financial Results
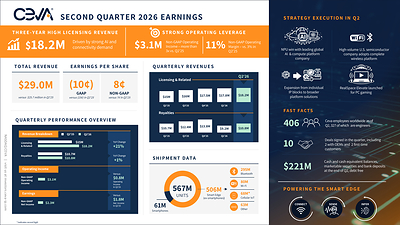
Ceva (NASDAQ: CEVA) reported second quarter 2026 revenues of $29.0 million, up 13% year over year.
Rhea-AI Summary
Ceva (NASDAQ: CEVA) reported second quarter 2026 revenues of $29.0 million, up 13% year over year. Licensing and related revenues rose 21% to $18.2 million, the highest in three years, while royalty revenues were $10.8 million, up 1% year over year and 17% sequentially.
Ceva signed ten IP licensing agreements, including two first-time customers and two direct OEM deals, and expanded its AI and connectivity customer base, including a leading global AI and computing platform company selecting its NeuPro-M NPU IP. GAAP gross margin reached 87%, with GAAP net loss narrowing to $2.9 million (loss per share $0.10). Non-GAAP operating income increased to $3.1 million, for an 11% non-GAAP operating margin, versus $0.8 million and 3% a year earlier. Non-GAAP net income was $2.3 million or $0.08 per diluted share. Cash, cash equivalents, marketable securities and short-term deposits totaled about $220.7 million at June 30, 2026.
Positive
- Total Q2 2026 revenue $29.0M, up 13% year over year
- Licensing and related revenue $18.2M, up 21% and 3‑year high
- Royalty revenue $10.8M, up 17% sequentially and 1% year over year
- Non-GAAP operating income rose to $3.1M, margin 11% vs 3%
- Non-GAAP net income improved to $2.3M vs $1.8M year over year
- Trailing 12‑month licensing and related revenue $69.6M, up 13%
Negative
- GAAP net loss remained at $2.9M, or -$0.10 per share in Q2 2026
- Equity-based compensation expenses totaled about $5.2M in operating costs for the quarter
- Non-GAAP diluted EPS only increased to $0.08 from $0.07 year over year
Details
Market move: CEVA -17.46% in the Aug 10 session. 2Q26 earnings report
On Aug 10, the day this news came out, CEVA closed 17.46% below the previous close. Argus tracked a trough of -21.7% from its starting point during tracking. Our momentum scanner recorded 66 alerts for this stock that day.
Data tracked by StockTitan Argus for the Aug 10 session.
Key Figures
- Total revenue
- $29.0 million, up 13%
- Second quarter 2026 versus second quarter 2025
- Licensing and related revenue
- $18.2 million, up 21%
- Second quarter 2026; highest in three years
- Royalty revenue
- $10.8 million, up 1% year over year
- Second quarter 2026
- Non-GAAP operating income
- $3.1 million
- Second quarter 2026 versus $0.8 million in second quarter 2025
- Non-GAAP operating margin
- 11%
- Second quarter 2026 versus 3% in second quarter 2025
- GAAP net loss
- $2.9 million
- Second quarter 2026 versus $3.7 million in second quarter 2025
- Non-GAAP diluted EPS
- $0.08
- Second quarter 2026 versus $0.07 in second quarter 2025
- Trailing-twelve-month licensing revenue
- $69.6 million, up 13%
- Trailing twelve months ended second quarter 2026
Previous Earnings Reports
-
Revenue and licensing growth coincided with a 1.38% negative 24-hour reaction.
-
Record quarterly and full-year revenue coincided with a 9.79% negative reaction.
-
Revenue growth and AI licensing activity coincided with a 0.57% negative reaction.
-
New licensing deals and quarterly results coincided with a 1.8% negative reaction.
-
Revenue and licensing growth coincided with a 20.17% negative reaction.
24h Move is the share-price change in the day after each event; other market factors may also have contributed.
Key Terms
npu ip technical
non-gaap financial
gaap financial
fasb asc no. 718 regulatory
AI-generated analysis. How Rhea-AI works. Not financial advice.




Company posts highest licensing and related revenues in three years on strong AI and connectivity demand
Second Quarter Highlights: *
- Total revenues of
$29.0 million 13% . - Licensing and related revenues of
$18.2 million 21% and the highest in three years. - Ten IP licensing agreements, including two with first-time customers and two directly with OEMs.
- Royalty revenues of
$10.8 million 1% year over year and17% sequentially, supported by strong wireless connectivity shipments, continued ramp of automotive AI programs and improving smartphone royalties. - Non-GAAP operating income of
$3.1 million 11% , compared with$0.8 million 3% .
*Unless otherwise stated, all comparisons are to the second quarter 2025.
Amir Panush, Chief Executive Officer of Ceva, commented, "We delivered another strong quarter, with revenue increasing
Our agreement signed in the quarter with a leading global AI and computing platform company represents an important expansion of our AI customer base. By combining hardware IP, software and system-level expertise, Ceva can deepen its role in customer designs, increase its content opportunity and support larger, longer-term relationships."
Business and Market Highlights
Licensing momentum during the quarter was led by the selection of Ceva's NeuPro-M NPU IP for next-generation custom AI silicon by a leading global AI and computing platform company. The engagement expands Ceva's AI licensing business into a new category of platform customer that controls both the hardware and operating-system environment.
Ceva also saw increased adoption of its diverse portfolio of broader connectivity solutions. A high-volume
Overall, Ceva signed ten licensing agreements during the quarter, including two with first-time customers and two directly with OEMs. Additional connectivity agreements were signed with customers across the
Other Second Quarter financial data: *
- GAAP gross margin was
87% , as compared to GAAP gross margin of86% - GAAP operating loss was
$2 $4.5 million - GAAP net loss was
$2 $3.7 million - GAAP diluted loss per share was
$0.10 $0.15 - Non-GAAP gross margin was
88% , as compared to non-GAAP gross margin of87% - Non-GAAP operating income was
$3.1 million $0.8 million - Non-GAAP net income and non-GAAP diluted earnings per share were
$2.3 million $0.08 $1.8 million $0.07
*Unless otherwise stated, all comparisons are to the second quarter 2025.
Yaniv Arieli, Chief Financial Officer of Ceva, added, "Licensing and related revenues reached
Ceva Conference Call
On August 10, 2026, Ceva management will conduct a conference call at 8:30 a.m. Eastern Time to discuss the operating performance for the quarter.
The conference call will be available via the following dial in numbers:
U.S . Participants: Dial 1-844-435-0316 (Access Code: Ceva)- International Participants: Dial +1-412-317-6365 (Access Code: Ceva)
The conference call will also be available live via webcast at the following link: https://app.webinar.net/P3eXEg0zQLb. Please go to the website at least fifteen minutes prior to the call to register.
For those who cannot access the live broadcast, a replay will be available by dialing +1 855-669-9658 or +1 412-317-0088 (access code: 9794488) from one hour after the end of the call until 9:00 a.m. (Eastern Time) on August 17, 2026. The replay will also be available at Ceva's web site at www.ceva-ip.com.
Forward-Looking Statements
This press release contains forward-looking statements that involve risks and uncertainties, as well as assumptions that if they materialize or prove incorrect, could cause the results of Ceva to differ materially from those expressed or implied by such forward-looking statements and assumptions. Forward-looking statements include statements about Ceva's positioning for future growth and to serve as a foundational technology provider for intelligent, connected devices, licensing agreement wins, future industry demand, our market position for the future and future growth in the demand of our products, our forecast of financial measures for the following quarter and 2026, our long term targets and underlying assumptions, our future investments, expectations about future market, the success of our strategies and agreements, visibility into future revenue streams, and Ceva's focus on expense management and profitability improvement. The risks, uncertainties and assumptions that could cause differing Ceva results include: the effect of intense industry competition; the ability of Ceva's technologies and products incorporating Ceva's technologies to achieve market acceptance; Ceva's ability to meet changing needs of end-users and evolving market demands; the lengthy sales cycle for IP and related solutions; Ceva's ability to diversify royalty streams and license revenues; geopolitical risks and instability, including the impact of tariffs and other trade measures and potential disruptions related to ongoing conflicts in the
About Ceva, Inc.
Ceva powers the Smart Edge, bridging the digital and physical worlds to bring AI-driven products to life. Our Ceva AI fabric portfolio of silicon and software IP enables devices to Connect, Sense, and Infer – the essential capabilities for the intelligent edge. From 5G, cellular IoT, Bluetooth, Wi-Fi, and UWB connectivity to scalable Edge AI NPUs, AI DSPs, sensor fusion processors and embedded software, Ceva provides the foundational IP for devices that connect, understand their environment, and act in real time.
With more than 21 billion devices shipped and trusted by 400+ customers worldwide, Ceva is the backbone of today's most advanced smart edge products - from AI-infused wearables and IoT devices to autonomous vehicles and 5G infrastructure. Our differentiated solutions deliver seamless integration into existing design flows, total flexibility to combine solutions based on design needs and ultra‑low‑power performance in minimal silicon footprint, helping customers accelerate development, reduce risk, and bring innovative products to market faster. As technology evolves toward Physical AI, Ceva's IP portfolio lays the foundation for systems that are always connected, contextually aware, and capable of intelligent, real-time decision-making.
Visit us at www.ceva-ip.com and follow us on LinkedIn, X, YouTube, Facebook, and Instagram.
For more information, contact:
Yaniv Arieli Ceva, Inc. CFO +972.9.961.3770 | Richard Kingston Ceva, Inc. VP Market Intelligence, Investor & Public Relations +1.650.220.1948 |
CEVA, INC. AND ITS SUBSIDIARIES | ||||
Three months ended | Six months ended | |||
June 30, | June 30, | |||
2026 | 2025 | 2026 | 2025 | |
Unaudited | Unaudited | Unaudited | Unaudited | |
Revenues: | ||||
Licensing and related revenues | $ 18,221 | $ 15,022 | $ 36,041 | $ 30,064 |
Royalties | 10,812 | 10,656 | 20,016 | 19,859 |
Total revenues | 29,033 | 25,678 | 56,057 | 49,923 |
Cost of revenues | 3,646 | 3,549 | 7,375 | 7,036 |
Gross profit | 25,387 | 22,129 | 48,682 | 42,887 |
Operating expenses: | ||||
Research and development, net | 19,332 | 18,758 | 39,169 | 36,367 |
Sales and marketing | 3,279 | 3,322 | 7,045 | 6,771 |
General and administrative | 4,743 | 4,381 | 9,403 | 8,314 |
Amortization of intangible assets | 109 | 150 | 226 | 299 |
Total operating expenses | 27,463 | 26,611 | 55,843 | 51,751 |
Operating loss | (2,076) | (4,482) | (7,161) | (8,864) |
Financial income, net | 978 | 2,121 | 2,855 | 4,221 |
Remeasurement of marketable equity securities | 24 | (208) | 88 | (262) |
Loss before taxes on income | (1,074) | (2,569) | (4,218) | (4,905) |
Income tax expense | 1,836 | 1,135 | 3,151 | 2,126 |
Net loss | $ (2,910) | $ (3,704) | $ (7,369) | $ (7,031) |
Basic and diluted net loss per share | $ (0.10) | $ (0.15) | $ (0.26) | $ (0.30) |
Weighted-average shares used to compute net loss per share (in thousands): | ||||
Basic and diluted | 27,996 | 23,898 | 27,838 | 23,832 |
Unaudited Reconciliation of GAAP to Non-GAAP Financial Measures | ||||
Three months ended | Six months ended | |||
June 30, | June 30, | |||
2026 | 2025 | 2026 | 2025 | |
Unaudited | Unaudited | Unaudited | Unaudited | |
GAAP net loss | $ (2,910) | $ (3,704) | $ (7,369) | $ (7,031) |
Equity-based compensation expense included in cost of revenues | 178 | 166 | 360 | 325 |
Equity-based compensation expense included in research and development expenses | 2,658 | 2,673 | 5,521 | 5,139 |
Equity-based compensation expense included in sales and marketing expenses | 713 | 598 | 1,430 | 1,164 |
Equity-based compensation expense included in general and administrative expenses | 1,622 | 1,465 | 3,232 | 2,597 |
Amortization of intangible assets related to acquisition of businesses | (42) | 209 | 134 | 417 |
Costs associated with asset acquisition | 60 | 144 | 121 | 288 |
Loss (income) associated with the remeasurement of marketable equity securities | (24) | 208 | (88) | 262 |
Non-GAAP net income | $ 2,255 | $ 1,759 | $ 3,341 | $ 3,161 |
GAAP weighted-average number of Common Stock used in computation of diluted net loss per share (in thousands) | 27,996 | 23,898 | 27,838 | 23,832 |
Weighted-average number of shares related to outstanding stock-based awards (in thousands) | 1,808 | 1,763 | 1,809 | 1,690 |
Weighted-average number of Common Stock used in computation of diluted earnings per share, excluding the above (in thousands) | 29,804 | 25,661 | 29,647 | 25,522 |
GAAP diluted loss per share | $ (0.10) | $ (0.15) | $ (0.26) | $ (0.30) |
Equity-based compensation expense | $ 0.18 | $ 0.19 | $ 0.37 | $ 0.38 |
Amortization of intangible assets related to acquisition of businesses | $ 0.00 | $ 0.01 | $ 0.00 | $ 0.02 |
Costs associated with asset acquisition | $ 0.00 | $ 0.01 | $ 0.00 | $ 0.01 |
Loss associated with the remeasurement of marketable equity securities | $ 0.00 | $ 0.01 | $ 0.00 | $ 0.01 |
Non-GAAP diluted earnings per share | $ 0.08 | $ 0.07 | $ 0.11 | $ 0.12 |
Three months ended | Six months ended | |||
June 30, | June 30, | |||
2026 | 2025 | 2026 | 2025 | |
Unaudited | Unaudited | Unaudited | Unaudited | |
GAAP operating loss | $ (2,076) | $ (4,482) | $ (7,161) | $ (8,864) |
Equity-based compensation expense included in cost of revenues | 178 | 166 | 360 | 325 |
Equity-based compensation expense included in research and development expenses | 2,658 | 2,673 | 5,521 | 5,139 |
Equity-based compensation expense included in sales and marketing expenses | 713 | 598 | 1,430 | 1,164 |
Equity-based compensation expense included in general and administrative expenses | 1,622 | 1,465 | 3,232 | 2,597 |
Amortization of intangible assets related to acquisition of businesses | (42) | 209 | 134 | 417 |
Costs associated with asset acquisition | 60 | 144 | 121 | 288 |
Total non-GAAP operating income | $ 3,113 | $ 773 | $ 3,637 | $ 1,066 |
Three months ended | Six months ended | |||
June 30, | June 30, | |||
2026 | 2025 | 2026 | 2025 | |
Unaudited | Unaudited | Unaudited | Unaudited | |
GAAP gross profit | $ 25,387 | $ 22,129 | $ 48,682 | $ 42,887 |
GAAP gross margin | 87 % | 86 % | 87 % | 86 % |
Equity-based compensation expense included in cost of revenues | 178 | 166 | 360 | 325 |
Amortization of intangible assets related to acquisition of businesses | (151) | 59 | (92) | 118 |
Total non-GAAP gross profit | $ 25,414 | $ 22,354 | $ 48,950 | $ 43,330 |
Non-GAAP gross margin | 88 % | 87 % | 87 % | 87 % |
Three months ended | Six months ended | |||
June 30, | June 30, | |||
2026 | 2025 | 2026 | 2025 | |
Unaudited | Unaudited | Unaudited | Unaudited | |
GAAP operating expenses | ||||
Equity-based compensation expense included in research and development expenses | (2,658) | (2,673) | (5,521) | (5,139) |
Equity-based compensation expense included in sales and marketing expenses | (713) | (598) | (1,430) | (1,164) |
Equity-based compensation expense included in general and administrative expenses | (1,622) | (1,465) | (3,232) | (2,597) |
Amortization of intangible assets related to acquisition of businesses | (109) | (150) | (226) | (299) |
Costs associated with asset acquisition | (60) | (144) | (121) | (288) |
Total non-GAAP operating expenses | $ 22,301 | $ 21,581 | $ 45,313 | $ 42,264 |
CEVA, INC. AND ITS SUBSIDIARIES | |||
June 30, | December 31, | ||
2026 | 2025 (*) | ||
Unaudited | Unaudited | ||
ASSETS | |||
Current assets: | |||
Cash and cash equivalents | $ 44,301 | $ 40,586 | |
Marketable securities and short-term bank deposits | 176,419 | 181,397 | |
Trade receivables, net | 22,312 | 19,495 | |
Unbilled receivables | 24,403 | 29,860 | |
Prepaid expenses and other current assets | 15,747 | 13,498 | |
Total current assets | 283,182 | 284,836 | |
Long-term assets: | |||
Severance pay fund | 7,615 | 7,530 | |
Deferred tax assets, net | 228 | 257 | |
Property and equipment, net | 8,784 | 7,054 | |
Operating lease right-of-use assets | 17,068 | 17,486 | |
Investment in marketable equity securities | 143 | 55 | |
Goodwill | 58,308 | 58,308 | |
Intangible assets, net | 700 | 1,044 | |
Other long-term assets | 15,861 | 11,686 | |
Total assets | |||
LIABILITIES AND STOCKHOLDERS' EQUITY | |||
Current liabilities: | |||
Trade payables | $ 1,540 | $ 2,418 | |
Deferred revenues | 2,692 | 3,496 | |
Accrued expenses and other payables | 21,084 | 21,026 | |
Operating lease liabilities | 2,662 | 1,743 | |
Total current liabilities | 27,978 | 28,683 | |
Long-term liabilities: | |||
Accrued severance pay | 7,832 | 7,690 | |
Operating lease liabilities | 14,762 | 14,388 | |
Other accrued liabilities | 1,072 | 1,037 | |
Total liabilities | 51,644 | 51,798 | |
Stockholders' equity: | |||
Common stock | 28 | 28 | |
Additional paid in-capital | 348,469 | 337,966 | |
Treasury stock | 0 | (1,591) | |
Accumulated other comprehensive income (loss) | (859) | 79 | |
Accumulated deficit | (7,393) | (24) | |
Total stockholders' equity | 340,245 | 336,458 | |
Total liabilities and stockholders' equity | |||
(*) Derived from audited financial statements.
The Company believes that the presentation of non-GAAP measures in the press release is useful to investors in analyzing the results for the quarters ended June 30, 2026, and 2025 because the exclusion of the applicable expenses may provide a meaningful analysis of the Company's core operating results and comparison of quarterly results. Further, the Company believes it is useful for investors to understand how the expenses associated with the application of FASB ASC No. 718 are reflected in its statements of income. The reconciliation of financial measures should be reviewed in addition to and in conjunction with results presented in accordance with GAAP and are intended to provide additional insight into the Company's operations that, when viewed with its GAAP results and the accompanying reconciliation, offer a more complete understanding of factors and trends affecting the Company's business. The reconciliation of financial measures should not be viewed as a substitute for the Company's reported GAAP results.
A reconciliation of non-GAAP guidance to the corresponding GAAP measures is not available on a forward-looking basis without unreasonable effort due to the uncertainty of expenses that may be incurred in the future, although it is important to note that these factors could be material to the Company's results computed in accordance with GAAP.

 View original content to download multimedia:https://www.prnewswire.com/news-releases/ceva-inc-announces-second-quarter-2026-financial-results-302846590.html
SOURCE Ceva, Inc.
FAQ
AI-generated questions and answers. How Rhea-AI works. Not financial advice.