
Cyngn Reports 2026 3rd Quarter Financial Results
Nine-month losses widened despite higher subscription revenue, while equity financing provided $17,915,893 in net proceeds.
Sentiment and the balance of points
Rhea-AI Sentiment reads the wording of the document, how positive or negative its language is on a 1 to 5 scale. The balance of points shown with the takes weighs what the document actually discloses, so the two can disagree, for example when a trial that missed its main goal is described in upbeat language.
Rhea-AI Summary
Cyngn (NASDAQ: CYN) reported third-quarter revenue of $156,495, with a narrower net loss and a follow-on order from an existing customer. Revenue rose from $69,973 a year earlier. Net loss narrowed to $5,959,616 from $8,438,641, while loss per share improved to $0.41 from $1.20.
For the nine months ended September 30, 2026, revenue increased to $405,527 from $150,851, but net loss widened to $18,800,885 from $17,798,600. Operating cash use reached $17,334,049, versus $16,835,542 a year earlier. Unrestricted cash and short-term investments totaled $34.9 million, with no debt. Net equity financing proceeds were $17,915,893 during the nine months.
The Fortune 100 customer's follow-on order extends DriveMod into another assembly-line application. Cyngn also achieved ISO 27001 certification in September and completed a SOC 2 Type II examination with zero exceptions in October.
How this balance works
Rhea-AI gives every point it takes from this document a weight. Minor counts 1, Moderate 3 and Major 9, so one Major point outweighs several Minor ones. The bar adds up the weights on each side, and when neither side holds more than 65% of the total the balance reads Mixed.
It reads the document as published, with the same rules for every company, and it does not look at what the market expected or at how the stock traded, so a point can be objectively good on a day the stock falls.
Rhea-AI Sentiment measures something else, the tone of the wording.
Positive
- Major pointNine-month net equity financing proceeds totaled $17,915,893. 4.6× market cap
- Moderate pointQ3 revenue increased to $156,495 from $69,973 a year earlier.
- Moderate pointQ3 net loss narrowed to $5,959,616 from $8,438,641; loss per share fell to $0.41 from $1.20.
- Minor pointNine-month revenue increased to $405,527 from $150,851 a year earlier.
- Minor pointFollow-on Fortune 100 customer order extends DriveMod into an additional assembly-line material handling application.
8 minor points
- Minor pointUnrestricted cash and short-term investments reached $34.9 million September 30, versus $34.7 million December 31, 2025.
- Minor pointNo debt at September 30, 2026 or December 31, 2025.
- Minor pointQ3 research and development expense fell to $2,971,411 from $5,254,953 a year earlier.
- Minor pointNine-month research and development expense fell to $9,014,214 from $9,331,987 a year earlier.
- Minor pointQ3 operating loss narrowed to $6,405,674 from $8,417,000 a year earlier.
- Minor pointQ3 total other income reached $446,058, versus a $21,641 loss a year earlier.
- Minor pointISO 27001 certification achieved in September; security controls examination completed with zero exceptions in October.
- Minor pointStockholders' equity increased to $38,979,209 September 30, from $38,754,406 December 31, 2025.
Negative
- Major pointCommon shares outstanding rose to 15,348,281 September 30, from 7,974,380 December 31, 2025, diluting holders.
- Moderate pointNine-month net loss widened to $18,800,885 from $17,798,600, despite per-share loss narrowing to $1.41 from $5.20.
- Minor pointNine-month operating cash use increased to $17,334,049 from $16,835,542 a year earlier.
- Minor pointNine-month operating loss widened to $20,101,447 from $19,133,898 a year earlier.
- Minor pointNine-month general and administrative expense rose to $11,131,999 from $9,873,188 a year earlier.
6 minor points
- Minor pointQ3 general and administrative expense rose to $3,376,330 from $3,181,204 a year earlier.
- Minor pointNine-month cost of revenue increased to $360,761 from $79,574 a year earlier.
- Minor pointQ3 cost of revenue increased to $214,428 from $50,816 a year earlier.
- Minor pointWorking capital declined to $34.3 million September 30, from $35.7 million December 31, 2025.
- Minor pointNine-month total other income declined to $1,300,562 from $1,335,298 a year earlier.
- Minor pointNine-month property and equipment purchases increased to $1,581,203 from $872,369 a year earlier.
News Explained
Launched in October, EasyLaunch offers qualifying customers one tugger and one route for a monthly payment, without upfront capital or a long-term commitment.
In this third-quarter release, Cyngn reports 15,348,281 common shares outstanding at
Cyngn says it launched DriveMod EasyLaunch in October, offering qualifying customers one autonomous tugger and one route for a monthly payment, without an upfront capital investment or long-term commitment.
Key Figures
- Q3 revenue
- $156.5 thousand vs. $70 thousand
- Q3 2026 vs. Q3 2025
- Q3 net loss
- $(6.0) million vs. $(8.4) million
- Q3 2026 vs. Q3 2025
- Q3 net loss per share
- $(0.41) vs. $(1.20)
- Q3 2026 vs. Q3 2025
- Nine-month revenue
- $405.5 thousand vs. $150.9 thousand
- Nine months ended September 30, 2026 vs. 2025
- Nine-month net loss
- $(18.8) million vs. $(17.8) million
- Nine months ended September 30, 2026 vs. 2025
- Unrestricted cash and short-term investments
- $34.9 million vs. $34.7 million
- September 30, 2026 vs. December 31, 2025
Previous Earnings Reports
-
Quarterly revenue increased while net loss widened; the company reported cash and short-term investments.
-
Year-to-date revenue increased while net loss widened; quarterly revenue was reported at $70.0 thousand.
24h Move is the share-price change in the day after each event; other market factors may also have contributed.
Key Terms
soc 2 type ii examination technical
iso 27001 certification technical
at-the-market equity financing financial
AI-generated analysis. How Rhea-AI works. Not financial advice.


Enterprise adoption advances with a follow-on Fortune 100 order, record monthly fleet activity, and a completed SOC 2 Type II examination
Recent Operating Highlights
- Ended the quarter with
$34.9 million - Announced a follow-on order from an existing Fortune 100 heavy equipment manufacturer, extending autonomous material handling into an additional assembly-line application.
- Strengthened enterprise security credentials, achieving ISO 27001 certification and completing a SOC 2 Type II examination with zero exceptions in October.
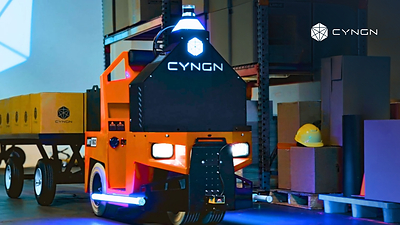
During the quarter, Cyngn announced a follow-on order from an existing Fortune 100 heavy equipment manufacturer, extending DriveMod into an additional assembly-line material handling application. Building on an established customer relationship, the order illustrates Cyngn's strategy of expanding autonomous operations beyond initial deployments as manufacturers identify additional workflows suitable for automation.
Cyngn also advanced initiatives to strengthen commercial execution and operating efficiency. Following changes to its sales organization, the Company implemented a more disciplined approach to customer qualification, pipeline accountability, and identifying applications aligned with the DriveMod Tugger. These efforts were accompanied by a streamlined organizational structure and expanded use of AI-assisted tools across engineering and business operations, with the objective of improving productivity and concentrating resources on priority initiatives.
The Company continued strengthening its capabilities to support enterprise customers. Cyngn announced its achievement of ISO 27001 certification in September and completed its inaugural SOC 2 Type II examination with zero exceptions in October, ahead of its previously announced year-end target. Together with its portfolio of 24 issued
In October, Cyngn also formally announced the launch of DriveMod EasyLaunch™, a simplified deployment program offering qualifying customers one autonomous tugger, one route, and a single monthly payment without an upfront capital investment or long-term commitment. The program is designed to lower barriers to initial adoption while providing customers with a practical starting point for expanding autonomous material handling across additional workflows.
Q3 2026 Nine Month Financial Review:
Year-to-date third quarter revenue was
Total costs and expenses for the nine months ended September 30, 2026 were
Net loss for the nine months ended September 30, 2026 was
Q3 2026 Three Month Financial Review:
Revenue in Q3 2026 was
Total costs and expenses in the second quarter were
Net loss for the third quarter was
Balance Sheet Highlights:
Cyngn's unrestricted cash and short-term investments as of September 30, 2026 totaled
|
CYNGN INC. |
||||||||||||||||
|
|
||||||||||||||||
|
|
|
Three Months Ended |
|
|
Nine Months Ended |
|
||||||||||
|
|
|
September 30, |
|
|
September 30, |
|
||||||||||
|
|
|
2026 |
|
|
2025 |
|
|
2026 |
|
|
2025 |
|
||||
|
Revenue |
|
$ |
156,495 |
|
|
$ |
69,973 |
|
|
$ |
405,527 |
|
|
$ |
150,851 |
|
|
Costs and expenses |
|
|
|
|
|
|
|
|
|
|
|
|
|
|
|
|
|
Cost of revenue |
|
|
214,428 |
|
|
|
50,816 |
|
|
|
360,761 |
|
|
|
79,574 |
|
|
Research and development |
|
|
2,971,411 |
|
|
|
5,254,953 |
|
|
|
9,014,214 |
|
|
|
9,331,987 |
|
|
General and administrative |
|
|
3,376,330 |
|
|
|
3,181,204 |
|
|
|
11,131,999 |
|
|
|
9,873,188 |
|
|
Total costs and expenses |
|
|
6,562,169 |
|
|
|
8,486,973 |
|
|
|
20,506,974 |
|
|
|
19,284,749 |
|
|
Loss from operations |
|
|
(6,405,674) |
|
|
|
(8,417,000) |
|
|
|
(20,101,447) |
|
|
|
(19,133,898) |
|
|
|
|
|
|
|
|
|
|
|
|
|
|
|
|
|
|
|
|
Other income (loss), net |
|
|
|
|
|
|
|
|
|
|
|
|
|
|
|
|
|
Interest income, net |
|
|
19,073 |
|
|
|
(252,497) |
|
|
|
62,737 |
|
|
|
(375,670) |
|
|
Warrant liability issuance costs |
|
|
|
|
|
|
|
|
|
|
|
|
|
|
|
|
|
Change in fair value of warrant liabilities |
|
|
‒ |
|
|
|
‒ |
|
|
|
‒ |
|
|
|
1,136,677 |
|
|
Loss on issuance of warrants |
|
|
‒ |
|
|
|
‒ |
|
|
|
‒ |
|
|
|
‒ |
|
|
Loss on deconsolidation of foreign subsidiary |
|
|
‒ |
|
|
|
‒ |
|
|
|
‒ |
|
|
|
‒ |
|
|
Other income, net |
|
|
426,985 |
|
|
|
230,856 |
|
|
|
1,237,825 |
|
|
|
574,291 |
|
|
Total other income (loss), net |
|
|
446,058 |
|
|
|
(21,641) |
|
|
|
1,300,562 |
|
|
|
1,335,298 |
|
|
|
|
|
|
|
|
|
|
|
|
|
|
|
|
|
|
|
|
Net loss |
|
$ |
(5,959,616) |
|
|
$ |
(8,438,641) |
|
|
$ |
(18,800,885) |
|
|
$ |
(17,798,600) |
|
|
|
|
|
|
|
|
|
|
|
|
|
|
|
|
|
|
|
|
|
|
|
|
|
|
|
|
|
|
|
|
|
|
|
|
|
|
Net loss per share attributable to common stockholders, |
|
$ |
(0.41) |
|
|
$ |
(1.20) |
|
|
$ |
(1.41) |
|
|
$ |
(5.20) |
|
|
|
|
|
|
|
|
|
|
|
|
|
|
|
|
|
|
|
|
Weighted-average shares used in computing net loss per |
|
|
14,714,857 |
|
|
|
7,039,266 |
|
|
|
13,291,330 |
|
|
|
3,424,032 |
|
|
CYNGN INC. |
||||||||
|
|
||||||||
|
|
|
September 30, |
|
|
December 31, |
|
||
|
|
|
2026 |
|
|
2025 |
|
||
|
ASSETS |
|
|
|
|
|
|
|
|
|
CURRENT ASSETS |
|
|
|
|
|
|
|
|
|
Cash and cash equivalents |
|
$ |
3,081,033 |
|
|
$ |
990,023 |
|
|
Short-term investments |
|
|
31,801,167 |
|
|
|
33,736,091 |
|
|
Accounts and other receivables |
|
|
928,194 |
|
|
|
1,544,213 |
|
|
Inventory |
|
|
1,630,299 |
|
|
|
2,039,655 |
|
|
Prepaid expenses and other current assets |
|
|
816,490 |
|
|
|
885,800 |
|
|
TOTAL CURRENT ASSETS |
|
|
38,257,183 |
|
|
|
39,195,782 |
|
|
|
|
|
|
|
|
|
|
|
|
NON-CURRENT ASSETS |
|
|
|
|
|
|
|
|
|
Property and equipment, net |
|
|
4,587,282 |
|
|
|
3,268,196 |
|
|
Right of use asset, net |
|
|
5,318,512 |
|
|
|
5,971,800 |
|
|
Intangible assets, net |
|
|
446,996 |
|
|
|
466,223 |
|
|
Other non-current assets |
|
|
1,292,681 |
|
|
|
1,151,214 |
|
|
TOTAL NON-CURRENT ASSETS |
|
|
11,645,471 |
|
|
|
10,857,433 |
|
|
|
|
|
|
|
|
|
|
|
|
TOTAL ASSETS |
|
$ |
49,902,654 |
|
|
$ |
50,053,215 |
|
|
|
|
|
|
|
|
|
|
|
|
LIABILITIES AND STOCKHOLDERS' EQUITY |
|
|
|
|
|
|
|
|
|
|
|
|
|
|
|
|
|
|
|
CURRENT LIABILITIES |
|
|
|
|
|
|
|
|
|
Accounts payable |
|
$ |
559,140 |
|
|
$ |
217,439 |
|
|
Deferred revenue |
|
|
575,289 |
|
|
|
395,348 |
|
|
Current operating lease liability |
|
|
984,478 |
|
|
|
312,365 |
|
|
Accrued expenses and other current liabilities |
|
|
1,861,157 |
|
|
|
2,615,734 |
|
|
TOTAL CURRENT LIABILITIES |
|
|
3,980,064 |
|
|
|
3,540,886 |
|
|
|
|
|
|
|
|
|
|
|
|
NON-CURRENT LIABILITIES |
|
|
|
|
|
|
|
|
|
Non-current deferred revenue |
|
|
1,251,629 |
|
|
|
1,262,667 |
|
|
Non-current operating lease liability |
|
|
5,691,752 |
|
|
|
6,495,256 |
|
|
TOTAL NON-CURRENT LIABILITIES |
|
|
6,943,381 |
|
|
|
7,757,923 |
|
|
|
|
|
|
|
|
|
|
|
|
TOTAL LIABILITIES |
|
|
10,923,445 |
|
|
|
11,298,809 |
|
|
|
|
|
|
|
|
|
|
|
|
Commitments and Contingencies (Note 13) |
|
|
|
|
|
|
|
|
|
|
|
|
|
|
|
|
|
|
|
STOCKHOLDERS' EQUITY |
|
|
|
|
|
|
|
|
|
Common stock, Par |
|
|
153 |
|
|
|
80 |
|
|
Additional paid-in capital |
|
|
274,602,412 |
|
|
|
255,576,797 |
|
|
Accumulated deficit |
|
|
(235,623,356) |
|
|
|
(216,822,471) |
|
|
TOTAL STOCKHOLDERS' EQUITY |
|
|
38,979,209 |
|
|
|
38,754,406 |
|
|
|
|
|
|
|
|
|
|
|
|
TOTAL LIABILITIES AND STOCKHOLDERS' EQUITY |
|
$ |
49,902,654 |
|
|
$ |
50,053,215 |
|
|
CYNGN INC. |
||||||||
|
|
||||||||
|
|
|
Nine Months Ended |
|
|||||
|
|
|
September 30, |
|
|||||
|
|
|
2026 |
|
|
2025 |
|
||
|
CASH FLOWS FROM OPERATING ACTIVITIES |
|
|
|
|
|
|
|
|
|
Net loss |
|
$ |
(18,800,885) |
|
|
$ |
(17,798,600) |
|
|
Adjustments to reconcile net loss to net cash used in operating activities: |
|
|
|
|
|
|
|
|
|
Depreciation and amortization |
|
|
928,756 |
|
|
|
894,312 |
|
|
Stock-based compensation |
|
|
1,109,795 |
|
|
|
1,347,987 |
|
|
Realized gain on short-term investments |
|
|
(18,167) |
|
|
|
(85,117) |
|
|
Accretion on short-term investments |
|
|
(1,145,864) |
|
|
|
(459,977) |
|
|
Loss on disposed assets |
|
|
14,464 |
|
|
|
11,429 |
|
|
Change in fair value of warrant liability |
|
|
‒ |
|
|
|
(1,136,677) |
|
|
Change in estimate of capitalized software |
|
|
‒ |
|
|
|
2,590,491 |
|
|
Change in assets and liabilities: |
|
|
|
|
|
|
|
|
|
Accounts and other receivables |
|
|
616,019 |
|
|
|
(481,492) |
|
|
Inventory |
|
|
409,356 |
|
|
|
(735,260) |
|
|
Prepaid expenses, operating lease right-of-use assets, and other assets |
|
|
(72,157) |
|
|
|
(1,542,030) |
|
|
Accounts payable |
|
|
341,700 |
|
|
|
112,638 |
|
|
Deferred revenue |
|
|
168,903 |
|
|
|
240,210 |
|
|
Accrued expenses, lease liabilities, and other current liabilities |
|
|
(885,969) |
|
|
|
206,544 |
|
|
Net cash used in operating activities |
|
|
(17,334,049) |
|
|
|
(16,835,542) |
|
|
|
|
|
|
|
|
|
|
|
|
CASH FLOWS FROM INVESTING ACTIVITIES |
|
|
|
|
|
|
|
|
|
Purchase of property and equipment |
|
|
(1,581,203) |
|
|
|
(872,369) |
|
|
Acquisition of intangible asset |
|
|
(8,587) |
|
|
|
(1,190,613) |
|
|
Disposal of assets |
|
|
‒ |
|
|
|
‒ |
|
|
Purchase of short-term investments |
|
|
(59,824,258) |
|
|
|
(62,710,899) |
|
|
Proceeds from maturity of short-term investments |
|
|
62,923,214 |
|
|
|
33,201,501 |
|
|
Net cash used in investing activities |
|
|
1,509,166 |
|
|
|
(31,572,380) |
|
|
|
|
|
|
|
|
|
|
|
|
CASH FLOWS FROM FINANCING ACTIVITIES |
|
|
|
|
|
|
|
|
|
Proceeds from at-the-market equity financing, net of issuance costs |
|
|
9,166,427 |
|
|
|
‒ |
|
|
Proceeds from public issuance of common stock, net of offering costs |
|
|
8,749,467 |
|
|
|
29,611,678 |
|
|
Issuance costs for public issuance of common stock and pre-funded warrants and |
|
|
‒ |
|
|
|
(1,025) |
|
|
Issuance costs for stock dividend and restricted stock units |
|
|
‒ |
|
|
|
‒ |
|
|
Net cash provided by financing activities |
|
|
17,915,893 |
|
|
|
29,610,653 |
|
|
|
|
|
|
|
|
|
|
|
|
Net increase in cash and cash equivalents |
|
|
2,091,010 |
|
|
|
(18,797,269) |
|
|
|
|
|
|
|
|
|
|
|
|
Cash and cash equivalents at beginning of period |
|
|
990,023 |
|
|
|
23,617,733 |
|
|
|
|
|
|
|
|
|
|
|
|
Cash and cash equivalents at end of period |
|
$ |
3,081,033 |
|
|
$ |
4,820,464 |
|
|
|
|
|
|
|
|
|
|
|
|
Supplemental disclosure: |
|
|
|
|
|
|
|
|
|
Recognition of operating lease right-of-use assets and operating lease liabilities |
|
$ |
‒ |
|
|
$ |
274,659 |
|
|
Acquisition of property and equipment included in accounts payable and accrued |
|
$ |
42,578 |
|
|
$ |
30,261 |
|
|
Acquisition of right-of-use asset in exchange for new operating lease obligation |
|
$ |
‒ |
|
|
$ |
6,589,332 |
|
|
|
|
|
|
|
|
|
|
|
About Cyngn
Cyngn develops and deploys autonomous vehicle technology for industrial organizations like manufacturers and logistics companies. The Company addresses significant challenges facing industrial organizations today, such as labor shortages and costly safety incidents.
Cyngn's DriveMod technology empowers customers to seamlessly bring self-driving technology to their operations without high upfront costs or infrastructure installations. DriveMod is currently available on Motrec MT-160 Tuggers.
The DriveMod Tugger hauls up to 12,000 lbs, travels inside and out, and targets a typical payback period of less than 2 years.
Investor Contact:
Natalie Russell
CFO
investors@cyngn.com
Media Contact:
Luke Renner
Head of Marketing
media@cyngn.com
Where to Find Cyngn:
- Website: https://cyngn.com
- X: https://x.com/cyngn
- LinkedIn: https://www.linkedin.com/company/cyngn
- YouTube: https://www.youtube.com/@cyngnhq
Forward-Looking Statements
This press release contains forward-looking statements within the meaning of the Private Securities Litigation Reform Act of 1995, Section 27A of the Securities Act of 1933, as amended, and Section 21E of the Securities Exchange Act of 1934, as amended. Any statement that is not historical in nature is a forward-looking statement and may be identified by the use of words and phrases such as "expects," "anticipates," "believes," "will," "will likely result," "will continue," "plans to," "potential," "promising," and similar expressions. These statements are based on management's current expectations and beliefs and are subject to a number of risks, uncertainties and assumptions that could cause actual results to differ materially from those described in the forward-looking statements, including the risk factors described from time to time in the Company's reports to the Securities and Exchange Commission (SEC), including, without limitation the risk factors discussed in the Company's annual report on Form 10-K filed with the SEC on March 26, 2026. Readers are cautioned that it is not possible to predict or identify all the risks, uncertainties and other factors that may affect future results. No forward-looking statement can be guaranteed, and actual results may differ materially from those projected. Cyngn undertakes no obligation to publicly update any forward-looking statement, whether as a result of new information, future events, or otherwise.
 View original content to download multimedia:https://www.prnewswire.com/news-releases/cyngn-reports-2026-3rd-quarter-financial-results-302935893.html
SOURCE Cyngn
FAQ
AI-generated questions and answers. How Rhea-AI works. Not financial advice.
What were Cyngn's Q3 2026 revenue and net loss?
Cyngn reported $156,495 in revenue and a $5,959,616 net loss for the three months ended September 30, 2026. A year earlier, revenue was $69,973 and net loss was $8,438,641. Basic and diluted loss per share narrowed to $0.41 from $1.20.
How much cash did Cyngn have at the end of Q3 2026?
Cyngn had $34.9 million in unrestricted cash and short-term investments at September 30, 2026, compared with $34.7 million at December 31, 2025. The company had no debt at either date.
What does Cyngn's DriveMod EasyLaunch program offer customers?
DriveMod EasyLaunch offers qualifying customers one autonomous tugger, one route and a single monthly payment, without an upfront capital investment or long-term commitment. Formally announced in October, the program is intended by Cyngn to lower barriers to initial adoption.
Why did Cyngn's Q3 2026 research and development expense decline?
The decline primarily reflected personnel costs affected by a change in accounting estimate related to capitalized software. Third-quarter research and development expense fell to $2,971,411 from $5,254,953 a year earlier.