STOCK TITAN

NRSInsights’ December 2023 Retail Same-Store Sales Report

Rhea-AI Impact
(Low)
Rhea-AI Sentiment
(Neutral)
Tags
Rhea-AI Summary
NRSInsights (NRS) reported a 5.5% increase in same-store sales for December 2023 compared to December 2022. The average sales per calendar day increased by 5.3% compared to November 2023. The NRS retail network, consisting of approximately 28,300 active terminals, experienced a 3.4% increase in same-store sales for the three months ended December 31, 2023, compared to the same period in 2022. The number of items sold increased by 7.4% compared to December 2022, and the average number of transactions per store increased by 5.1% compared to the same period last year. The dollar-weighted average of prices for the top 500 items purchased in December 2023 increased by 1.2% year-over-year. NRS retailers have consistently outperformed the U.S. retail sector, reflecting the important roles these retailers play within their urban communities and the loyalty of their customers.
Positive
  • 5.5% increase in same-store sales for December 2023 compared to December 2022
  • 3.4% increase in same-store sales for the three months ended December 31, 2023, compared to the same period in 2022
  • 7.4% increase in the number of items sold compared to December 2022
  • 5.1% increase in the average number of transactions per store compared to the same period last year
  • NRS retailers consistently outperforming the U.S. retail sector
Negative
  • None.

An uptick in same-store sales, as reported by NRSInsights, is a robust indicator of retail health, particularly for independent retailers. Observing a 5.5% increase in December 2023 compared to the same month in the previous year suggests a resilient consumer spending pattern, despite any underlying economic uncertainties. The reported 5.3% rise in average sales per calendar day from November to December underscores a seasonal boost, likely driven by holiday shopping behaviors.

Moreover, the 3.4% increase in same-store sales over the last quarter of 2023, compared to the same period in 2022, reflects sustained growth momentum. This is further substantiated by the 7.4% rise in the number of items sold year-over-year, implying that consumer transaction volumes are expanding, not just the value of sales. The growth in the average number of transactions per store by 5.1% year-over-year aligns with this narrative of increasing consumer engagement.

However, a nuanced detail is the slowing inflation rate on popular items, with a 1.2% increase in December 2023 over the previous year, contrasting with a higher 3.9% year-over-year increase in November. This deceleration may indicate a strategic pricing approach by retailers to maintain sales volumes during the competitive holiday season or a response to easing inflationary pressures.

The performance of NRSInsights' network, which has consistently outpaced the broader U.S. retail sector, could be indicative of a competitive advantage held by independent, urban retailers. This advantage might stem from their proximity to consumers and ability to quickly adapt to market changes. The 4.5 percentage points average outperformance over the US Commerce Department's Advance Monthly Retail Trade data excluding food services is a compelling statistic for investors considering the retail sector, particularly within urban settings.

The dollar-weighted average price increase for the top 500 items suggests that these retailers have managed to keep price hikes relatively low, which could be a strategic move to retain customer loyalty amidst inflationary concerns. This could be an attractive point for stakeholders looking for retail investments resilient to inflationary pressures.

It is also worth noting that the NRSInsights data have not been adjusted for various economic factors, which means that the raw sales growth figures could be slightly skewed when considering real-term growth. Stakeholders should interpret these figures with caution, considering potential inflationary impacts and other economic variables that may affect purchasing power and consumer behavior.

The data presented by NRSInsights reflects underlying economic trends such as consumer confidence and discretionary spending. The increase in same-store sales and transaction volumes during a traditionally high-spending season can be a microcosm of the broader economy's health. The moderate increase in prices for popular items could suggest that inflationary pressures are being managed effectively at the retail level, which could have broader implications for monetary policy and interest rates.

The fact that these independent retailers are outperforming the broader retail market could indicate a shift in consumer preferences towards smaller, community-based stores. This could reflect a change in urban consumer behavior that values convenience and locality, potentially driven by demographic shifts or a response to the pandemic-induced changes in shopping habits.

Long-term, the sustained growth in transaction volumes and sales could signal a robust sector within the economy, which may prove resilient even in the face of economic downturns. However, without adjustments for inflation and demographic changes, it's challenging to fully assess the real-term economic impact of these figures.

Same-store sales at NRS retailers during December increased 5.5% compared to December 2022

Compared to November 2023, same-store-sales per calendar day increased 5.3%

NEWARK, N.J., Jan. 08, 2024 (GLOBE NEWSWIRE) -- NRSInsights, a provider of sales data and analytics drawn from retail transactions processed through the National Retail Solutions (NRS) point-of-sale (POS) platform, today announced comparative same-store sales results for December 2023 and the three months then ended.

As of December 31, 2023, the NRS retail network comprised approximately 28,300 active terminals scanning purchases at independent retailers including bodegas, convenience stores, liquor stores, grocers, and tobacco and sundries sellers nationwide, predominantly serving urban consumers.

December Retail Same-Store Sales Highlights
(Same-store sales, unit sales and transaction data refer to December 2023 unless otherwise noted)

  • Same-store sales increased 5.5% from a year earlier (December 2022). Average sales per calendar day increased 5.3% compared to the preceding month (November 2023).
  • Same-store sales in the preceding month (November 2023) had increased 3.1% compared to the year-ago month (November 2022). Average sales per calendar day in November 2023 had decreased 1.2% compared to the preceding month (October 2023).
  • For the three months ended December 31, 2023, same-store sales increased 3.4% compared to the same three months in 2022.
  • The number of items sold increased 7.4% compared to a year earlier (December 2022) and increased 3.7% compared to November 2023 on a per calendar day basis.
  • The average number of transactions per store increased 5.1% compared to December 2022. The average number of transactions per calendar day increased 0.3% compared to November 2023.
  • A dollar-weighted average of prices for the top 500 items purchased in December 2023 increased 1.2% year-over-year, a decrease from the 3.9% year-over-year increase recorded in November 2023.

Commentary from Suzy Silliman (SVP, Data Strategy and Sales at NRS)

“Our data indicates that NRS retailers enjoyed a busy holiday season with outsized gains in same-store sales and continued moderation in the rate of inflation on the most popular items. Same-store sales at retailers utilizing our POS platform increased 5.5% in December compared to December 2022, and posted a strong 5.3% increase on a per-day basis compared to November, while the average price of the top 500 items increased just 1.2% compared to December 2022.”

“NRS has reported same-store sales year-over-year growth across dollars, units, and traffic each month in 2023 and, in aggregate, its retailers have consistently outperformed the U.S. retail sector as a whole. This reflects the important roles that these mom-and-pop retailers play within their urban communities and the loyalty of their customers.”

Retail Trade Comparative Data

The table below provides historical comparative data with the U.S. Commerce Department’s Advance Monthly Retail Trade same-store sales data excluding food service:

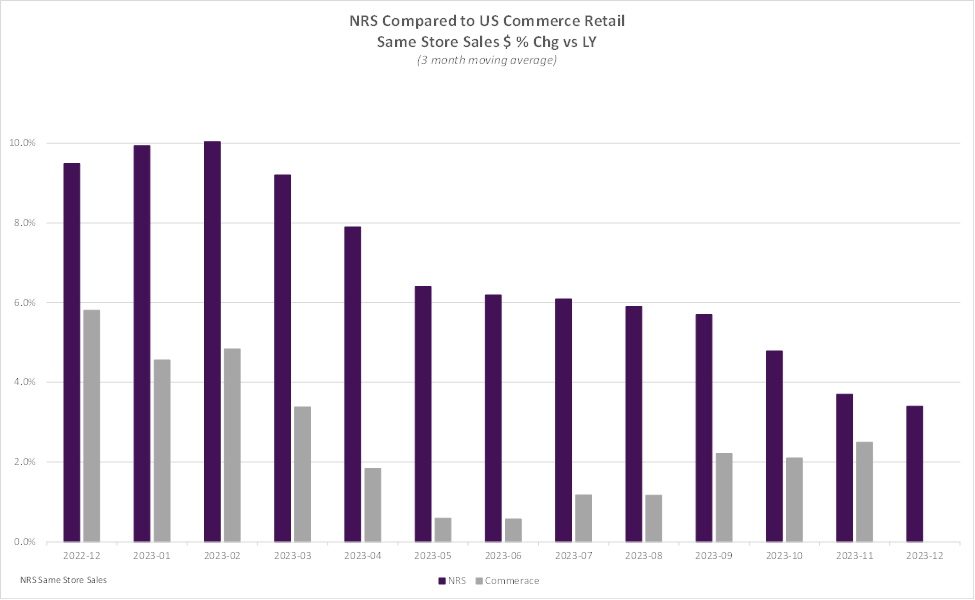
Over the past twelve months, the NRS network’s three-month moving average same-store sales have outpaced the US Commerce Department’s Advance Monthly Retail Trade data excluding food services by 4.5% percentage points, on average.

The NRSInsights data have not been adjusted to reflect inflation, demographic distributions, seasonal buying patterns, item substitution, or other factors that may facilitate comparisons to other periods, to other same-store retail sales data, or to the U.S. Commerce Department’s retail data.

NRSInsights Reports

The NRSInsights monthly Same-Store Retail Sales Reports are intended to provide timely topline data reflective of sales at NRS’ network of independent, predominantly urban, retail stores.

Same-store data comparisons of December 2023 with December 2022 are derived from approximately 159 million transactions processed through the 16,168 stores on the NRS network that scanned transactions in both months. Same-store data comparisons of December 2023 with November 2023 are derived from approximately 209 million transactions processed through 23,443 stores.

Same-store data comparisons for the three months ended December 31, 2023 with the year-ago three months are derived from approximately 458 million scanned transactions processed through the stores that were in the NRS network in both quarters.

NRS POS Network

The NRS network comprises approximately 28,300 active POS terminals operating in approximately 24,500 independent retail stores. Its platform predominantly serves small-format, independent, retail stores including convenience stores, bodegas, liquor stores, grocers, and tobacco and sundries sellers. The network includes retailers in all 50 states and in 197 of the 210 designated market areas (DMAs) in the United States. Over the past twelve months, NRS’ POS terminals have processed $17.2 billion in sales through approximately 1.2 billion transactions.

About National Retail Solutions (NRS):

National Retail Solutions operates the largest point-of-sale (POS) terminal-based platform and digital payment processing service for independent retailers nationwide. Retailers utilize NRS offerings to process transactions and effectively manage their businesses. Consumer packaged goods (CPG) suppliers, brokers, analytics firms, and advertisers access the terminal’s digital display network to reach these retailers’ predominantly urban, multi-cultural shopper base, and to harness transaction data-based learnings to identify growth opportunities and measure execution and returns on marketing investment. NRS is a subsidiary of IDT Corporation (NYSE: IDT).

All statements above that are not purely about historical facts, including, but not limited to, those in which we use the words “believe,” “anticipate,” “expect,” “plan,” “intend,” “estimate,” “target” and similar expressions, are forward-looking statements within the meaning of the Private Securities Litigation Reform Act of 1995. While these forward-looking statements represent our current judgment of what may happen in the future, actual results may differ materially from the results expressed or implied by these statements due to numerous important factors. Our filings with the SEC provide detailed information on such statements and risks, and should be consulted along with this release. To the extent permitted under applicable law, IDT assumes no obligation to update any forward-looking statements.

NRSInsights Contact:
Suzy Silliman
SVP, Data Strategy and Sales at NRS
National Retail Solutions
suzy.silliman@nrsplus.com

IDT Corporation Contact:
Bill Ulrey
william.ulrey@idt.net

# # #


FAQ

How much did same-store sales increase for NRSInsights in December 2023?

Same-store sales for NRSInsights increased by 5.5% in December 2023 compared to December 2022.

What was the average increase in sales per calendar day in November 2023 for NRSInsights?

The average sales per calendar day for NRSInsights increased by 5.3% in November 2023 compared to the preceding month.

How many active terminals does the NRS retail network comprise?

The NRS retail network comprises approximately 28,300 active terminals.

What was the percentage increase in the number of items sold in December 2023 compared to the previous year?

The number of items sold increased by 7.4% compared to December 2022.

How has NRS retailers' performance compared to the U.S. retail sector?

NRS retailers have consistently outperformed the U.S. retail sector.

IDT Corporation

NYSE:IDT

IDT Rankings

IDT Latest News

IDT Stock Data

1.05B
16.98M
32.05%
49.78%
1%
Telecommunications Resellers
Information
Link
United States of America
NEWARK

About IDT

we know that you’ll have looked at quite a few company recruitment pages but idt is different. we want people who want to make a big difference to our company with big ambitions. we’re a truly global team, with 1300 people working across all continents, apart from (at the moment!) antarctica. but we are proud that despite our size, we encourage and support any in-house entrepreneurs to develop their ideas into business action. our exciting growth plans make it a great time to join us. our people are the reason for idt’s passion for success. the idt family is made up of people of all backgrounds, expertise and interests, all with a relentless team spirit. we need people who share both our commitment to success and excitement about our journey. you won’t ever be bored or have to wonder how to fill your time. you’ll find the work challenging but you’ll get the support of a great team to help you beat those challenges. you will also be expected to support others as well as work hard, wor