
LexinFintech Holdings Ltd. Reports Fourth Quarter and Full Year 2025 Unaudited Financial Results
LexinFintech (NASDAQ: LX) reported unaudited Q4 and full-year 2025 results on March 19, 2026.
Rhea-AI Summary
LexinFintech (NASDAQ: LX) reported unaudited Q4 and full-year 2025 results on March 19, 2026. For full-year 2025, net income was RMB1.7 billion, up 52.4% year‑over‑year. Total operating revenue for 2025 was RMB13,152 million, down 7.4% year‑over‑year. Q4 2025 net income was RMB214 million.
The board approved a US$0.188 per ADS dividend (30% of H2 2025 net income); the company repurchased US$39 million of ADSs and the chairman completed a US$10 million personal share purchase. Installment e-commerce GMV rose sharply, while on‑balance sheet loan balances declined.
Positive
- Net income +52.4% YoY (RMB1.7 billion in 2025)
- Approved US$0.188 per ADS dividend (30% of H2 2025 net income)
- ADS repurchases cumulative US$39 million
- Chairman purchase executed: US$10 million personal buy
- Installment e-commerce GMV +110% in 2025 (RMB7,622 million)
- Funding cost -40% QoQ vs prior year Q4 (RMB34.2M)
Negative
- Total outstanding principal balance -12.4% YoY (RMB96.6 billion)
- Q4 2025 net income -41.0% YoY (RMB214 million)
- Tech‑empowerment service income -71.7% in Q4 2025
Details
News Market Reaction – LX
On Mar 19, the day this news came out, LX closed 1.54% below the previous close.
Data tracked by StockTitan Argus for the Mar 19 session.
Key Figures
- Net profit 2025
- RMB1.7 billion
- Full year 2025, up 52.4% YoY
- Dividend per ADS
- US$0.188
- Represents 30% of net income from H2 2025
- Share repurchases
- US$39 million
- Cumulative ADS repurchases as of announcement date
- CEO purchase plan
- US$10 million
- Personal share purchase plan fully implemented
- Q4 2025 net income
- RMB214 million
- Quarter ended Dec 31, 2025, down 41.0% YoY
- Revenue 2025
- RMB13,152 million
- Total operating revenue 2025, down 7.4% YoY
- Q4 loan originations
- RMB50.0 billion
- Q4 2025 total loan originations, down 3.8% YoY
- 90+ day delinquency
- 3.1%
- As of Dec 31, 2025, vs 3.0% on Sep 30, 2025
Previous Earnings Reports
-
Strong Q2 profit growth and shareholder returns including dividend and buyback.
-
Three-year high profit with higher non-GAAP EBIT and larger dividend ratio.
-
Net income more than doubled year-over-year with improved risk metrics.
-
Improved profitability and higher 2024 revenue with dividend introduction.
-
Mixed results but higher net profit and revenue with better asset quality.
24h Move is the share-price change in the day after each event; other market factors may also have contributed.
Key Terms
ads financial
gmv technical
non-gaap financial
apr financial
asc 460 regulatory
90 day+ delinquency ratio financial
contingent guarantee liabilities financial
intelligent credit platform technical
AI-generated analysis. How Rhea-AI works. Not financial advice.




SHENZHEN, China, March 19, 2026 (GLOBE NEWSWIRE) -- LexinFintech Holdings Ltd. (“Lexin” or the “Company”) (NASDAQ: LX), a leading technology-empowered personal financial service enabler in China, today announced its unaudited financial results for the quarter ended December 31, 2025.
Mr. Jay Wenjie Xiao, Chairman and Chief Executive Officer of Lexin, commented, “The fourth quarter marked an important transition for us as we adapted to the new regulatory framework. Amid heightened industry risk volatility, our proactive compliance efforts and disciplined risk management enabled us to secure a stable transition, while balancing business scale and overall asset quality.
Despite the complex macro environment in the fourth quarter, we concluded 2025 with robust full-year results. For the full year of 2025, net profit stood at RMB1.7 billion, representing a year-over-year increase of
Going forward, we believe that the market will continue to consolidate toward leading, compliant platforms with prudent risk management. Leveraging our unique business ecosystem, we are well-positioned to capture potential opportunities as the industry enters this new stage of high-quality development.
We also remain deeply committed to enhancing shareholder returns. In accordance with our dividend policy, our board of directors has approved a dividend of US
Mr. James Zheng, Chief Financial Officer of Lexin, commented, “During the fourth quarter, as we navigated elevated risk volatility and the evolving regulatory landscape, our proactive risk management and pricing adjustments weighed on our bottom line, with net income recording RMB214 million. The resilience of our diversified business ecosystem provided an effective counterbalance to this impact. In parallel, we fortified our balance sheet with ample provisioning, while our funding costs declined substantially. These actions have fundamentally strengthened our foundation for long-term growth.
Looking ahead to 2026, as the industry enters a new phase of normalization, we will leverage our unique business ecosystem and comprehensive product matrix to continue executing our disciplined strategy, and deliver sustainable, long-term returns to our shareholders.”
Fourth Quarter and Full Year 2025 Operational Highlights:
User Base
- Total number of registered users across our platform reached 245 million as of December 31, 2025, representing an increase of
7.6% from 228 million as of December 31, 2024. - Number of active users1 in the fourth quarter of 2025 was 4.5 million, representing a decrease of
3.8% from 4.7 million in the fourth quarter of 2024. Number of active users1 in 2025 was 8.2 million, representing an increase of0.3% from 8.2 million in 2024. - Number of cumulative borrowers with successful drawdown was 36.7 million as of December 31, 2025, an increase of
8.9% from 33.8 million as of December 31, 2024.
Loan Facilitation Business
- As of December 31, 2025, we cumulatively originated RMB1,530.5 billion in loans, an increase of
15.5% from RMB1,325.1 billion as of December 31, 2024.
- Total loan originations2 in the fourth quarter of 2025 was RMB50.0 billion, a decrease of
3.8% from RMB52.0 billion in the fourth quarter of 2024. Total loan originations2 in 2025 was RMB205 billion, a decrease of3.2% from RMB212 billion in 2024. - Total outstanding principal balance of loans3 was RMB96.6 billion as of December 31, 2025, representing a decrease of
12.4% from RMB110 billion as of December 31, 2024.
Credit Performance4
- 90 day+ delinquency ratio5 was
3.1% as of December 31, 2025, as compared with3.0% as of September 30, 2025. - First payment default rate (30 day+) for new loan originations was below
1% as of December 31, 2025.
Installment E-commerce Platform Service
- GMV6 in the fourth quarter of 2025 for our installment e-commerce platform service was RMB2,154 million, representing an increase of
122% from RMB969 million in the fourth quarter of 2024. GMV6 in 2025 for our installment e-commerce platform service was RMB7,622 million, representing an increase of110% from RMB3,633 million in 2024. - In the fourth quarter of 2025, our installment e-commerce platform service served over 480,000 users.
Other Operational Highlights
- The weighted average tenor of loans originated in the fourth quarter of 2025 was approximately 11.9 months, as compared with 13.1 months in the fourth quarter of 2024. The weighted average tenor of loans originated on our platform in 2025 was approximately 12.9 months, as compared with 12.9 months in 2024.
- Repeated borrowers’ contribution7 of loans across our platform for the fourth quarter of 2025 was
88.3% . Repeated borrowers’ contribution7 of loans across our platform for 2025 was86.4% .
Fourth Quarter 2025 Financial Highlights:
- Total operating revenue was RMB3,043 million, representing a decrease of
16.8% from the fourth quarter of 2024. - Credit facilitation service income was RMB2,485 million, representing a decrease of
8.4% from the fourth quarter of 2024. Tech-empowerment service income was RMB170 million, representing a decrease of71.7% from the fourth quarter of 2024. Installment e-commerce platform service income was RMB388 million, representing an increase of12.5% from the fourth quarter of 2024. - Net income attributable to ordinary shareholders of the Company was RMB214 million, representing a decrease of
41.0% from the fourth quarter of 2024. Net income per ADS attributable to ordinary shareholders of the Company was RMB1.24 on a fully diluted basis. - Adjusted net income attributable to ordinary shareholders of the Company8 was RMB239 million, representing a decrease of
38.9% from the fourth quarter of 2024. Adjusted net income per ADS attributable to ordinary shareholders of the Company8 was RMB1.38 on a fully diluted basis.
Full Year 2025 Financial Highlights:
- Total operating revenue was RMB13,152 million, representing a decrease of
7.4% from 2024. - Credit facilitation service income was RMB9,562 million, representing a decrease of
13.1% from 2024. Tech-empowerment service income was RMB2,081 million, representing an increase of10.6% from 2024. Installment e-commerce platform service income was RMB1,509 million, representing an increase of14.1% from 2024. - Net income attributable to ordinary shareholders of the Company was RMB1,677 million, representing an increase of
52.4% from 2024. Net income per ADS attributable to ordinary shareholders of the Company was RMB9.45 on a fully diluted basis. - Adjusted net income attributable to ordinary shareholders of the Company8 was RMB1,795 million, representing an increase of
49.2% from 2024. Adjusted net income per ADS attributable to ordinary shareholders of the Company8 was RMB10.11 on a fully diluted basis.
__________________________
- Active users refer to, for a specified period, users who made at least one transaction during that period through our platform or through our third-party partners’ platforms using the credit line granted by us.
- Total loan originations refer to the total principal amount of loans originated during the given period through our platform or through our third-party partners' platforms.
- Total outstanding principal balance of loans refers to the total amount of principal outstanding for loans facilitated and originated at the end of each period, including loans guaranteed by our financial guarantee companies and the loans facilitated across third party platforms that we bear principal risk and excluding loans delinquent for more than 180 days that are charged-off.
- Loans under Intelligent Credit Platform are excluded from the calculation of credit performance. Intelligent Credit Platform (ICP) is an intelligent platform on our “Fenqile” app, under which we match borrowers and financial institutions through big data and cloud computing technology. For loans facilitated through ICP, the Company does not bear principal risk.
- “90 day+ delinquency rate” refers to the outstanding principal balance of on- and off-balance sheet loans that were 91 to 180 calendar days past due as a percentage of the total outstanding principal balance of on- and off-balance sheet loans across our platform and those loans across third party platforms that we bear principle risk as of a specific date. Loans that are charged-off and loans under “ICP”, E-commerce business and overseas are not included in the delinquency rate calculation.
- GMV refers to the total value of transactions completed for products purchased on our e-commerce and Maiya channel, net of returns.
- Repeated borrowers’ contribution for a given period refers to the principal amount of loans borrowed during that period by borrowers who had previously made at least one successful drawdown as a percentage of the total loan facilitation and origination volume through our platform during that period.
- Adjusted net income attributable to ordinary shareholders of the Company, adjusted net income per ordinary share and per ADS attributable to ordinary shareholders of the Company are non-GAAP financial measures. For more information on non-GAAP financial measures, please see the section of “Use of Non-GAAP Financial Measures Statement” and the tables captioned “Unaudited Reconciliations of GAAP and Non-GAAP Results” set forth at the end of this press release.
Fourth Quarter 2025 Financial Results:
Operating revenue was RMB3,043 million in the fourth quarter of 2025, as compared to RMB3,659 million in the fourth quarter of 2024.
Credit facilitation service income was RMB2,485 million in the fourth quarter of 2025, as compared to RMB2,712 million in the fourth quarter of 2024. The decrease was due to the decrease in loan facilitation and servicing fees-credit oriented and financing income, partially offset by the increases in guarantee income.
Loan facilitation and servicing fees-credit oriented was RMB1,293 million in the fourth quarter of 2025, as compared to RMB1,624 million in the fourth quarter of 2024. The decrease was primarily due to the decrease in the APR of off-balance sheet loans and the decrease in origination of off-balance sheet loans.
Guarantee income was RMB685 million in the fourth quarter of 2025, as compared to RMB577 million in the fourth quarter of 2024. The increase was primarily due to the increase of outstanding balances in the off-balance sheet loans funded by certain institutional funding partners, which are accounted for under ASC 460, Guarantees.
Financing income was RMB506 million in the fourth quarter of 2025, as compared to RMB510 million in the fourth quarter of 2024.
Tech-empowerment service income was RMB170 million in the fourth quarter of 2025, as compared to RMB602 million in the fourth quarter of 2024. The decrease was primarily due to the decrease of loan facilitation volume through ICP.
Installment e-commerce platform service income was RMB388 million in the fourth quarter of 2025, as compared to RMB345 million in the fourth quarter of 2024. The increase was primarily driven by the increase in transaction volume with third-party sellers.
Cost of sales consisted of cost of inventory sold and other costs. Cost of sales was RMB248 million in the fourth quarter of 2025, as compared to RMB353 million in the fourth quarter of 2024. The decrease was primarily driven by the decrease in transaction volume of online direct sales which is recorded on a gross basis.
Funding cost was RMB34.2 million in the fourth quarter of 2025, as compared to RMB57.5 million in the fourth quarter of 2024. The decrease was primarily driven by the decrease in funding rates and balance of funding debts to fund the on-balance sheet loans.
Processing and servicing costs was RMB633 million in the fourth quarter of 2025, as compared to RMB583 million in the fourth quarter of 2024. The increase was primarily due to the increase in risk management expenses.
Provision for financing receivables was RMB250 million in the fourth quarter of 2025, as compared to RMB297 million in the fourth quarter of 2024. The decrease was primarily driven by the increase in performance of oversea business, offset by the increase in the outstanding loan balances of on-balance sheet loans.
Provision for contract assets and receivables was RMB159 million in the fourth quarter of 2025, as compared to RMB154 million in the fourth quarter of 2024.
Provision for contingent guarantee liabilities was RMB935 million in the fourth quarter of 2025, as compared to RMB941 million in the fourth quarter of 2024.
Gross profit was RMB784 million in the fourth quarter of 2025, as compared to RMB1,274 million in the fourth quarter of 2024.
Sales and marketing expenses was RMB388 million in the fourth quarter of 2025, as compared to RMB464 million in the fourth quarter of 2024. The decrease was primarily driven by the decrease in personnel-related costs.
Research and development expenses was RMB132 million in the fourth quarter of 2025, as compared to RMB151 million in the fourth quarter of 2024. The decrease was primarily due to the decrease in personnel-related costs.
General and administrative expenses was RMB70.0 million in the fourth quarter of 2025, as compared to RMB95.3 million in the fourth quarter of 2024. The decrease was primarily driven by the decrease in personnel-related costs.
Change in fair value of financial guarantee derivatives and loans at fair value was a gain of RMB79.4 million in the fourth quarter of 2025, as compared to a loss of RMB144 million in the fourth quarter of 2024. The change was primarily driven by the fair value gains realized as a result of the release of guarantee obligation as loans are repaid, partially offset by the fair value loss from the re-measurement of the expected loss rates.
Income tax expense was RMB51.9 million in the fourth quarter of 2025, as compared to RMB67.6 million in the fourth quarter of 2024. The decrease was primarily due to the decrease in income before income tax expense.
Net income was RMB214 million in the fourth quarter of 2025, as compared to RMB363 million in the fourth quarter of 2024.
Full Year 2025 Financial Results:
Operating revenue was RMB13,152 million in 2025, as compared to RMB14,204 million in 2024.
Credit facilitation service income was RMB9,562 million in 2025, as compared to RMB11,000 million in 2024. The decrease was due to the decrease in loan facilitation and servicing fees-credit oriented and guarantee income, partially offset by the increases in financing income.
Loan facilitation and servicing fees-credit oriented was RMB4,989 million in 2025, as compared to RMB6,326 million in 2024. The decrease was primarily due to the decrease in the APR of off-balance sheet loans and the decrease in origination of off-balance sheet loans.
Guarantee income was RMB2,424 million in 2025, as compared to RMB2,664 million in 2024. The decrease was primarily due to the decrease of annual average outstanding balances in the off-balance sheet loans funded by certain institutional funding partners, which are accounted for under ASC 460, Guarantees.
Financing income was RMB2,150 million in 2025, as compared to RMB2,010 million in 2024. The increase was primarily driven by the increase in the outstanding balances of on-balance sheet loans.
Tech-empowerment service income was RMB2,081 million in 2025, as compared to RMB1,881 million in 2024. The increase was primarily driven by the increase in referral services.
Installment e-commerce platform service income was RMB1,509 million in 2025, as compared to RMB1,322 million in 2024. The increase was primarily driven by the increase in transaction volume with third-party sellers.
Cost of sales consisted of cost of inventory sold and other costs. Cost of sales was RMB1,206 million in 2025, as compared to RMB1,320 million in 2024. The decrease was primarily driven by the decrease in transaction volume of online direct sales which is recorded on a gross basis.
Funding cost was RMB229 million in 2025, as compared to RMB326 million in 2024. The decrease was primarily driven by the decrease in funding rates and balance of funding debts to fund the on-balance sheet loans.
Processing and servicing costs was RMB2,443 million in 2025, as compared to RMB2,292 million in 2024. The increase was primarily driven by the increase in risk management expenses.
Provision for financing receivables was RMB1,017 million in 2025, as compared to RMB866 million in 2024. The increase was primarily due to the increase in the outstanding loan balances of on-balance sheet loans.
Provision for contract assets and receivables was RMB614 million in 2025, as compared to RMB718 million in 2024. The decrease was primarily driven by the decrease of the outstanding loan balances of off-balance sheet loans.
Provision for contingent guarantee liabilities was RMB3,175 million in 2025, as compared to RMB3,656 million in 2024. The decrease was primarily due to the decrease of outstanding balances in the off-balance sheet loans funded by certain institutional funding partners, which are accounted for under ASC 460, Guarantees.
Gross profit was RMB4,469 million in 2025, as compared to RMB5,026 million in 2024.
Sales and marketing expenses was RMB1,919 million in 2025, as compared to RMB1,787 million in 2024. The increase was primarily driven by the increase in online advertising costs.
Research and development expenses was RMB595 million in 2025, as compared to RMB578 million in 2024. The increase was primarily due to the increase in personnel-related costs..
General and administrative expenses was RMB362 million in 2025, as compared to RMB375 million in 2024.
Change in fair value of financial guarantee derivatives and loans at fair value was a gain of RMB508 million in 2025 as compared to a loss of RMB979 million in 2024. The change was primarily driven by the fair value gains realized as a result of the release of guarantee obligation as loans are repaid, partially offset by the fair value loss from the re-measurement of the expected loss rates.
Income tax expense was RMB399 million in 2025, as compared to RMB253 million in 2024. The increase was primarily due to the increase in income before income tax expense.
Net income was RMB1,677 million in 2025, as compared to RMB1,100 million in 2024.
Recent Development
Semi-Annual Dividend
The board of directors of the Company has approved a dividend of US
Update of Share Repurchase Program
Pursuant to the Company’s share repurchase program of up to US
In addition, Mr. Jay Wenjie Xiao has informed the Company that he has purchased a total of approximately 2.3 million ADSs (equivalent to 4.6 million Class A ordinary shares) for approximately US
Business Outlook
Looking ahead, while our risk metrics continue to improve, we remain prudent in light of ongoing macroeconomic uncertainties and expect total loan origination for the first quarter of 2026 to remain flat.
This forecast reflects our current preliminary views, which are subject to the impact of macroeconomic factors. The Company may adjust its performance outlook as appropriate based on evolving circumstances.
Conference Call
The Company’s management will host an earnings conference call at 7:00 AM U.S. Eastern time on March 19, 2026 (7:00 PM Beijing/Hong Kong time on March 19, 2026).
Participants who wish to join the conference call should register online at:
https://register-conf.media-server.com/register/BIa035db521c9d4308ac218dd480679390
Once registration is completed, each participant will receive the dial-in number and a unique access PIN for the conference call.
Participants joining the conference call should dial in at least 10 minutes before the scheduled start time.
A live and archived webcast of the conference call will also be available at the Company's investor relations website at http://ir.lexin.com.
About LexinFintech Holdings Ltd.
We are a leading credit technology-empowered personal financial service enabler. Our mission is to use technology and risk management expertise to make financing more accessible for young generation consumers. We strive to achieve this mission by connecting consumers with financial institutions, where we facilitate through a unique model that includes online and offline channels, installment consumption platform, big data and AI driven credit risk management capabilities, as well as smart user and loan management systems. We also empower financial institutions by providing cutting-edge proprietary technology solutions to meet their needs of financial digital transformation.
For more information, please visit http://ir.lexin.com.
To follow us on Twitter, please go to: https://twitter.com/LexinFintech.
Use of Non-GAAP Financial Measures Statement
In evaluating our business, we consider and use adjusted net income attributable to ordinary shareholders of the Company, non-GAAP EBIT, adjusted net income per ordinary share and per ADS attributable to ordinary shareholders of the Company, four non-GAAP measures, as supplemental measures to review and assess our operating performance. The presentation of the non-GAAP financial measures is not intended to be considered in isolation or as a substitute for the financial information prepared and presented in accordance with U.S. GAAP. We define adjusted net income attributable to ordinary shareholders of the Company as net income attributable to ordinary shareholders of the Company excluding share-based compensation expenses, interest expense associated with convertible notes, and investment income/(loss) and we define non-GAAP EBIT as net income excluding income tax expense, share-based compensation expenses, interest expense, net, and investment income/(loss).
We present these non-GAAP financial measures because they are used by our management to evaluate our operating performance and formulate business plans. Adjusted net income attributable to ordinary shareholders of the Company enables our management to assess our operating results without considering the impact of share-based compensation expenses, interest expense associated with convertible notes, and investment income/(loss). Non-GAAP EBIT, on the other hand, enables our management to assess our operating results without considering the impact of income tax expense, share-based compensation expenses, interest expense, net, and investment income/(loss). We also believe that the use of these non-GAAP financial measures facilitates investors’ assessment of our operating performance. These non-GAAP financial measures are not defined under U.S. GAAP and are not presented in accordance with U.S. GAAP.
These non-GAAP financial measures have limitations as an analytical tool. One of the key limitations of using adjusted net income attributable to ordinary shareholders of the Company and non-GAAP EBIT is that they do not reflect all items of income and expense that affect our operations. Share-based compensation expenses, interest expense associated with convertible notes, income tax expense, interest expense, net, and investment income/(loss) have been and may continue to be incurred in our business and are not reflected in the presentation of adjusted net income attributable to ordinary shareholders of the Company and non-GAAP EBIT. Further, these non-GAAP financial measures may differ from the non-GAAP financial information used by other companies, including peer companies, and therefore their comparability may be limited.
We compensate for these limitations by reconciling each of the non-GAAP financial measures to the most directly comparable U.S. GAAP financial measure, which should be considered when evaluating our performance. We encourage you to review our financial information in its entirety and not rely on a single financial measure.
Exchange Rate Information Statement
This announcement contains translations of certain RMB amounts into U.S. dollars (“US$”) at specified rates solely for the convenience of the reader. Unless otherwise stated, all translations from RMB to US$ were made at the rate of RMB6.9931 to US
Safe Harbor Statement
This announcement contains forward-looking statements. These statements are made under the “safe harbor” provisions of the U.S. Private Securities Litigation Reform Act of 1995. Statements that are not historical facts, including statements about Lexin’s beliefs and expectations, are forward-looking statements. These forward-looking statements can be identified by terminology such as “will,” “expects,” “anticipates,” “future,” “intends,” “plans,” “believes,” “estimates,” “confident” and similar statements. Among other things, the expectation of the collection efficiency and delinquency, business outlook and quotations from management in this announcement, contain forward-looking statements. Lexin may also make written or oral forward-looking statements in its periodic reports to the U.S. Securities and Exchange Commission (the “SEC”), in its annual report to shareholders, in press releases and other written materials and in oral statements made by its officers, directors or employees to third parties. Forward-looking statements involve inherent risks and uncertainties. A number of factors could cause actual results to differ materially from those contained in any forward-looking statement, including but not limited to the following: Lexin’s goal and strategies; Lexin’s expansion plans; Lexin’s future business development, financial condition and results of operations; Lexin’s expectation regarding demand for, and market acceptance of, its credit and investment management products; Lexin’s expectations regarding keeping and strengthening its relationship with borrowers, institutional funding partners, merchandise suppliers and other parties it collaborates with; general economic and business conditions; and assumptions underlying or related to any of the foregoing. Further information regarding these and other risks is included in Lexin’s filings with the SEC. All information provided in this press release and in the attachments is as of the date of this press release, and Lexin does not undertake any obligation to update any forward-looking statement, except as required under applicable law.
For investor and media inquiries, please contact:
LexinFintech Holdings Ltd.
IR inquiries:
Will Tan
Tel: +86 (755) 3637-8888 ext. 6258
E-mail: willtan@lexin.com
Media inquiries:
Ruifeng Xu
Tel: +86 (755) 3637-8888 ext. 6993
E-mail: media@lexin.com
SOURCE LexinFintech Holdings Ltd.
| LexinFintech Holdings Ltd. Unaudited Condensed Consolidated Balance Sheets | ||||||
| As of | ||||||
| (In thousands) | December 31, 2024 | December 31, 2025 | ||||
| RMB | RMB | US$ | ||||
| ASSETS | ||||||
| Current Assets | ||||||
| Cash and cash equivalents | 2,254,213 | 2,156,133 | 308,323 | |||
| Restricted cash | 1,638,479 | 1,717,773 | 245,638 | |||
| Restricted term deposit and short-term investments | 138,497 | 78,458 | 11,219 | |||
| Short-term financing receivables, net(1) | 4,668,715 | 5,450,418 | 779,399 | |||
| Short-term contract assets and receivables, net(1) | 5,448,057 | 3,763,096 | 538,116 | |||
| Deposits to insurance companies and guarantee companies | 2,355,343 | 2,187,609 | 312,824 | |||
| Prepayments and other current assets | 1,321,340 | 2,858,054 | 408,696 | |||
| Amounts due from related parties | 61,722 | 84,531 | 12,088 | |||
| Inventories, net | 22,345 | 24,119 | 3,449 | |||
| Total Current Assets | 17,908,711 | 18,320,191 | 2,619,752 | |||
| Non-current Assets | ||||||
| Restricted cash | 100,860 | 91,937 | 13,147 | |||
| Long-term financing receivables, net(1) | 112,427 | 167,378 | 23,935 | |||
| Long-term contract assets and receivables, net(1) | 317,402 | 317,496 | 45,401 | |||
| Property, equipment and software, net | 613,110 | 895,046 | 127,990 | |||
| Land use rights, net | 862,867 | 828,467 | 118,469 | |||
| Long-term investments | 284,197 | 243,971 | 34,887 | |||
| Deferred tax assets | 1,540,842 | 1,763,235 | 252,139 | |||
| Other assets | 500,363 | 535,242 | 76,539 | |||
| Total Non-current Assets | 4,332,068 | 4,842,772 | 692,507 | |||
| TOTAL ASSETS | 22,240,779 | 23,162,963 | 3,312,259 | |||
| LIABILITIES | ||||||
| Current liabilities | ||||||
| Accounts payable | 74,443 | 101,178 | 14,468 | |||
| Amounts due to related parties | 10,927 | 8,708 | 1,245 | |||
| Short-term borrowings and current portion of long-term borrowings | 690,772 | 905,791 | 129,526 | |||
| Short-term funding debts | 2,754,454 | 2,440,685 | 349,013 | |||
| Deferred guarantee income | 975,102 | 1,305,911 | 186,743 | |||
| Contingent guarantee liabilities | 1,079,000 | 544,191 | 77,818 | |||
| Accruals and other current liabilities | 4,019,676 | 4,371,484 | 625,110 | |||
| Total Current Liabilities | 9,604,374 | 9,677,948 | 1,383,923 | |||
| Non-current Liabilities | ||||||
| Long-term borrowings | 585,024 | 566,015 | 80,939 | |||
| Long-term funding debts | 1,197,211 | 850,590 | 121,633 | |||
| Deferred tax liabilities | 91,380 | 105,212 | 15,045 | |||
| Other long-term liabilities | 22,784 | 10,567 | 1,511 | |||
| Total Non-current Liabilities | 1,896,399 | 1,532,384 | 219,128 | |||
| TOTAL LIABILITIES | 11,500,773 | 11,210,332 | 1,603,051 | |||
| Shareholders’ equity: | ||||||
| Class A Ordinary Shares | 205 | 209 | 32 | |||
| Class B Ordinary Shares | 41 | 41 | 7 | |||
| Treasury stock | (328,764 | ) | (493,846 | ) | (70,619 | ) |
| Additional paid-in capital | 3,314,866 | 3,396,667 | 485,717 | |||
| Statutory reserves | 1,178,309 | 1,260,923 | 180,310 | |||
| Accumulated other comprehensive income | (29,559 | ) | (27,597 | ) | (3,946 | ) |
| Retained earnings | 6,604,908 | 7,816,234 | 1,117,707 | |||
| Total shareholders’ equity | 10,740,006 | 11,952,631 | 1,709,208 | |||
| TOTAL LIABILITIES AND SHAREHOLDERS’ EQUITY | 22,240,779 | 23,162,963 | 3,312,259 | |||
| ___ | _________________________________ |
| (1) | Short-term financing receivables, net of allowance for credit losses of RMB102,124 and RMB198,694 as of December 31, 2024 and December 31, 2025, respectively. Short-term contract assets and receivables, net of allowance for credit losses of RMB409,590 and RMB259,054 as of December 31, 2024 and December 31, 2025, respectively. Long-term financing receivables, net of allowance for credit losses of RMB1,820 and RMB3,723 as of December 31, 2024 and December 31, 2025, respectively. Long-term contract assets and receivables, net of allowance for credit losses of RMB30,919 and RMB14,569 as of December 31, 2024 and December 31, 2025, respectively. |
| LexinFintech Holdings Ltd. Unaudited Condensed Consolidated Statements of Operations | |||||||||||||
| For the Three Months Ended December 31, | For the Year Ended December 31, | ||||||||||||
| (In thousands, except for share and per share data) | 2024 | 2025 | 2024 | 2025 | |||||||||
| RMB | RMB | US$ | RMB | RMB | US$ | ||||||||
| Operating revenue: | |||||||||||||
| Credit facilitation service income | 2,712,066 | 2,484,555 | 355,286 | 10,999,931 | 9,562,072 | 1,367,358 | |||||||
| Loan facilitation and servicing fees-credit oriented | 1,624,410 | 1,293,440 | 184,959 | 6,325,924 | 4,988,562 | 713,355 | |||||||
| Guarantee income | 577,168 | 684,863 | 97,934 | 2,663,824 | 2,423,570 | 346,566 | |||||||
| Financing income | 510,488 | 506,252 | 72,393 | 2,010,183 | 2,149,940 | 307,437 | |||||||
| Tech-empowerment service income | 601,693 | 170,317 | 24,355 | 1,881,376 | 2,081,335 | 297,627 | |||||||
| Installment e-commerce platform service income | 345,074 | 388,204 | 55,512 | 1,322,287 | 1,508,680 | 215,738 | |||||||
| Total operating revenue | 3,658,833 | 3,043,076 | 435,153 | 14,203,594 | 13,152,087 | 1,880,723 | |||||||
| Operating cost | |||||||||||||
| Cost of sales | (352,749 | ) | (248,121 | ) | (35,481 | ) | (1,319,526 | ) | (1,206,033 | ) | (172,460 | ) | |
| Funding cost | (57,471 | ) | (34,185 | ) | (4,888 | ) | (326,451 | ) | (228,958 | ) | (32,741 | ) | |
| Processing and servicing cost | (583,119 | ) | (632,479 | ) | (90,443 | ) | (2,291,904 | ) | (2,442,557 | ) | (349,281 | ) | |
| Provision for financing receivables | (296,741 | ) | (250,218 | ) | (35,781 | ) | (865,524 | ) | (1,016,742 | ) | (145,392 | ) | |
| Provision for contract assets and receivables | (153,968 | ) | (158,797 | ) | (22,708 | ) | (718,413 | ) | (614,364 | ) | (87,853 | ) | |
| Provision for contingent guarantee liabilities | (940,740 | ) | (935,194 | ) | (133,731 | ) | (3,655,548 | ) | (3,174,787 | ) | (453,989 | ) | |
| Total operating cost | (2,384,788 | ) | (2,258,994 | ) | (323,032 | ) | (9,177,366 | ) | (8,683,441 | ) | (1,241,716 | ) | |
| Gross profit | 1,274,045 | 784,082 | 112,121 | 5,026,228 | 4,468,646 | 639,007 | |||||||
| Operating expenses: | |||||||||||||
| Sales and marketing expenses | (464,263 | ) | (388,093 | ) | (55,497 | ) | (1,787,299 | ) | (1,918,894 | ) | (274,398 | ) | |
| Research and development expenses | (151,081 | ) | (131,947 | ) | (18,868 | ) | (578,243 | ) | (595,316 | ) | (85,129 | ) | |
| General and administrative expenses | (95,335 | ) | (69,964 | ) | (10,005 | ) | (374,481 | ) | (361,819 | ) | (51,739 | ) | |
| Total operating expenses | (710,679 | ) | (590,004 | ) | (84,370 | ) | (2,740,023 | ) | (2,876,029 | ) | (411,266 | ) | |
| Change in fair value of financial guarantee derivatives and loans at fair value | (143,619 | ) | 79,433 | 11,359 | (979,234 | ) | 508,160 | 72,666 | |||||
| Interest expense, net | (2,560 | ) | (8,015 | ) | (1,146 | ) | (9,007 | ) | (22,732 | ) | (3,251 | ) | |
| Investment loss | (543 | ) | (3,503 | ) | (501 | ) | (2,417 | ) | (21,903 | ) | (3,132 | ) | |
| Others, net | 13,754 | 4,014 | 574 | 58,188 | 19,461 | 2,783 | |||||||
| Income before income tax expense | 430,398 | 266,007 | 38,037 | 1,353,735 | 2,075,603 | 296,807 | |||||||
| Income tax expense | (67,649 | ) | (51,923 | ) | (7,425 | ) | (253,275 | ) | (398,526 | ) | (56,988 | ) | |
| Net income | 362,749 | 214,084 | 30,612 | 1,100,460 | 1,677,077 | 239,819 | |||||||
| Net income attributable to ordinary shareholders of the Company | 362,749 | 214,084 | 30,612 | 1,100,460 | 1,677,077 | 239,819 | |||||||
| Net income per ordinary share attributable to ordinary shareholders of the Company | |||||||||||||
| Basic | 1.09 | 0.64 | 0.09 | 3.32 | 4.95 | 0.71 | |||||||
| Diluted | 1.03 | 0.62 | 0.09 | 3.24 | 4.72 | 0.68 | |||||||
| Net income per ADS attributable to ordinary shareholders of the Company | |||||||||||||
| Basic | 2.18 | 1.27 | 0.18 | 6.64 | 9.90 | 1.42 | |||||||
| Diluted | 2.06 | 1.24 | 0.18 | 6.49 | 9.45 | 1.35 | |||||||
| Weighted average ordinary shares outstanding | |||||||||||||
| Basic | 333,182,976 | 336,234,641 | 336,234,641 | 331,403,936 | 338,943,939 | 338,943,939 | |||||||
| Diluted | 351,577,582 | 346,075,067 | 346,075,067 | 339,261,349 | 355,089,877 | 355,089,877 | |||||||
| LexinFintech Holdings Ltd. Unaudited Condensed Consolidated Statements of Comprehensive Income | ||||||||||||
| For the Three Months Ended December 31, | For the Year Ended December 31, | |||||||||||
| (In thousands) | 2024 | 2025 | 2024 | 2025 | ||||||||
| RMB | RMB | US$ | RMB | RMB | US$ | |||||||
| Net income | 362,749 | 214,084 | 30,612 | 1,100,460 | 1,677,077 | 239,819 | ||||||
| Other comprehensive income | ||||||||||||
| Foreign currency translation adjustment, net of nil tax | 642 | (1,297 | ) | (185 | ) | (16,014 | ) | 1,962 | 281 | |||
| Total comprehensive income | 363,391 | 212,787 | 30,427 | 1,084,446 | 1,679,039 | 240,100 | ||||||
| Total comprehensive income attributable to ordinary shareholders of the Company | 363,391 | 212,787 | 30,427 | 1,084,446 | 1,679,039 | 240,100 | ||||||
| LexinFintech Holdings Ltd. Unaudited Reconciliations of GAAP and Non-GAAP Results | |||||||||||
| For the Three Months Ended December 31, | For the Year Ended December 31, | ||||||||||
| (In thousands, except for share and per share data) | 2024 | 2025 | 2024 | 2025 | |||||||
| RMB | RMB | US$ | RMB | RMB | US$ | ||||||
| Reconciliation of Adjusted net income attributable to ordinary shareholders of the Company to Net income attributable to ordinary shareholders of the Company | |||||||||||
| Net income attributable to ordinary shareholders of the Company | 362,749 | 214,084 | 30,612 | 1,100,460 | 1,677,077 | 239,819 | |||||
| Add: Share-based compensation expenses | 27,244 | 21,119 | 3,020 | 94,623 | 96,175 | 13,753 | |||||
| Investment loss | 543 | 3,503 | 501 | 2,417 | 21,903 | 3,132 | |||||
| Adjusted net income attributable to ordinary shareholders of the Company | 390,536 | 238,706 | 34,133 | 1,203,195 | 1,795,155 | 256,704 | |||||
| Adjusted net income per ordinary share attributable to ordinary shareholders of the Company | |||||||||||
| Basic | 1.17 | 0.71 | 0.10 | 3.63 | 5.30 | 0.76 | |||||
| Diluted | 1.11 | 0.69 | 0.10 | 3.55 | 5.06 | 0.72 | |||||
| Adjusted net income per ADS attributable to ordinary shareholders of the Company | |||||||||||
| Basic | 2.34 | 1.42 | 0.20 | 7.26 | 10.59 | 1.51 | |||||
| Diluted | 2.22 | 1.38 | 0.20 | 7.09 | 10.11 | 1.45 | |||||
| Weighted average shares used in calculating net income per ordinary share for non-GAAP EPS | |||||||||||
| Basic | 333,182,976 | 336,234,641 | 336,234,641 | 331,403,936 | 338,943,939 | 338,943,939 | |||||
| Diluted | 351,577,582 | 346,075,067 | 346,075,067 | 339,261,349 | 355,089,877 | 355,089,877 | |||||
| Reconciliations of Non-GAAP EBIT to Net income | |||||||||||
| Net income | 362,749 | 214,084 | 30,612 | 1,100,460 | 1,677,077 | 239,819 | |||||
| Add: Income tax expense | 67,649 | 51,923 | 7,425 | 253,275 | 398,526 | 56,988 | |||||
| Share-based compensation expenses | 27,244 | 21,119 | 3,020 | 94,623 | 96,175 | 13,753 | |||||
| Interest expense, net | 2,560 | 8,015 | 1,146 | 9,007 | 22,732 | 3,251 | |||||
| Investment loss | 543 | 3,503 | 501 | 2,417 | 21,903 | 3,132 | |||||
| Non-GAAP EBIT | 460,745 | 298,644 | 42,704 | 1,459,782 | 2,216,413 | 316,943 | |||||
Additional Credit Information
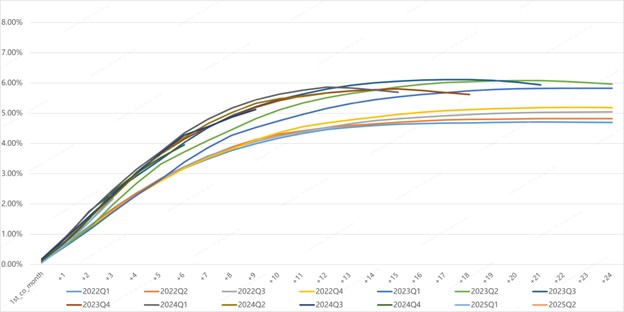
Vintage Charge Off Curve1
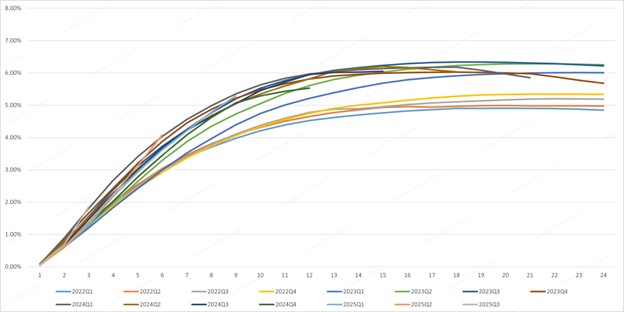
Dpd30+/GMV by Performance Windows1
First Payment Default 30+1
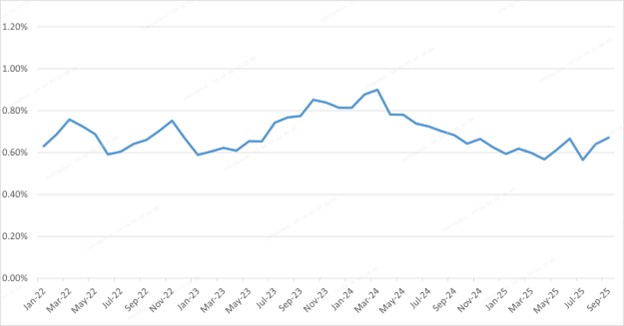
1.Loans facilitated under ICP and E-commerce business are excluded from the charts.

FAQ
AI-generated questions and answers. How Rhea-AI works. Not financial advice.