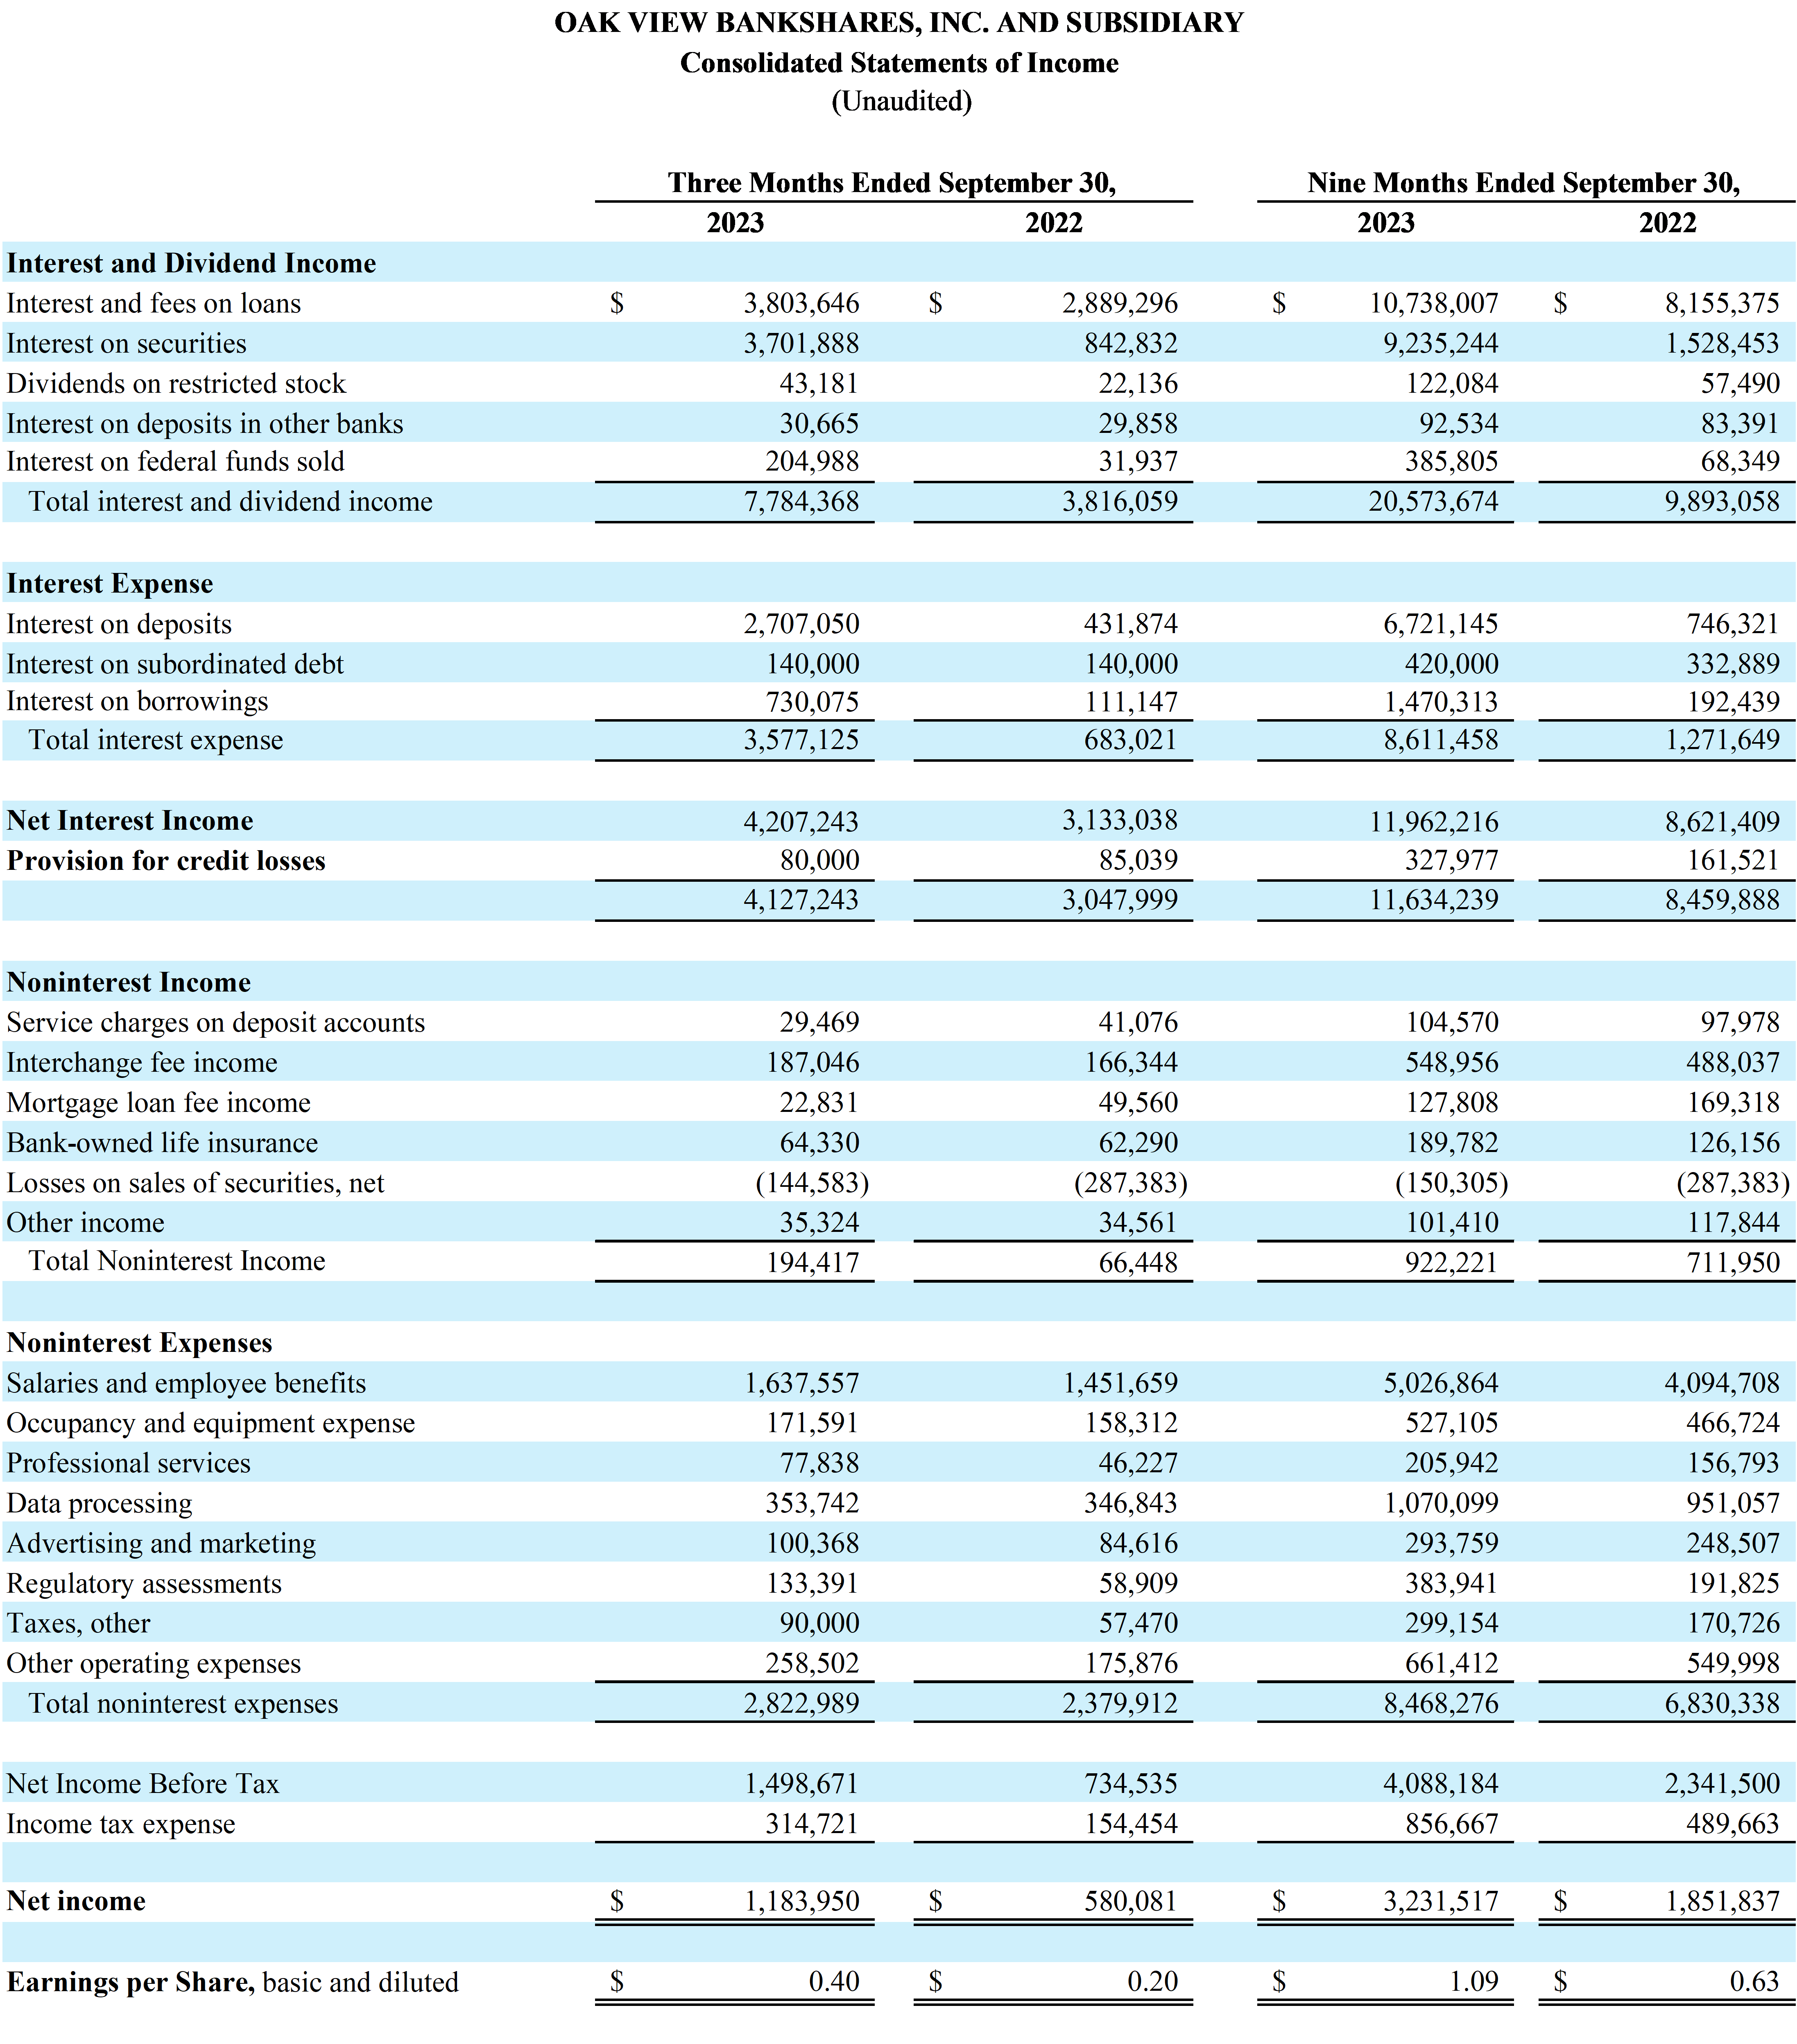
Warrenton, VA, October 23, 2023 - Oak View Bankshares, Inc. (the "Company") (OTC Pink: OAKV), parent company of Oak View National Bank (the "Bank"), reported net income of $1.18 million for the quarter ended September 30, 2023, compared to net income of $580,081 for the quarter ended September 30, 2022, an increase of 104.10%. Basic and diluted earnings per share for the third quarter were $0.40 compared to $0.20 per share for the third quarter of 2022.
Net income for the nine months ended September 30, 2023, was $3.23 million, compared to $1.85 million for the nine months ended September 30, 2022, an increase of 74.50%. Basic and diluted earnings per share for the nine months ended September 30, 2023, were $1.09 compared to $0.63 for the nine months ended September 30, 2022.
Selected Highlights:
Return on average assets was 0.81% and return on average equity was 15.75% for the quarter ended September 30, 2023, compared to 0.55% and 8.17%, respectively, for the quarter ended September 30, 2022. Return on average assets was 0.78% and return on average equity was 14.90% for the nine months ended September 30, 2023, compared to 0.64% and 9.64%, respectively, for the nine months ended September 30, 2022.
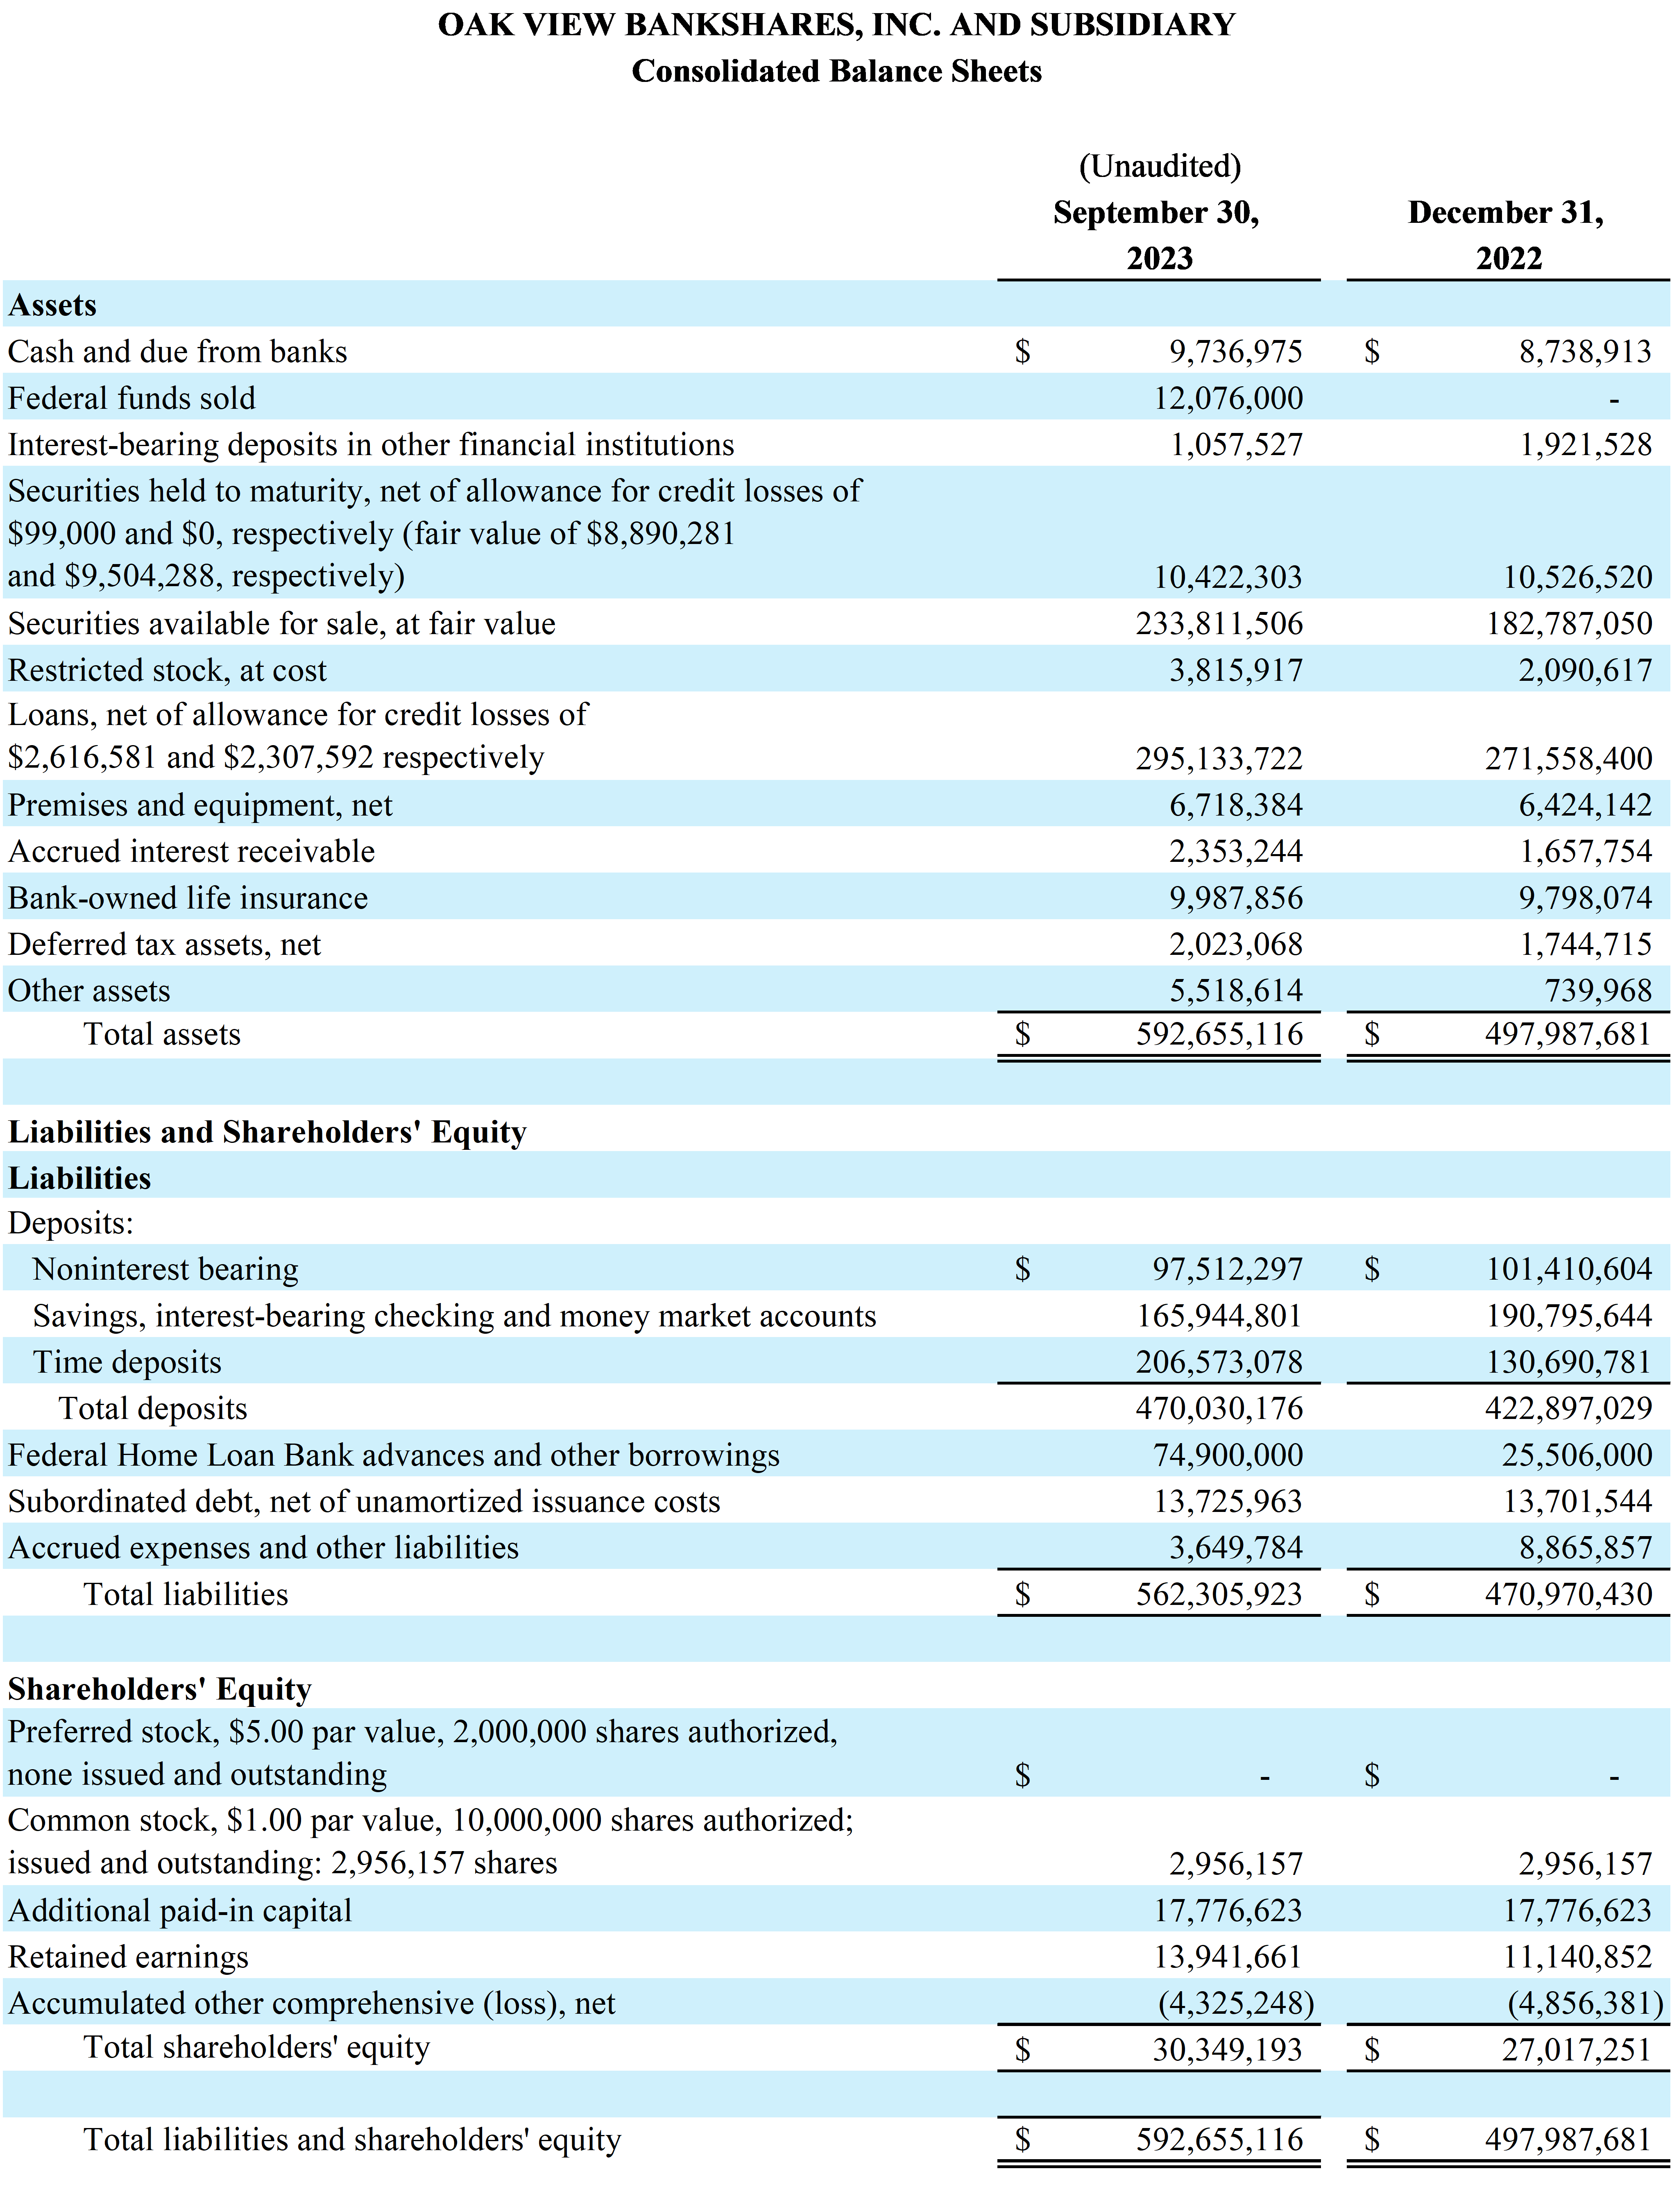
Total assets were $592.66 million on September 30, 2023, compared to $497.99 million on December 31, 2022.
Total loans were $297.75 million on September 30, 2023, compared to $273.87 million on December 31, 2022.
Total securities were $244.23 million on September 30, 2023, compared to $193.31 million on December 31, 2022.
Total deposits were $470.03 million on September 30, 2023, compared to $422.90 million on December 31, 2022.
Asset quality remains strong with no nonperforming loans as of September 30, 2023, and one past due loan totaling $2,716 as of September 30, 2023.
Regulatory capital remains strong with ratios exceeding the "well capitalized" thresholds in all categories.
Liquidity remains strong at $436.57 million as of September 30, 2023, compared to $379.25 million as of December 31, 2022. Liquidity includes cash, unencumbered securities available-for-sale, and available secured and unsecured borrowing capacity.
Michael Ewing, Chairman of the Board and CEO said, "Over 100% earnings growth on a quarter-over-quarter basis is a wonderful outcome in an exceptionally challenging interest rate environment for most community banks. We continue to strategically assess the Company's financial position to make necessary adjustments in deploying the capital entrusted to us to seek the optimal balance among safety and soundness, profitability, and growth - in that order. Our disciplined approach continues to contribute to higher levels of earnings for the quarter and year-to-date results."
Mr. Ewing concluded, "Our balance sheet remains strong, our asset quality continues to be superb, the number of deposit accounts, as well as balances, continue to grow and on-hand liquidity provides added strength to our financial position. Our team of passionate community bankers understands that a strong community bank builds better communities, and we strive to provide an organization that will remain focused on the financial needs of our customers, supporting our communities and optimizing shareholder value."
Net Interest Income
The net interest margin was 3.01% for the quarter ended September 30, 2023, compared to 3.17% for the quarter ended September 30, 2022. The net interest margin was 3.05% and 3.14% for the nine months ended September 30, 2023, and 2022, respectively.
Interest income increased $3.97 million and $10.68 million for the quarter and nine months ended September 30, 2023, respectively, when compared to the quarter and nine months ended September 30, 2022, as a result of the Company's strategy to deploy capital into investments with attractive risk and return characteristics and increased loan income due primarily to the higher interest rate environment.
Total interest expense increased $2.89 million and $7.34 million for the quarter and nine months ended September 30, 2023, respectively, when compared to the quarter and nine months ended September 30, 2022. Increases in interest expense were primarily attributable to interest expense related to the issuance of subordinated debt in February 2022, interest expense paid on deposits resulting from increases in volume and in interest rates, and interest expense paid on FHLB advances and other borrowings due to higher balances needed to deploy capital into higher yielding investment opportunities.
Noninterest Income
Noninterest income was $194,417 and $922,221 for the quarter and nine months ended September 30, 2023, respectively, compared to $66,448 and $711,950 for the quarter and nine months ended September 30, 2022, respectively. Debit card interchange fee income was the largest contributor of noninterest income which totaled $187,046 and $548,956, for the quarter and nine months ended September 30, 2023, respectively.
During the quarter, the Company sold $18.45 million of investments with a weighted average rate of 2.78% and
redeployed the proceeds into assets with more attractive risk and return characteristics. As part of the portfolio
repositioning, the Company incurred a net loss of $144,583 for the quarter ended September 30, 2023.
Noninterest Expense
Noninterest expenses were $2.82 million and $8.47 million for the quarter and nine months ended September 30, 2023, respectively, compared to $2.38 million and $6.83 million for the quarter and nine months ended September 30, 2022, respectively.
Salaries and employee benefits were the largest category of noninterest expense, which totaled $1.64 million and $5.03 million for the quarter and nine months ended September 30, 2023, respectively, an increase of 12.81% and 22.76%, over the quarter and nine months ended September 30, 2022, respectively. The increase in employee health insurance premiums and quarterly employee incentive compensation were the main contributors to increased expenses for the quarter and nine months ended September 30, 2023.
Liquidity
The Company's liquidity position continues to be very strong with $436.57 million of liquid assets available which included cash, unencumbered securities available for sale, and secured and unsecured borrowing capacity as of September 30, 2023, compared to $379.25 million as of December 31, 2022.
The Company's deposits proved to be stable with core deposits, which are defined as total deposits excluding brokered deposits, of $439.35 million as of September 30, 2023, compared to $401.75 million as of December 31, 2022. Uninsured deposits, those deposits that exceed FDIC insurance limits, were $81.33 million as of September 30, 2023, or 17.30% of total deposits, well within industry averages.
Asset Quality
The Company adopted the recent accounting pronouncement for current expected credit losses ("CECL"), effective January 1, 2023. Prior to CECL's effective date, the Company accounted for the allowance for loan losses under the incurred loss model.
As of September 30, 2023, the allowance for credit losses related to the loan portfolio was $2.62 million or 0.88% of outstanding loans,net of unearned income, compared to $2.31 million or 0.84% of outstanding loans, net of unearned income, on December 31, 2022. As of September 30, 2023, the Company had no nonperforming loans and one past due loan which totaled $2,716. As of December 31, 2022, the Company had one loan 90 or more days past due and still accruing interest, which totaled $18,345. This loan originated under the Small Business Administration ("SBA") Paycheck Protection Program with full principal payment received during the second quarter of 2023.
Shareholders' Equity
Shareholders' equity was $30.35 million on September 30, 2023, compared to $27.02 million on December 31, 2022.
Accumulated other comprehensive loss represents unrealized losses related primarily to mark-to-market adjustments resulting from rising interest rates on the available-for-sale securities portfolio and totaled $4.33 million as of September 30, 2023, compared to $4.86 million as of December 31, 2022.
About Oak View Bankshares, Inc. and Oak View National Bank
Oak View Bankshares, Inc. is the parent bank holding company for Oak View National Bank, a locally owned and managed community bank serving Fauquier, Culpeper, Rappahannock, and surrounding Counties. For more information about Oak View Bankshares, Inc. and Oak View National Bank, please visit our website at www.oakviewbank.com. Member FDIC.
For additional information, contact Tammy Frazier, Executive Vice President & Chief Financial Officer, Oak View Bankshares, Inc., at 540.359.7155.