Qudian Inc. Reports First Quarter 2021 Unaudited Financial Results
Rhea-AI Summary
Qudian Inc. (NYSE: QD) reported its Q1 2021 financial results, revealing total revenues of RMB515.7 million (US$78.7 million), down 46.2% year-over-year. Notably, net income soared to RMB478.4 million (US$73.0 million) compared to a loss of RMB486.5 million in Q1 2020. The company’s cash and cash equivalents stood at RMB2.2 billion (US$333.9 million). However, the number of outstanding borrowers decreased by 8% to 3 million, reflecting a conservative lending strategy. The D1 delinquency rate improved to below 5%, indicating enhanced asset quality amidst regulatory challenges.
Positive
- Net income of RMB478.4 million (US$73.0 million) vs. loss of RMB486.5 million in Q1 2020.
- Improvement in D1 delinquency rate to below 5%.
- Cash and cash equivalents at RMB2.2 billion (US$333.9 million) indicating strong liquidity.
Negative
- Total revenues decreased by 46.2% compared to Q1 2020.
- Outstanding borrowers fell by 8% to 3 million.
- Outstanding loan balance decreased by 15.1% to RMB4.1 billion.
News Market Reaction – QD
In the trading session that priced this news, QD declined 1.64%, reflecting a mild negative market reaction.
Data tracked by StockTitan Argus on the day of publication.
AI-generated analysis. How Rhea-AI works. Not financial advice.
XIAMEN, China, June 15, 2021 /PRNewswire/ -- Qudian Inc. ("Qudian" or "the Company" or "We") (NYSE: QD), a leading technology platform empowering the enhancement of online consumer finance experience in China, today announced its unaudited financial results for the quarter ended March 31, 2021.
First Quarter 2021 Operational Highlights:
- Number of outstanding borrowers[1] from loan book business as of March 31, 2021 decreased by
8.0% to 3.0 million from 3.2 million as of December 31, 2020 as a result of the conservative and prudent strategy which the Company has deployed - Total outstanding loan balance from loan book business[2] decreased by
15.1% to RMB4.1 billion as of March 31, 2021, compared to the outstanding balance as of December 31, 2020 - Amount of transactions from loan book business for this quarter decreased by
8.4% to RMB4.4 billion from the fourth quarter of 2020; Amount of transactions serviced on open platform for this quarter decreased by15.2% to RMB210.4 million from the fourth quarter of 2020 - Weighted average loan tenure for our loan book business was 4.5 months for this quarter, compared with 4.5 months for the fourth quarter of 2020; Weighted average loan tenure for transactions serviced on open platform was 6.7 months for this quarter, compared with 6.4 months for the fourth quarter of 2020
[1] Outstanding borrowers are borrowers who have outstanding loans from the Company's loan book business as of a particular date. [2] Includes (i) off and on balance sheet loans directly or indirectly funded by our institutional funding partners or our own capital, net of cumulative write-offs and (ii) does not include auto loans from Dabai Auto business. |
First Quarter 2021 Financial Highlights:
- Total revenues were RMB515.7 million (US
$78.7 million ), representing a decrease of46.2% from the same period of last year - Net income attributable to Qudian's shareholders were RMB478.4 million (US
$73.0 million ), compared to a loss of RMB486.5 million from the same period of last year, or RMB1.81 (US$0.28) per diluted ADS - Non-GAAP net income attributable to Qudian's shareholders[3] were RMB488.3 million (US
$74.5 million ), compared to non-GAAP net loss attributable to Qudian's shareholders of RMB907.5 million from the same period of last year, or RMB1.85 (US$0.28) per diluted ADS
[3] For more information on this Non-GAAP financial measure, please see the table captioned "Unaudited Reconciliation of GAAP and Non-GAAP Results" set forth at the end of this press release. |
"In the first quarter of 2021, we continued to execute a prudent operational strategy related to our cash credit business amid an evolving regulatory environment, while making significant strides to advance our early childhood education business initiative," said Mr. Min Luo, Founder, Chairman and Chief Executive Officer of Qudian. "Our stringent credit risk control measures further improved our asset quality, evidenced by the continued decrease of the D1 delinquency rate for our loan book business[4], which dropped to a normal level of less than
"We are delighted to officially launch our first WLM KIDS activities center in January in Xiamen. The opening marked a major milestone in the development of our early childhood education business, where we strive to provide a comprehensive suite of one-stop services for children's extra-curricular enrichment. As we work to open more WLM KIDS activities centers in cities across the nation, we are advancing our mission to help children in China grow up both happy and healthy. The incremental spending in our WLM KIDS business may place pressure on our profitability in the near term, but we believe over the long term the WLM KIDS business will enjoy superior unit economics compared with many other offline businesses. Supported by our strong financial position, we remain optimistic that we can continue to grow our overall business and deliver sustainable value to our shareholders," said Ms. Sissi Zhu, Vice President of Investor Relations of Qudian.
[4] "D1 delinquency rate" is defined as (i) the total amount of principal and financing service fees that became overdue as of a specified date, divided by (ii) the total amount of principal and financing services fees that was due for repayment as of such date, in each case with respect to our loan book business. |
First Quarter Financial Results
Total revenues were RMB515.7 million (US
Financing income totaled RMB361.8 million (US
Loan facilitation income and other related income decreased by
Transaction services fee and other related income increased to RMB50.6 million (US
Sales income and others increased to RMB62.5 million (US
Sales commission fee decreased by
Total operating costs and expenses decreased by
Cost of revenues decreased by
Sales and marketing expenses decreased by
General and administrative expenses decreased by
Research and development expenses decreased by
Provision for receivables and other assets was a reversal of RMB106.8 million (US
As of March 31, 2021, the total balance of outstanding principal and financing service fee receivables for on-balance sheet transactions for which any installment payment was more than 30 calendar days past due was RMB203.0 million (US
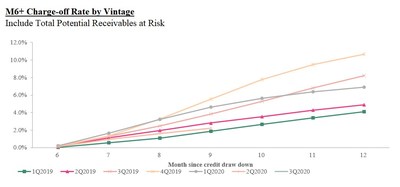
The following charts display the "vintage charge-off rate." Total potential receivables at risk vintage charge-off rate refers to, with respect to on- and off-balance sheet transactions facilitated under the loan book business during a specified time period, the total potential outstanding principal balance of the transactions that are delinquent for more than 180 days up to twelve months after origination, divided by the total initial principal of the transactions facilitated in such vintage. Delinquencies may increase or decrease after such 12-month period.
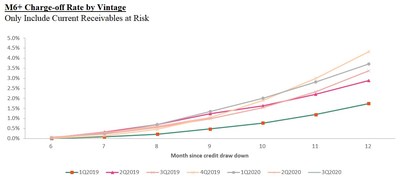
Current receivables at risk vintage charge-off rate refers to, with respect to on- and off-balance sheet transactions facilitated under the loan book business during a specified time period, the actual outstanding principal balance of the transactions that are delinquent for more than 180 days up to twelve months after origination, divided by the total initial principal of the transactions facilitated in such vintage. Delinquencies may increase or decrease after such 12-month period.
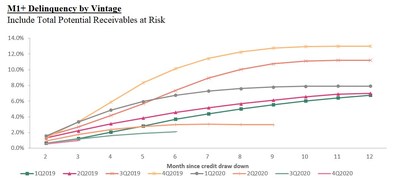
Total potential receivables at risk M1+ delinquency rate by vintage refers to, with respect to on- and off-balance sheet transactions facilitated under the loan book business during a specified time period, the total potential outstanding principal balance of the transactions that are delinquent for more than 30 days up to twelve months after origination, divided by the total initial principal of the transactions facilitated in such vintage. Delinquencies may increase or decrease after such 12-month period.
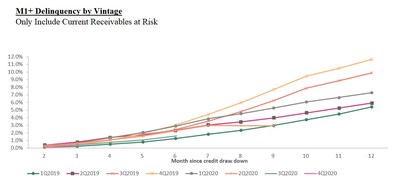
Current receivables at risk M1+ delinquency rate by vintage refers to, with respect to on- and off-balance sheet transactions facilitated under the loan book business during a specified time period, the actual outstanding principal balance of the transactions that are delinquent for more than 30 days up to twelve months after origination, divided by the total initial principal of the transactions facilitated in such vintage. Delinquencies may increase or decrease after such 12-month period.
Income from operations was RMB464.8 million (US
Net income attributable to Qudian's shareholders was RMB478.4 million (US
Non-GAAP net income attributable to Qudian's shareholders was RMB488.3 million (US
Cash Flow
As of March 31, 2021, the Company had cash and cash equivalents of RMB2,187.5 million (US
For the first quarter of 2021, net cash provided by operating activities was RMB202.7 million (US
Conference Call
The Company's management will host an earnings conference call on June 15, 2021 at 7:00 AM U.S. Eastern Time (7:00 PM Beijing/Hong Kong Time). Details for the conference call are as follows:
Title of Event: | Qudian Inc. First Quarter 2021 Earnings Conference Call |
Conference ID: | 8562567 |
Registration link: |
For participants who wish to join the call, please complete the online registration at least 15 minutes prior to the scheduled call start time. Upon registration, participants will receive the conference call access information, including participant dial-in numbers, a Direct Event Passcode, a unique Registrant ID, and an e-mail with detailed instructions to join the conference call.
Additionally, a live and archived webcast of the conference call will be available on the Company's investor relations website at http://ir.qudian.com.
A replay of the conference call will be accessible approximately two hours after the conclusion of the live call until June 22, 2021, by dialing the following telephone numbers:
United States: | +1-855-452-5696 (toll-free) / +1-646-254-3697 | |||||
International: | +61-2-8199-0299 | |||||
Hong Kong, China: | 800-963-117 (toll-free) / +852-3051-2780 | |||||
Mainland China: | 400-632-2162 / 800-870-0205 (toll-free) | |||||
Passcode: | 8562567 | |||||
About Qudian Inc.
Qudian Inc. ("Qudian") is a leading technology platform empowering the enhancement of online consumer finance experience in China. The Company's mission is to use technology to make personalized credit accessible to hundreds of millions of young, mobile-active consumers in China who need access to small credit for their discretionary spending but are underserved by traditional financial institutions due to lack of traditional credit data or high cost of servicing. Qudian's credit solutions enable licensed, regulated financial institutions and ecosystem partners to offer affordable and customized loans to this young generation of consumers.
For more information, please visit http://ir.qudian.com.
Use of Non-GAAP Financial Measures
We use adjusted net income/loss, a Non-GAAP financial measure, in evaluating our operating results and for financial and operational decision-making purposes. We believe that adjusted net income/loss helps identify underlying trends in our business by excluding the impact of share-based compensation expenses, which are non-cash charges, and convertible bonds buyback income. We believe that adjusted net income/loss provides useful information about our operating results, enhances the overall understanding of our past performance and future prospects and allows for greater visibility with respect to key metrics used by our management in its financial and operational decision-making.
Adjusted net income/loss is not defined under U.S. GAAP and are not presented in accordance with U.S. GAAP. This Non-GAAP financial measure has limitations as analytical tools, and when assessing our operating performance, cash flows or our liquidity, investors should not consider them in isolation, or as a substitute for net loss / income, cash flows provided by operating activities or other consolidated statements of operation and cash flow data prepared in accordance with U.S. GAAP.
We mitigate these limitations by reconciling the Non-GAAP financial measure to the most comparable U.S. GAAP performance measure, all of which should be considered when evaluating our performance.
For more information on this Non-GAAP financial measure, please see the table captioned "Unaudited Reconciliation of GAAP and Non-GAAP Results" set forth at the end of this press release.
Exchange Rate Information
This announcement contains translations of certain RMB amounts into U.S. dollars ("US$") at specified rates solely for the convenience of the reader. Unless otherwise stated, all translations from RMB to US$ were made at the rate of RMB6.5518 to US
Statement Regarding Preliminary Unaudited Financial Information
The unaudited financial information set out in this earnings release is preliminary and subject to potential adjustments. Adjustments to the consolidated financial statements may be identified when audit work has been performed for the Company's year-end audit, which could result in significant differences from this preliminary unaudited financial information.
Safe Harbor Statement
This announcement contains forward-looking statements. These statements are made under the "safe harbor" provisions of the United States Private Securities Litigation Reform Act of 1995. These forward-looking statements can be identified by terminology such as "will," "expects," "anticipates," "future," "intends," "plans," "believes," "estimates" and similar statements. Among other things, the expectation of its collection efficiency and delinquency, contain forward-looking statements. Qudian may also make written or oral forward-looking statements in its periodic reports to the SEC, in its annual report to shareholders, in press releases and other written materials and in oral statements made by its officers, directors or employees to third parties. Statements that are not historical facts, including statements about Qudian's beliefs and expectations, are forward-looking statements. Forward-looking statements involve inherent risks and uncertainties. A number of factors could cause actual results to differ materially from those contained in any forward-looking statement, including but not limited to the following: Qudian's goal and strategies; Qudian's expansion plans; Qudian's future business development, financial condition and results of operations; Qudian's expectations regarding demand for, and market acceptance of, its credit products; Qudian's expectations regarding keeping and strengthening its relationships with borrowers, institutional funding partners, merchandise suppliers and other parties it collaborate with; general economic and business conditions; and assumptions underlying or related to any of the foregoing. Further information regarding these and other risks is included in Qudian's filings with the SEC. All information provided in this press release and in the attachments is as of the date of this press release, and Qudian does not undertake any obligation to update any forward-looking statement, except as required under applicable law.
For investor and media inquiries, please contact:
Qudian Inc.
Tel: +86-592-591-1711
E-mail: ir@qudian.com
The Piacente Group, Inc.
Jenny Cai
Tel: +86 (10) 6508-0677
E-mail: qudian@tpg-ir.com
The Piacente Group, Inc.
Brandi Piacente
Tel: +1-212-481-2050
E-mail: qudian@tpg-ir.com
QUDIAN INC. | |||||||
Unaudited Condensed Consolidated Statements of Operations | |||||||
Three months ended March 31, | |||||||
(In thousands except for number | 2020 | 2021 | |||||
of shares and per-share data) | (Unaudited) | (Unaudited) | (Unaudited) | ||||
RMB | RMB | US$ | |||||
Revenues: | |||||||
Financing income | 622,683 | 361,754 | 55,215 | ||||
Sales commission fee | 33,713 | 10,748 | 1,640 | ||||
Sales income and others | 17,056 | 62,530 | 9,544 | ||||
Penalty fee | 12,381 | 17,823 | 2,720 | ||||
Loan facilitation income and other related income | 422,443 | 12,200 | 1,862 | ||||
Transaction services fee and other related income | (150,415) | 50,649 | 7,731 | ||||
Total revenues | 957,861 | 515,704 | 78,712 | ||||
Operating cost and expenses: | |||||||
Cost of revenues | (95,615) | (91,012) | (13,891) | ||||
Sales and marketing | (58,805) | (37,559) | (5,733) | ||||
General and administrative | (76,550) | (66,693) | (10,179) | ||||
Research and development | (54,725) | (39,190) | (5,982) | ||||
Changes in guarantee liabilities and risk assurance liabilities(1) | (672,408) | 64,379 | 9,826 | ||||
Provision for receivables and other assets | (1,108,451) | 106,809 | 16,302 | ||||
Total operating cost and expenses | (2,066,554) | (63,266) | (9,657) | ||||
Other operating income | 147,571 | 12,371 | 1,888 | ||||
Income/(Loss) from operations | (961,122) | 464,809 | 70,943 | ||||
Interest and investment income, net | 436,042 | 87,892 | 13,415 | ||||
Foreign exchange loss, net | (4,635) | (219) | (33) | ||||
Other income | 15,315 | 5,094 | 777 | ||||
Other expenses | (189) | (206) | (31) | ||||
Net income/(loss) before income taxes | (514,588) | 557,370 | 85,071 | ||||
Income tax (expenses)/benefit | 28,108 | (79,175) | (12,084) | ||||
Net income/(loss) | (486,480) | 478,195 | 72,987 | ||||
Less: net loss attributable to non-controlling interest | - | (167) | (25) | ||||
Net income/(loss) attributable to Qudian Inc.'s | (486,480) | 478,362 | 73,012 | ||||
Earnings per share for Class A and Class B ordinary | |||||||
Basic | (1.92) | 1.89 | 0.29 | ||||
Diluted | (1.92) | 1.81 | 0.28 | ||||
Earnings per ADS (1 Class A ordinary share equals 1 | |||||||
Basic | (1.92) | 1.89 | 0.29 | ||||
Diluted | (1.92) | 1.81 | 0.28 | ||||
Weighted average number of Class A and Class B | |||||||
Basic | 253,874,830 | 253,044,009 | 253,044,009 | ||||
Diluted | 253,874,830 | 266,647,286 | 266,647,286 | ||||
Other comprehensive gain/(loss): | |||||||
Foreign currency translation adjustment | (1,377) | 2,260 | 345 | ||||
Total comprehensive income/(loss) | (487,857) | 480,622 | 73,357 | ||||
Total comprehensive income/(loss) attributable to | (487,857) | 480,622 | 73,357 | ||||
Note: | |||||||
QUDIAN INC. | ||||||
Unaudited Condensed Consolidated Balance Sheets | ||||||
As of December 31, | As of March 31, | |||||
(In thousands except for number | 2020 | 2021 | ||||
of shares and per-share data) | (Audited) | (Unaudited) | (Unaudited) | |||
RMB | RMB | US$ | ||||
ASSETS: | ||||||
Current assets: | ||||||
Cash and cash equivalents | 1,537,558 | 2,187,502 | 333,878 | |||
Restricted cash | 135,404 | 234,112 | 35,732 | |||
Short-term investments | 5,042,314 | 5,079,154 | 775,230 | |||
Short-term loan principal and financing service fee receivables | 3,940,461 | 3,515,293 | 536,539 | |||
Short-term finance lease receivables | 179,613 | 128,830 | 19,663 | |||
Short-term contract assets | 92,813 | 50,077 | 7,643 | |||
Other current assets | 762,313 | 1,006,670 | 153,649 | |||
Total current assets | 11,690,476 | 12,201,638 | 1,862,334 | |||
Non-current assets: | ||||||
Long-term finance lease receivables | 28,771 | 11,795 | 1,800 | |||
Operating lease right-of-use assets | 210,898 | 296,253 | 45,217 | |||
Investment in equity method investee | 349,276 | 381,287 | 58,196 | |||
Long-term investments | 209,868 | 243,668 | 37,191 | |||
Property and equipment, net | 302,969 | 359,955 | 54,940 | |||
Intangible assets | 8,478 | 8,926 | 1,362 | |||
Long-term contract assets | 23,094 | 10,317 | 1,575 | |||
Deferred tax assets, net | 154,960 | 119,138 | 18,184 | |||
Other non-current assets | 419,242 | 425,464 | 64,938 | |||
Total non-current assets | 1,707,556 | 1,856,803 | 283,403 | |||
TOTAL ASSETS | 13,398,032 | 14,058,441 | 2,145,737 | |||
QUDIAN INC. | ||||||
Unaudited Condensed Consolidated Balance Sheets | ||||||
As of December 31, | As of March 31, | |||||
(In thousands except for number | 2020 | 2021 | ||||
of shares and per-share data) | (Audited) | (Unaudited) | (Unaudited) | |||
RMB | RMB | US$ | ||||
LIABILITIES AND SHAREHOLDERS' EQUITY | ||||||
Current liabilities: | ||||||
Short-term lease liabilities | 23,763 | 41,543 | 6,341 | |||
Accrued expenses and other current liabilities | 336,790 | 351,417 | 53,637 | |||
Guarantee liabilities and risk assurance liabilities(1) | 31,400 | 21,583 | 3,294 | |||
Income tax payable | 80,656 | 100,054 | 15,271 | |||
Total current liabilities | 472,609 | 514,597 | 78,543 | |||
Non-current liabilities: | ||||||
Deferred tax liabilities, net | 10,923 | 18,564 | 2,833 | |||
Convertible senior notes | 822,005 | 827,555 | 126,310 | |||
Long-term lease liabilities | 80,236 | 152,184 | 23,228 | |||
Long-term borrowings and interest payables | 102,415 | 145,312 | 22,179 | |||
Total non-current liabilities | 1,015,579 | 1,143,615 | 174,550 | |||
Total liabilities | 1,488,188 | 1,658,212 | 253,093 | |||
Shareholders' equity: | ||||||
Class A Ordinary shares | 132 | 132 | 20 | |||
Class B Ordinary shares | 44 | 44 | 7 | |||
Treasury shares | (371,551) | (368,681) | (56,272) | |||
Additional paid-in capital | 4,007,260 | 4,014,320 | 612,704 | |||
Accumulated other comprehensive loss | (51,420) | (49,160) | (7,503) | |||
Retained earnings | 8,315,379 | 8,793,741 | 1,342,187 | |||
Total Qudian Inc. shareholders' equity | 11,899,844 | 12,390,396 | 1,891,143 | |||
Non-controlling interests | 10,000 | 9,833 | 1,501 | |||
Total equity | 11,909,844 | 12,400,229 | 1,892,644 | |||
TOTAL LIABILITIES AND SHAREHOLDERS' EQUITY | 13,398,032 | 14,058,441 | 2,145,737 | |||
Note: | ||||||
QUDIAN INC. | |||||||
Unaudited Reconciliation of GAAP And Non-GAAP Results | |||||||
Three months ended March 31, | |||||||
2020 | 2021 | ||||||
(In thousands except for number | (Unaudited) | (Unaudited) | (Unaudited) | ||||
of shares and per-share data) | RMB | RMB | US$ | ||||
Total net income/(loss) attributable to Qudian Inc.'s shareholders | (486,480) | 478,362 | 73,012 | ||||
Add: Share-based compensation expenses | 13,652 | 9,930 | 1,516 | ||||
Less: Convertible bonds buyback income | 434,693 | - | - | ||||
Non-GAAP net income/(loss) attributable to Qudian Inc.'s shareholders | (907,521) | 488,292 | 74,528 | ||||
Non-GAAP net income/(loss) per share—basic | (3.57) | 1.93 | 0.29 | ||||
Non-GAAP net income/(loss) per share—diluted | (3.57) | 1.85 | 0.28 | ||||
Weighted average shares outstanding—basic | 253,874,830 | 253,044,009 | 253,044,009 | ||||
Weighted average shares outstanding—diluted | 253,874,830 | 266,647,286 | 266,647,286 | ||||
![]() View original content to download multimedia:http://www.prnewswire.com/news-releases/qudian-inc-reports-first-quarter-2021-unaudited-financial-results-301312241.html
View original content to download multimedia:http://www.prnewswire.com/news-releases/qudian-inc-reports-first-quarter-2021-unaudited-financial-results-301312241.html
SOURCE Qudian Inc.