
Salazar Resources Defines 1.9 km by 0.9 km Copper-in-Soil Anomaly at Monja Porphyry Target, Ecuador, Rock Samples up to 2.76% Cu
Surface results provide an area for selecting Monja’s first porphyry drill targets, with drilling subject to surface access and permits.
Sentiment and the balance of points
Rhea-AI Sentiment reads the wording of the document, how positive or negative its language is on a 1 to 5 scale. The balance of points shown with the takes weighs what the document actually discloses, so the two can disagree, for example when a trial that missed its main goal is described in upbeat language.
Rhea-AI Summary
Salazar Resources (SRLZF) has defined a copper-in-soil anomaly at its wholly owned Monja project in southern Ecuador, advancing drill-target selection. The anomaly measures 1.9 km by 0.9 km at a 200 parts-per-million copper threshold and remains open to the northwest and southeast. Sampling covered 482 of 752 planned points, or 64%; 92 samples met or exceeded the threshold. New soil samples reached 1,884 parts per million copper, versus a previously reported maximum of 2,242.
New selective rock samples returned up to 2.76% copper. Cumulative rock sampling defines a 0.8 km by 0.7 km copper anomaly within the soil anomaly, but selective samples may not represent the property. Salazar plans its first drill test of the porphyry target from the first quarter of 2027, with up to approximately 3,500 metres planned, subject to surface access and permits.
How this balance works
Rhea-AI gives every point it takes from this document a weight. Minor counts 1, Moderate 3 and Major 9, so one Major point outweighs several Minor ones. The bar adds up the weights on each side, and when neither side holds more than 65% of the total the balance reads Mixed.
It reads the document as published, with the same rules for every company, and it does not look at what the market expected or at how the stock traded, so a point can be objectively good on a day the stock falls.
Rhea-AI Sentiment measures something else, the tone of the wording.
Hollow bars mark forward-looking points. How the balance works
Positive
- Moderate pointCopper-in-soil anomaly spans 1.9 km by 0.9 km and remains open northwest and southeast.
- Moderate point. Forward-looking: it has not happened yet and may not happen.Salazar plans the first porphyry drill test from the first quarter of 2027, totaling up to approximately 3,500 metres.
- Minor point. Forward-looking: it has not happened yet and may not happen.Soil sampling completed 482 of 752 planned points (64%); sampling and grid extensions continue.
- Minor pointSoil copper reached 200 parts per million or more in 92 samples (19%).
- Minor pointNew soil copper reached 1,884 parts per million, versus the previously reported maximum of 2,242.
8 minor points
- Minor pointNew selective rock sample 51760 returned 2.76% copper, 0.71 g/t gold and 28.8 g/t silver.
- Minor pointNew selective rock sample 700235 returned 2.63% copper, 0.61 g/t gold and 29.2 g/t silver.
- Minor pointNew selective rock sample 700444 returned 2.41% copper, 0.68 g/t gold and 24.3 g/t silver.
- Minor pointRock copper anomaly covers 0.8 km by 0.7 km within the broader soil anomaly.
- Minor pointRock samples exceeding 1,000 parts per million copper doubled from 23 to 46 cumulatively.
- Minor pointRock gold reached 7.75 g/t; 46 samples (11%) exceeded 0.25 g/t.
- Minor pointAll nine rock samples above 1% copper also returned 0.42–1.15 g/t gold.
- Minor pointRock molybdenum exceeded 20 parts per million in 61 samples (14%), including 881 parts per million.
Negative
- Minor pointPlanned Monja drilling remains subject to surface access and permits.
- Minor pointRock samples above 300 parts per million copper fell to 37% from 64% reported June 30, 2026 as coverage expanded.
- Minor pointSelective rock samples may not represent mineralization across the property.
AI-generated analysis. How Rhea-AI works. Not financial advice.


Vancouver, British Columbia--(Newsfile Corp. - November 12, 2026) - SALAZAR RESOURCES LIMITED (TSXV: SRL) (OTCQB: SRLZF) (FSE: CCG) ("Salazar" or the "Company") is pleased to report the results of the detailed soil geochemical sampling program, covering 482 of the 752 planned sampling points (
Highlights
Kilometre-scale copper-in-soil anomaly, still open: Soil sampling has delineated a consistent copper anomaly measuring 1.9 km by 0.9 km at a 200 ppm Cu threshold, open to the northwest and southeast, where the grid is being extended. New grid samples returned up to 1,884 ppm Cu (sample 250245); the highest soil value to date, 2,242 ppm Cu, is from the initial 23-sample soil survey reported on June 30, 2026.
New rock samples up to
2.76% Cu: Newly reported selective rock samples returned up to2.76% Cu, 0.71 g/t Au, 28.8 g/t Ag and 9 ppm Mo (sample 51760);2.63% Cu, 0.61 g/t Au, 29.2 g/t Ag and 4 ppm Mo (sample 700235); and2.41% Cu, 0.68 g/t Au, 24.3 g/t Ag and 3 ppm Mo (sample 700444).Copper in rock over a 0.8 km by 0.7 km area: Of the 429 rock samples collected at Monja to date, including those previously reported, 157 returned more than 300 ppm Cu and 46 exceeded 1,000 ppm (
0.1% ) Cu, compared with 64 and 20, respectively, of the 99 samples reported on June 30, 2026. These results define a 0.8 km by 0.7 km copper anomaly in rock, located within the broader soil anomaly.Gold with copper: 46 rock samples (
11% ) returned more than 0.25 g/t Au, and all nine samples above1% Cu also returned between 0.42 and 1.15 g/t Au. Molybdenum is locally anomalous: 61 rock samples (14% ) returned more than 20 ppm Mo, including 881 ppm Mo (sample 700304).Porphyry geology and zoning: Mineralization is hosted in an intrusive complex of granodiorite, quartz-feldspar porphyry and hydrothermal breccias, with chalcopyrite and lesser bornite as the copper minerals and alteration zoning typical of porphyry copper-gold systems.
Drilling planned: Up to approximately 3,500 metres is planned from the first quarter of 2027, subject to surface access and permits, as announced on October 19, 2026. It will be the first drill test of the porphyry target.
Management Commentary
"In five months, the soil grid has taken Monja from a handful of encouraging surface samples to a coherent, kilometre-scale copper anomaly with the copper, zinc and manganese zonation we'd expect around a porphyry center. And it's still open to the northwest and southeast. This is the same systematic, ground-up work that led our team to the Curipamba-El Domo discovery, now under construction. Our focus is on closing out the grid and selecting targets for the first holes ever drilled at Monja, planned for 2027." - Fredy Salazar, President and CEO
Soil Sampling Program - Results
The Monja soil survey uses a 100 m by 100 m sampling grid, oriented in a northwest-southeast direction, centered on the copper-gold porphyry target. Samples were collected at depths ranging from approximately 0.2 m to 2.5 m, and locally deeper (up to 4.66 m among the samples in Table 2), focusing on soils in the B horizon, which are characterized by their ability to accumulate trace metals and indicator elements. In areas where the soil layer is thin, samples were taken from the B-C transition horizons and saprolite, providing values that more accurately reflect the geochemistry of the bedrock in situ.
The sampling grid is designed to include a total of 752 sampling points, and on completion of the 2026 summer work program, 482 had been collected (including the 23 samples reported on June 30, 2026), representing
Copper results range from 3 ppm to 2,242 ppm, with 92 samples (
Table 1. Distribution of Cu, Au, Mo and Ag values in reported Monja soil samples
| Cu (ppm) | Percentage | Au (g/t) | Percentage | |||
| <50 | 140 | < 0.015 | 399 | |||
| 50 - 100 | 133 | 0.015 - 0.030 | 28 | |||
| 100 - 200 | 117 | 0.030 - 0.10 | 36 | |||
| 200 - 500 | 66 | 0.10 - 0.30 | 11 | |||
| >500 | 26 | > 0.30 | 8 | |||
| TOTAL: | 482 | TOTAL: | 482 | |||
| Mo (ppm) | Percentage | Ag (ppm) | Percentage | |||
| < 6 | 468 | <0.2 | 415 | |||
| 6 -10 | 9 | 0.2 -1 | 64 | |||
| 10 - 20 | 4 | 1 - 3 | 1 | |||
| > 20 | 1 | 3 - 5 | 1 | |||
| TOTAL: | 482 | > 5 | 1 | |||
| TOTAL: | 482 | |||||
Copper exhibits a distinct and well-defined dispersion pattern, with a maximum of 2,242 ppm Cu and an anomaly threshold of 200 ppm Cu (approximately the 81st percentile of the data), a working threshold selected by Salazar, based on the experience of its geologists, to separate anomalous copper values clearly from background. Copper, zinc, and manganese exhibit well-established distributions typical of a porphyry system, with a central copper dispersion surrounded by halos of zinc and manganese. Molybdenum in soil is low, with
Table 2. Soil samples with 200 ppm Cu or more
| Sample | Depth (m) | Au (g/t) | Cu (ppm) | Ag (ppm) | Mo (ppm) | Sample | Depth (m) | Au (g/t) | Cu (ppm) | Ag (ppm) | Mo (ppm) | |
| 53502* | 0.60 | 0.035 | 2242 | 0.5 | 4 | 250215 | 2.30 | 0.012 | 328 | 0.1 | 1 | |
| 250245 | 1.30 | 0.259 | 1884 | 74 | 9 | 250168 | 1.00 | 0.012 | 317 | 0.1 | 1 | |
| 53524* | 0.85 | 0.018 | 1720 | 0.4 | 16 | 250381 | 4.66 | 0.012 | 312 | 0.1 | 1 | |
| 53505* | 0.80 | 0.016 | 1599 | 0.5 | 5 | 250461 | 0.50 | 0.066 | 312 | 0.1 | 1 | |
| 250113 | 0.50 | 0.061 | 1480 | 0.6 | 1 | 250565 | 1.50 | 0.012 | 303 | 0.3 | 1 | |
| 250232 | 1.00 | 0.030 | 1369 | 0.3 | 1 | 250238 | 1.50 | 0.012 | 295 | 0.1 | 1 | |
| 250283 | 0.40 | 0.012 | 1096 | 0.3 | 2 | 250528 | 1.00 | 0.012 | 291 | 0.2 | 1 | |
| 250201 | 1.00 | 0.090 | 1074 | 0.1 | 1 | 250127 | 1.70 | 0.012 | 288 | 0.1 | 1 | |
| 250344 | 1.05 | 0.012 | 1050 | 0.1 | 1 | 250337 | 1.50 | 0.012 | 286 | 0.1 | 1 | |
| 53525* | 1.20 | 0.028 | 996 | 0.3 | 3 | 250135 | 1.60 | 0.012 | 275 | 0.1 | 1 | |
| 250221 | 2.80 | 0.012 | 961 | 0.4 | 4 | 250312 | 2.00 | 0.157 | 275 | 0.1 | 1 | |
| 250165 | 1.38 | 0.044 | 892 | 0.1 | 6 | 250543 | 1.90 | 0.012 | 275 | 0.1 | 1 | |
| 250164 | 1.55 | 0.012 | 781 | 0.1 | 2 | 250117 | 1.10 | 0.024 | 274 | 0.1 | 1 | |
| 250185 | 0.80 | 0.025 | 755 | 0.1 | 1 | 250418 | 1.90 | 0.012 | 267 | 0.1 | 1 | |
| 250273 | 2.10 | 0.012 | 749 | 0.1 | 1 | 250241 | 2.00 | 0.012 | 265 | 0.1 | 1 | |
| 250172 | 2.00 | 0.012 | 683 | 0.1 | 1 | 250096 | 2.50 | 0.031 | 264 | 0.2 | 1 | |
| 250504 | 1.50 | 0.012 | 682 | 0.2 | 1 | 53514* | 1.10 | 0.018 | 255 | 0.2 | 7 | |
| 250102 | 1.15 | 7.495 | 659 | 3.4 | 1 | 250531 | 1.80 | 0.012 | 255 | 0.1 | 1 | |
| 250231 | 1.20 | 0.012 | 582 | 0.1 | 1 | 250309 | 1.05 | 0.012 | 253 | 0.1 | 1 | |
| 53506* | 0.90 | 0.102 | 573 | 1.8 | 133 | 250254 | 1.00 | 0.089 | 251 | 0.1 | 1 | |
| 53504* | 1.00 | 0.005 | 572 | 0.1 | 2 | 250325 | 0.60 | 0.012 | 247 | 0.1 | 1 | |
| 250419 | 1.80 | 0.012 | 570 | 0.1 | 1 | 250469 | 0.70 | 0.012 | 247 | 0.1 | 1 | |
| 250192 | 0.80 | 0.012 | 564 | 0.4 | 6 | 53519* | 1.80 | 0.020 | 246 | 0.3 | 2 | |
| 250187 | 1.80 | 0.012 | 556 | 0.1 | 1 | 250372 | 1.90 | 0.012 | 246 | 0.1 | 1 | |
| 53503* | 1.50 | 0.033 | 543 | 0.6 | 12 | 53501* | 1.20 | 0.026 | 244 | 0.4 | 9 | |
| 250184 | 0.80 | 0.012 | 509 | 0.1 | 1 | 250133 | 1.80 | 0.012 | 243 | 0.1 | 1 | |
| 250163 | 1.20 | 0.012 | 494 | 0.1 | 1 | 250190 | 1.50 | 0.012 | 239 | 0.1 | 1 | |
| 250343 | 1.20 | 0.012 | 493 | 0.1 | 1 | 250412 | 1.70 | 0.012 | 238 | 0.1 | 1 | |
| 250193 | 0.60 | 0.012 | 463 | 0.5 | 15 | 250166 | 0.80 | 0.012 | 236 | 0.1 | 1 | |
| 250347 | 1.80 | 0.012 | 462 | 0.1 | 1 | 250167 | 1.15 | 0.048 | 236 | 0.1 | 1 | |
| 250134 | 2.00 | 0.012 | 459 | 0.1 | 1 | 250545 | 2.00 | 0.012 | 236 | 0.1 | 1 | |
| 250191 | 1.00 | 0.012 | 424 | 0.1 | 3 | 250556 | 1.50 | 0.012 | 235 | 0.1 | 1 | |
| 250346 | 1.80 | 0.025 | 416 | 0.1 | 1 | 250496 | 1.80 | 0.652 | 233 | 0.2 | 1 | |
| 250538 | 1.20 | 0.150 | 412 | 0.1 | 1 | 250562 | 0.80 | 0.239 | 232 | 0.3 | 1 | |
| 250169 | 1.38 | 0.012 | 408 | 0.1 | 1 | 250252 | 1.30 | 0.025 | 228 | 0.1 | 1 | |
| 53518* | 2.50 | 0.033 | 403 | 0.3 | 2 | 250257 | 0.40 | 0.012 | 219 | 0.1 | 1 | |
| 53512* | 0.50 | 0.054 | 398 | 0.5 | 16 | 53511* | 1.00 | 0.007 | 218 | 0.3 | 2 | |
| 250107 | 1.77 | 0.030 | 374 | 0.3 | 2 | 53509* | 1.95 | 0.020 | 217 | 0.3 | 6 | |
| 250125 | 1.52 | 0.036 | 374 | 0.1 | 1 | 250333 | 3.50 | 0.012 | 217 | 0.4 | 1 | |
| 250413 | 2.00 | 0.012 | 369 | 0.1 | 1 | 250421 | 1.70 | 0.012 | 216 | 0.1 | 1 | |
| 250287 | 0.80 | 0.012 | 352 | 0.1 | 2 | 250274 | 1.50 | 0.012 | 214 | 0.1 | 1 | |
| 250088 | 1.10 | 0.012 | 348 | 0.1 | 1 | 250104 | 1.25 | 0.012 | 213 | 0.1 | 1 | |
| 250396 | 1.90 | 0.057 | 347 | 0.1 | 1 | 250158 | 0.70 | 0.054 | 203 | 0.3 | 1 | |
| 250216 | 1.70 | 0.012 | 346 | 0.1 | 1 | 250330 | 2.00 | 0.012 | 200 | 0.1 | 1 | |
| 250111 | 1.70 | 0.012 | 341 | 0.1 | 1 | |||||||
| 250170 | 1.20 | 0.012 | 336 | 0.1 | 1 | |||||||
| 250112 | 0.75 | 0.012 | 335 | 0.1 | 3 | |||||||
| 250285 | 1.40 | 0.012 | 335 | 0.1 | 3 | |||||||
* Sample reported in the Company's news release dated June 30, 2026
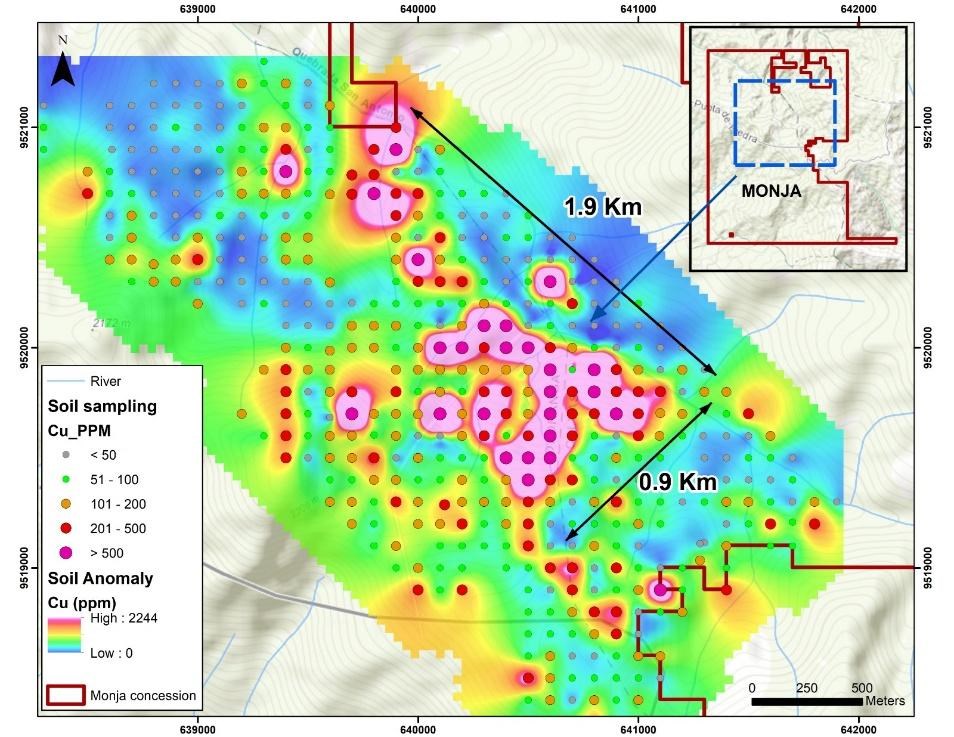
Figure 1. Copper-in-soil geochemistry at the Monja Project, showing the extent of the defined anomaly
To view an enhanced version of this graphic, please visit:
https://images.newsfilecorp.com/files/4631/323671_93d2fbc3d45b9a4b_002full.jpg
Rock Sampling Results
On completion of the 2026 summer work program, Salazar had collected a total of 429 rock samples at the Monja Project, mainly rock chip and channel samples, including the samples reported on April 8 and June 30, 2026. Of these, 321 samples are reported for the first time in this news release. The results show that 157 samples (
Table 3. Distribution of Cu, Au, Mo and Ag values in reported Monja rock samples
| Cu (ppm) | Percentage | Au (g/t) | Percentage | |||
| <100 | 165 | < 0.010 | 92 | |||
| 100 - 300 | 107 | 0.010 - 0.05 | 238 | |||
| 300 - 500 | 51 | 0.05 - 0.10 | 29 | |||
| 500 - 1000 | 60 | 0.10 - 0.25 | 24 | |||
| >1000 | 46 | > 0.25 | 46 | |||
| TOTAL | 429 | TOTAL | 429 | |||
| Mo (ppm) | Percentage | Ag (ppm) | Percentage | |||
| < 6 | 316 | <5 | 400 | |||
| 6 -10 | 27 | 5 -10 | 12 | |||
| 10 - 20 | 25 | 10 - 20 | 10 | |||
| > 20 | 61 | > 20 | 7 | |||
| TOTAL | 429 | TOTAL | 429 | |||
The mineralization is hosted within an intrusive complex of granodiorite, quartz-feldspar porphyry and hydrothermal breccias emplaced into the barren Early Cretaceous Tangula batholith. Mineralization consists of pyrite, chalcopyrite, bornite and magnetite, associated with silica mainly in B- and D-type veins that form intense stockworks and sheeted vein zones. The hydrothermal breccia is strongly silicified and hosts chalcopyrite in the matrix, accompanied by tourmaline and, to a lesser extent, bornite.
Exploration has identified alteration patterns typical of porphyry copper-gold environments. The system displays well-defined zoning, where outer propylitic (chlorite-rich) assemblages grade into phyllic (quartz-sericite) and argillic zones, supported by localized intervals of K-feldspar, magnetite, and green sericite. These mineral signatures are consistent with a zoned porphyry system that may represent the upper levels of a preserved system or a structurally telescoped one. Ongoing work and assay interpretations will help vector toward the core of the system.
Table 4. Rock samples with 500 ppm Cu or more
| Sample | Width (m) | Au (g/t) | Cu (ppm) | Ag (ppm) | Mo (ppm) | Sample | Width (m) | Au (g/t) | Cu (ppm) | Ag (ppm) | Mo (ppm) | |
| 51584* | 0.8 | 1.118 | 47710 | 19.5 | 74 | 51769 | 3.0 | 0.113 | 898 | 2.0 | 40 | |
| 51760 | 0.6 | 0.705 | 27620 | 28.8 | 9 | 200061** | 3.0 | 0.036 | 896 | 0.8 | 14 | |
| 700235 | 0.6 | 0.610 | 26250 | 29.2 | 4 | 51918** | 3.0 | 0.003 | 859 | 0.1 | 3 | |
| 700444 | 0.6 | 0.675 | 24080 | 24.3 | 3 | 51754** | 1.0 | 0.040 | 846 | 0.9 | 22 | |
| 200101** | 3.5 | 0.989 | 17070 | 10.3 | 162 | 50985 | 0.5 | 3.422 | 834 | 3.2 | 1 | |
| 700436 | 0.35 | 0.424 | 15630 | 23.4 | 5 | 700467 | 2.0 | 0.058 | 824 | 1.0 | 1 | |
| 51744** | 3.0 | 0.608 | 12910 | 10.4 | 9 | 51593* | 1.0 | 0.025 | 803 | 0.8 | 144 | |
| 700378 | 0.2 | 1.148 | 12600 | 5.7 | 1 | 200134** | 3.0 | 0.008 | 790 | 0.4 | 277 | |
| 200079** | 4.0 | 0.613 | 10940 | 2.7 | 10 | 700164** | 3.0 | 0.051 | 781 | 0.1 | 7 | |
| 700395 | 1.5 | 0.012 | 9196 | 8.9 | 1 | 200072** | 4.0 | 0.043 | 767 | 0.2 | 4 | |
| 51748** | 5.0 | 0.644 | 6250 | 1.5 | 4 | 51768 | 1.5 | 0.173 | 766 | 1.5 | 9 | |
| 50911 | 0.8 | 0.086 | 5855 | 3.2 | 3 | 51743* | 3.0 | 0.022 | 747 | 0.4 | 19 | |
| 700154** | 3.0 | 0.252 | 5363 | 1.2 | 4 | 50955 | 4.0 | 4.460 | 738 | 1.6 | 1 | |
| 700402 | 1.5 | 0.114 | 5182 | 11.2 | 1 | 200039 | 3.0 | 0.160 | 733 | 0.4 | 1 | |
| 51879 | 4.0 | 0.035 | 3452 | 4.8 | 1 | 700410 | 0.4 | 0.085 | 730 | 0.6 | 1 | |
| 700461 | 0.6 | 0.307 | 3374 | 13.6 | 7 | 200099** | 3.0 | 0.057 | 727 | 0.6 | 3 | |
| 200272 | 3.5 | 0.048 | 3320 | 6.4 | 1 | 700306 | 2.0 | 0.012 | 724 | 0.1 | 448 | |
| 700394 | 2.0 | 0.149 | 3268 | 101.6 | 1 | 700426 | 0.5 | 4.200 | 714 | 0.6 | 1 | |
| 700319 | 0.4 | 7.748 | 2997 | 63.1 | 6 | 200074** | 5.0 | 0.065 | 698 | 0.4 | 72 | |
| 700437 | 0.4 | 0.202 | 2841 | 8.3 | 1 | 51738 | 0.6 | 0.043 | 691 | 0.7 | 1 | |
| 51583* | 1.0 | 0.209 | 2584 | 5.7 | 109 | 51591 | 3.0 | 0.014 | 672 | 0.6 | 4 | |
| 200073** | 4.0 | 0.081 | 2354 | 0.9 | 28 | 51806 | 1.0 | 0.013 | 670 | 0.9 | 4 | |
| 700222** | 4.0 | 0.061 | 2227 | 1.3 | 44 | 700288 | 3.0 | 0.012 | 665 | 0.1 | 6 | |
| 700167** | 3.0 | 0.043 | 2094 | 0.9 | 112 | 200083** | 3.0 | 0.014 | 664 | 0.4 | 3 | |
| 700364 | 1.5 | 0.086 | 2023 | 4.1 | 20 | 51747** | 6.0 | 0.020 | 658 | 0.5 | 6 | |
| 700162** | 3.0 | 0.061 | 1959 | 0.4 | 130 | 700472 | 3.0 | 0.031 | 638 | 0.8 | 1 | |
| 700229** | 2.5 | 0.012 | 1888 | 0.6 | 47 | 700303 | 2.0 | 0.012 | 625 | 0.1 | 81 | |
| 700406 | 1.5 | 0.111 | 1888 | 1.0 | 1 | 200057** | 4.0 | 0.011 | 621 | 0.4 | 11 | |
| 700156** | 3.0 | 0.064 | 1751 | 0.4 | 34 | 200069** | 3.0 | 0.010 | 617 | 0.2 | 4 | |
| 54238** | 4.0 | 0.040 | 1741 | 1.4 | 109 | 700305 | 2.0 | 0.012 | 617 | 0.1 | 111 | |
| 700155** | 3.0 | 0.143 | 1719 | 0.5 | 4 | 50141 | 0.1 | 0.337 | 607 | 6.5 | 1 | |
| 51878 | 5.0 | 0.672 | 1595 | 40.8 | 1 | 200086** | 4.0 | 0.037 | 605 | 0.1 | 3 | |
| 50113 | 0.3 | 2.006 | 1574 | 12.5 | 1 | 200130 | 2.5 | 0.054 | 590 | 1.0 | 1 | |
| 700243 | 3.0 | 0.033 | 1565 | 1.4 | 215 | 51578 | 1.5 | 0.040 | 588 | 0.1 | 6 | |
| 200237** | 2.5 | 0.024 | 1529 | 0.9 | 11 | 52049 | 4.0 | 0.024 | 583 | 1.1 | 1 | |
| 700246** | 3.0 | 0.053 | 1441 | 0.4 | 3 | 200089** | 2.5 | 0.016 | 581 | 0.2 | 1 | |
| 200332 | 1.0 | 0.751 | 1403 | 1.9 | 1 | 200062** | 4.5 | 0.013 | 571 | 0.4 | 4 | |
| 700166** | 3.5 | 0.040 | 1317 | 0.5 | 18 | 700307 | 2.0 | 0.012 | 565 | 0.1 | 7 | |
| 51587* | 1.0 | 0.138 | 1308 | 3.8 | 137 | 200067** | 2.5 | 0.005 | 563 | 0.1 | 3 | |
| 700228** | 4.0 | 0.012 | 1245 | 0.4 | 47 | 200070** | 4.0 | 0.007 | 553 | 0.3 | 1 | |
| 700157** | 3.0 | 0.050 | 1233 | 0.2 | 13 | 700390 | 1.0 | 0.506 | 543 | 0.6 | 1 | |
| 700304 | 2.0 | 0.029 | 1229 | 0.1 | 881 | 52054 | 3.0 | 0.084 | 543 | 5.7 | 85 | |
| 200113** | 3.0 | 0.054 | 1222 | 1.2 | 3 | 700345 | 1.0 | 0.240 | 535 | 0.9 | 1 | |
| 200098** | 3.0 | 0.028 | 1058 | 0.6 | 31 | 54247** | 5.0 | 0.031 | 531 | 0.2 | 31 | |
| 700336 | 2.0 | 0.025 | 1053 | 0.5 | 72 | 700452 | 1.5 | 0.031 | 524 | 0.4 | 1 | |
| 51786 | 5.0 | 0.012 | 1025 | 3.4 | 2 | 51592* | 2.0 | 0.023 | 517 | 0.3 | 4 | |
| 51781 | 0.1 | 0.113 | 999 | 1.3 | 1 | 51749** | 20 | 0.016 | 516 | 0.1 | 3 | |
| 200133** | 4.0 | 0.013 | 983 | 0.3 | 177 | 200065** | 4.0 | 0.009 | 513 | 0.1 | 3 | |
| 700153** | 4.0 | 0.047 | 959 | 0.3 | 3 | 200088** | 3.0 | 0.045 | 513 | 0.1 | 1 | |
| 51745** | 10.0 | 0.010 | 958 | 1.1 | 20 | 50984 | 5.0 | 0.385 | 513 | 0.5 | 1 | |
| 700335 | 2.0 | 0.012 | 957 | 0.2 | 6 | 700438 | 0.8 | 0.316 | 500 | 3.9 | 1 | |
| 51529 | 0.2 | 3.844 | 928 | 17.6 | 1 | |||||||
| 200236 | 3.0 | 0.003 | 928 | 1.0 | 1 | |||||||
| 700310 | 2.0 | 0.012 | 919 | 0.1 | 18 | |||||||
| 700161** | 3.5 | 0.026 | 916 | 0.2 | 137 |
* Sample reported in the Company's news release dated April 8, 2026
** Sample included in the 99 rock samples summarized in the Company's news release dated June 30, 2026; individual results were published at that time only for samples above 1,000 ppm Cu
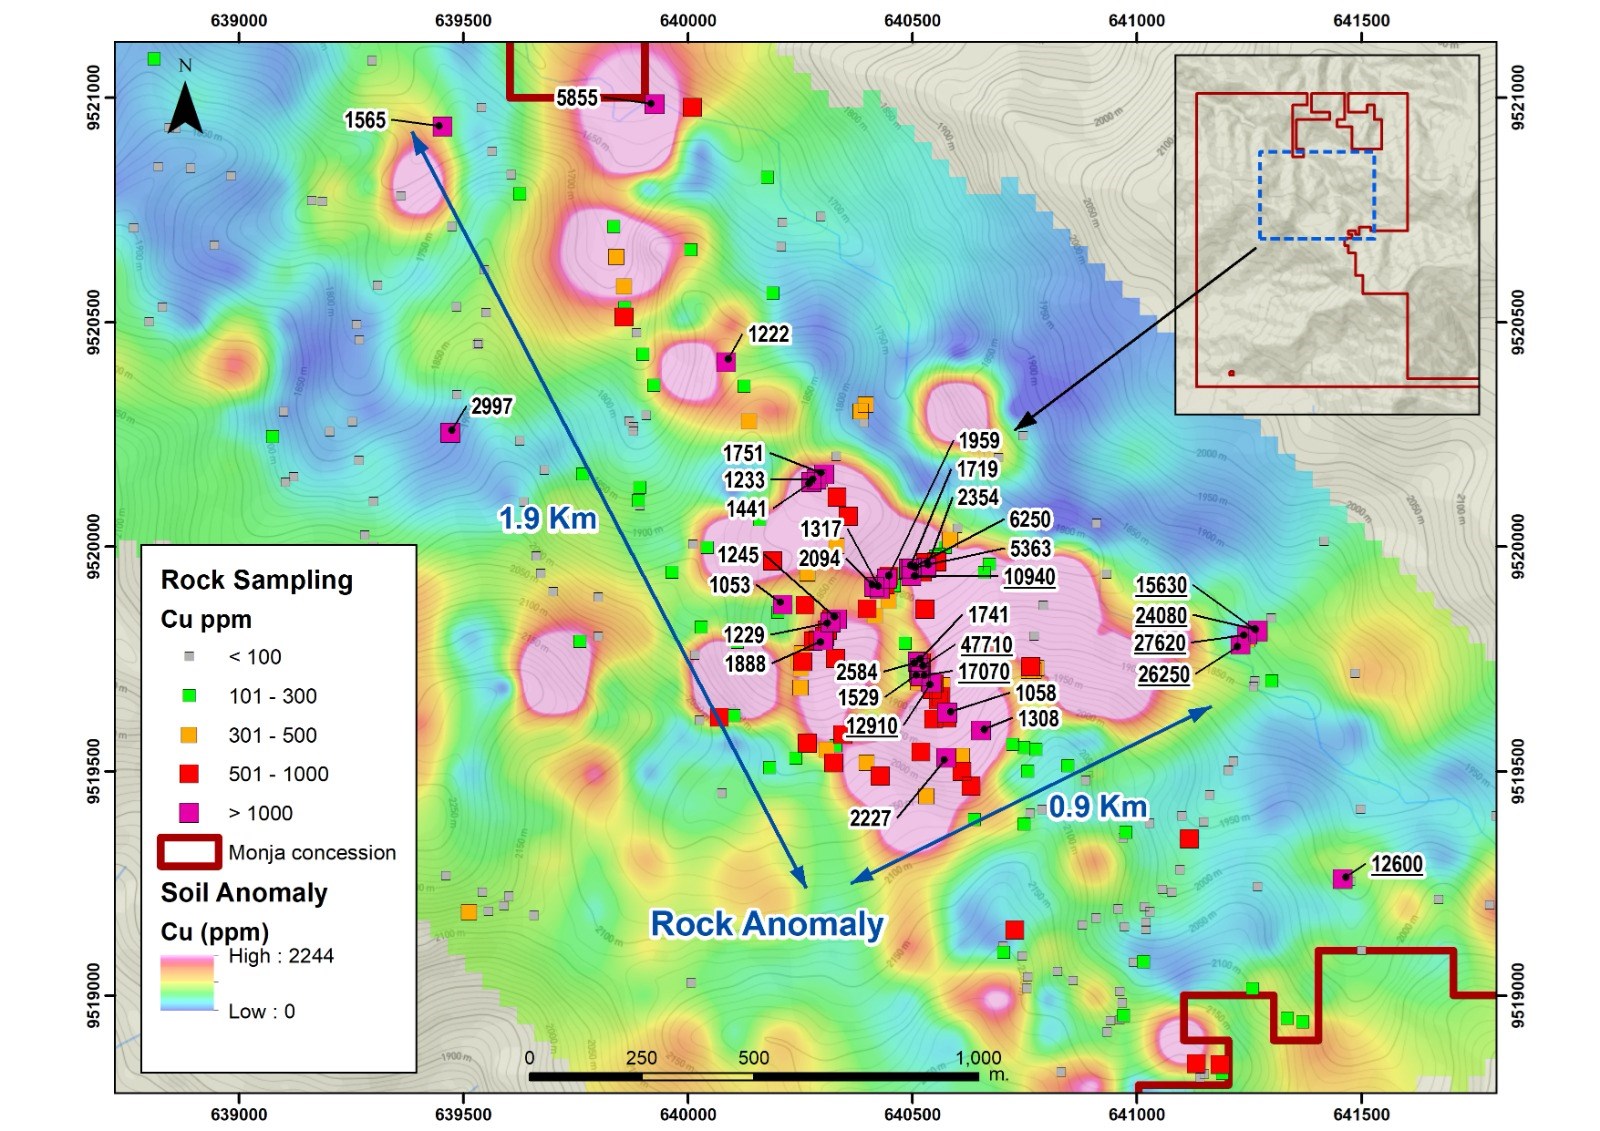
Figure 2. Copper in rock samples over the copper-in-soil anomaly
To view an enhanced version of this graphic, please visit:
https://images.newsfilecorp.com/files/4631/323671_93d2fbc3d45b9a4b_003full.jpg
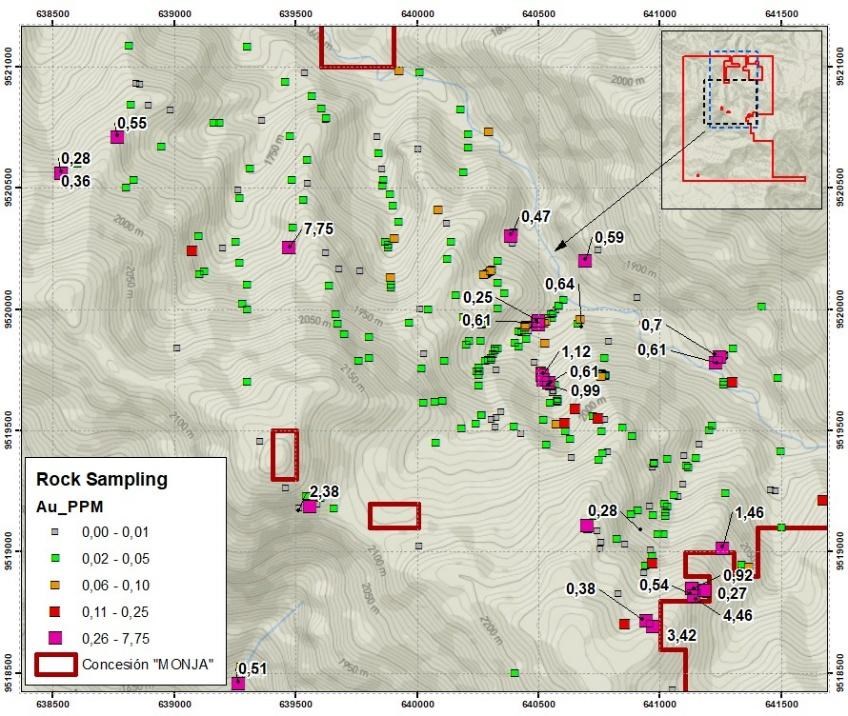
Figure 3. Gold in rock samples
To view an enhanced version of this graphic, please visit:
https://images.newsfilecorp.com/files/4631/323671_93d2fbc3d45b9a4b_004full.jpg
Next Steps
- Complete the remaining 270 sampling points of the designed soil grid, extending the grid to the northwest and southeast to follow the copper anomaly where it remains open.
- Continue detailed mapping in the main ravines, distinguishing the mineralization, vein types, and alteration of the main body.
- Plan ground geophysical surveys to refine drill targets, to be integrated with the geochemical and structural datasets.
- Work with the community relations team in the local communities, keeping them informed about exploration activities and agreeing surface access.
- Obtain the permits required for drilling, which are in process.
- Drill up to approximately 3,500 metres in four holes from the first quarter of 2027, designed to test the main copper-gold anomaly, subject to surface access and permits.
Monja Project
The Monja Project is a 9,088-hectare,
QA/QC Program
Soil samples were collected by Company technical staff from B-horizon material at depths of approximately 0.2 m to 2.5 m, and locally deeper, on a 100 m by 100 m grid. Samples were securely sealed and prepared at Bureau Veritas in Quito, Ecuador, and analysed at Bureau Veritas in Callao, Peru (Inspectorate Services Perú S.A.C.), independent accredited laboratories. Samples were dried, pulverized to
Rock samples reported for the first time in this news release were mainly rock chip and channel samples and were submitted to Bureau Veritas Ecuador, an independent accredited laboratory, prepared in Quito, Ecuador, and analysed in Lima, Peru, using a 44-element aqua regia digestion with an ICP-OES finish; Ag, Cu, Pb, Zn, As, Ni and Co were determined by aqua regia digestion with an AAS finish. Gold analysis was completed by lead collection fire assay fusion with an AAS finish, with values above 10 g/t Au completed by fire assay fusion with a gravimetric finish. Copper values were determined by aqua regia digestion with an AAS finish, as for the samples reported on June 30, 2026, and the QA/QC program for rock samples includes chain-of-custody and the insertion of standards, blanks and duplicates. Rock samples reported previously were analysed as described in the Company's news releases dated April 8 and June 30, 2026, which also describe the sample types and QA/QC procedures.
Qualified Person
The scientific and technical information in this news release has been reviewed and approved by Kieran Downes, Ph.D., P.Geo., a Qualified Person as defined by National Instrument 43-101, who is independent of the Company.
About Salazar Resources Limited
Salazar Resources Limited (TSXV: SRL) (OTCQB: SRLZF) (FSE: CCG) is a Canadian junior exploration company focused on the discovery and development of mineral deposits in Ecuador. The Company's strategy combines in-house geological expertise with a disciplined, systematic approach to project generation and advancement. Alongside a
Investor Relations: Patrick Piette, Minera IR Inc., patrick@salazarresources.com, 416-526-9911.
Neither the TSX Venture Exchange nor its Regulation Services Provider (as that term is defined in the policies of the TSX Venture Exchange) accepts responsibility for the adequacy or accuracy of this news release.
Forward-Looking Statements
This news release contains "forward-looking information" within the meaning of applicable Canadian securities laws, including statements regarding the interpretation of geochemical data at the Monja Project; the presence, scale and continuity of a copper-gold porphyry system; the extent of the copper-in-soil anomaly and its potential to expand to the northwest and southeast; the completion of the remaining soil grid; the timing and results of pending assays; the planning and execution of ground geophysical surveys; the definition of drill targets; the planned drilling at Monja and its timing; and the outcome of community engagement and land-access discussions. Forward-looking information is based on the reasonable assumptions, estimates, analyses and opinions of management as of the date such statements are made, and is subject to known and unknown risks, uncertainties and other factors that may cause actual results to differ materially from those expressed or implied. Such risks include, without limitation, the preliminary and interpretive nature of the geochemical work presented herein, the fact that soil geochemical anomalies are exploration indicators only and are not necessarily indicative of the presence, grade or continuity of mineralization at depth, the risk that follow-up exploration may not confirm the extent or continuity of the anomalies described, and the risk that access agreements required to complete the program may not be obtained, or that permits required for drilling may be delayed or not obtained. Readers are cautioned not to place undue reliance on forward-looking information. Salazar does not undertake any obligation to update forward-looking information except as required by applicable securities laws.

To view the source version of this press release, please visit https://www.newsfilecorp.com/release/323671
FAQ
AI-generated questions and answers. How Rhea-AI works. Not financial advice.
How large is Salazar Resources’ Monja copper-in-soil anomaly?
The Monja copper-in-soil anomaly measures 1.9 km by 0.9 km at a threshold of 200 parts per million copper. It remains open to the northwest and southeast, where the sampling grid is being extended.
When does Salazar Resources plan to drill the Monja porphyry target?
Salazar plans drilling from the first quarter of 2027, subject to surface access and permits. Up to approximately 3,500 metres is planned for the first drill test of the porphyry target.
How did Salazar Resources choose the Monja soil anomaly threshold?
Salazar selected 200 parts per million copper as a working threshold based on its geologists’ experience separating anomalous values from background. That level is approximately the 81st percentile of the soil data. The survey uses a 100 m by 100 m sampling grid.
Where were the highest gold-in-soil values found at Salazar Resources’ Monja project?
The highest gold-in-soil values came from the southeastern part of the grid, near artisanal mining approximately 1 km from the porphyry target’s center. Soil gold values ranged from 0.005 to 9.653 g/t, with 11% above 0.03 g/t.