
Toyota Motor North America Reports September, Third Quarter 2026 U.S. Sales Results
Electrified vehicles accounted for 55.3 percent of year-to-date U.S. sales, compared with 47.8 percent a year earlier.
Sentiment and the balance of points
Rhea-AI Sentiment reads the wording of the document, how positive or negative its language is on a 1 to 5 scale. The balance of points shown with the takes weighs what the document actually discloses, so the two can disagree, for example when a trial that missed its main goal is described in upbeat language.
Rhea-AI Summary
Toyota (TM) reported September 2026 U.S. vehicle sales of 201,306, an 8.4 percent increase by volume from September 2025. Growth was 4.0 percent on a daily selling rate basis, which adjusts for selling days. Electrified vehicle sales rose 37.8 percent to 117,215, representing 58.2 percent of monthly sales.
Third-quarter sales reached 633,223 vehicles, up 0.6 percent from the third quarter of 2025. Electrified sales increased 28.5 percent to 363,367, or 57.4 percent of quarterly volume. Toyota division quarterly sales rose 0.5 percent to 540,167; Lexus increased 1.6 percent to 93,056. Toyota division achieved its highest electrification mix at 61 percent.
Year-to-date U.S. sales rose 0.6 percent to 1,876,614, while electrified sales increased 16.3 percent to 1,038,114. Lexus year-to-date sales fell 2.9 percent, and RAV4 sales declined 29.2 percent.
How this balance works
Rhea-AI gives every point it takes from this document a weight. Minor counts 1, Moderate 3 and Major 9, so one Major point outweighs several Minor ones. The bar adds up the weights on each side, and when neither side holds more than 65% of the total the balance reads Mixed.
It reads the document as published, with the same rules for every company, and it does not look at what the market expected or at how the stock traded, so a point can be objectively good on a day the stock falls.
Rhea-AI Sentiment measures something else, the tone of the wording.
Positive
- Moderate pointSeptember U.S. sales rose 8.4 percent by volume and 4.0 percent by daily selling rate to 201,306.
- Moderate pointThird-quarter U.S. sales increased 0.6 percent year over year to 633,223 vehicles.
- Moderate pointSeptember electrified sales rose 37.8 percent by volume to 117,215, reaching 58.2 percent of sales.
- Moderate pointThird-quarter electrified sales increased 28.5 percent year over year to 363,367, representing 57.4 percent of sales.
- Moderate pointYear-to-date U.S. sales increased 0.6 percent to 1,876,614 vehicles versus 2025.
- Moderate pointYear-to-date electrified sales rose 16.3 percent to 1,038,114 vehicles versus 2025.
28 minor points
- Minor pointToyota division electrification mix reached an all-time high of 61 percent.
- Minor pointToyota division September sales rose 7.9 percent by volume to 171,469; quarterly sales increased 0.5 percent to 540,167.
- Minor pointLexus September sales rose 11.4 percent by volume to 29,837; quarterly sales increased 1.6 percent to 93,056.
- Minor pointToyota division electrified sales rose 36.6 percent in September and 29.2 percent in the third quarter by volume.
- Minor pointLexus electrified sales rose 47.4 percent in September and 23.1 percent in the third quarter by volume.
- Minor pointToyota division year-to-date sales increased 1.2 percent to 1,613,846 vehicles versus 2025.
- Minor pointCamry sales rose 3.4 percent by volume in September; year-to-date sales increased 11.2 percent to 260,684.
- Minor pointCorolla sales rose 4.9 percent by volume in September; year-to-date sales increased 8.4 percent to 195,141.
- Minor pointCorolla Cross sales rose 53.1 percent by volume in September; year-to-date sales increased 22.9 percent to 90,131.
- Minor pointGrand Highlander sales rose 10.5 percent by volume in September; year-to-date sales increased 8.7 percent to 108,511.
- Minor point4Runner sales rose 1.7 percent by volume in September; year-to-date sales increased 61.2 percent to 107,987.
- Minor pointSienna sales rose 25.3 percent by volume in September; year-to-date sales increased 11.7 percent to 84,770.
- Minor pointTacoma sales rose 5.3 percent by volume in September; year-to-date sales increased 5.1 percent to 214,875.
- Minor pointSequoia sales rose 19.4 percent by volume in September; year-to-date sales increased 15.8 percent to 21,403.
- Minor pointCrown Signia sales rose 94.5 percent by volume in September; year-to-date sales increased 10.5 percent to 17,983.
- Minor pointLexus RX sales rose 7.9 percent by volume in September; year-to-date sales increased 11.7 percent to 89,824.
- Minor pointLexus TX sales rose 1.1 percent by volume in September; year-to-date sales increased 7.9 percent to 42,674.
- Minor pointLexus IS sales rose 55.8 percent by volume in September; year-to-date sales increased 51.7 percent to 22,257.
- Minor pointBZ sales rose 3,803.3 percent by volume in September; year-to-date sales increased 103.4 percent to 24,944.
- Minor pointLexus RZ sales rose 572.1 percent by volume in September; year-to-date sales increased 91.3 percent to 10,214.
- Minor pointRAV4 hybrid sales rose 123.2 percent by volume in September; year-to-date sales increased 43.6 percent to 200,209.
- Minor pointRAV4 plug-in hybrid sales rose 184.0 percent by volume in September; year-to-date sales increased 92.1 percent to 32,228.
- Minor pointGrand Highlander hybrid sales rose 46.3 percent by volume in September; year-to-date sales increased 34.3 percent to 65,201.
- Minor point4Runner hybrid sales rose 7.6 percent by volume in September; year-to-date sales increased 92.3 percent to 26,152.
- Minor pointLexus NX plug-in hybrid sales rose 128.4 percent by volume in September; year-to-date sales increased 41.4 percent.
- Minor pointLexus RX hybrid sales rose 39.0 percent by volume in September; year-to-date sales increased 26.7 percent.
- Minor pointLexus RX plug-in hybrid sales rose 26.2 percent by volume in September; year-to-date sales increased 21.2 percent.
- Minor pointLexus TX hybrid sales rose 17.9 percent by volume in September; year-to-date sales increased 20.2 percent.
Negative
- Moderate pointLexus year-to-date sales fell 2.9 percent to 262,768 vehicles versus 2025.
- Minor pointRAV4 sales fell 6.6 percent by volume in September; year-to-date sales declined 29.2 percent to 253,664.
- Minor pointLexus ES sales fell 4.1 percent by volume in September; year-to-date sales declined 65.3 percent to 10,333.
- Minor pointPrius sales fell 16.9 percent by volume in September; year-to-date sales declined 37.5 percent to 29,223.
- Minor pointLexus NX sales rose 20.7 percent by volume in September, but year-to-date sales fell 12.4 percent.
21 minor points
- Minor pointLexus GX sales rose 3.8 percent by volume in September, but year-to-date sales fell 17.8 percent.
- Minor pointLand Cruiser sales rose 45.2 percent by volume in September, but year-to-date sales fell 24.0 percent.
- Minor pointTundra sales rose 13.3 percent by volume in September, but year-to-date sales fell 0.8 percent.
- Minor pointCrown sales fell 64.4 percent by volume in September; year-to-date sales declined 23.1 percent to 6,683.
- Minor pointGR86 sales fell 29.4 percent by volume in September; year-to-date sales declined 30.4 percent to 5,642.
- Minor pointHighlander sales fell 8.6 percent by volume in September, despite a 0.6 percent year-to-date increase.
- Minor pointSupra sales fell 90.5 percent by volume in September, despite a 21.3 percent year-to-date increase.
- Minor pointMirai sales fell 46.7 percent by volume in September, despite a 35.0 percent year-to-date increase.
- Minor pointLexus RC sales fell 99.0 percent by volume in September; year-to-date sales declined 77.9 percent.
- Minor pointLexus LS sales fell 95.5 percent by volume in September; year-to-date sales declined 83.2 percent.
- Minor pointVenza sales fell 75.0 percent by volume in September; year-to-date sales declined 98.4 percent.
- Minor pointPrius hybrid sales fell 10.1 percent by volume in September; year-to-date sales declined 51.1 percent.
- Minor pointPrius plug-in hybrid sales fell 25.3 percent by volume in September; year-to-date sales declined 0.4 percent.
- Minor pointCorolla Cross hybrid sales fell 17.8 percent by volume in September; year-to-date sales declined 43.5 percent.
- Minor pointTundra hybrid sales fell 19.9 percent by volume in September; year-to-date sales declined 6.8 percent.
- Minor pointTacoma hybrid sales fell 27.5 percent by volume in September, despite a 1.0 percent year-to-date increase.
- Minor pointHighlander hybrid sales fell 38.6 percent by volume in September, despite a 34.8 percent year-to-date increase.
- Minor pointLexus ES hybrid sales rose 69.1 percent by volume in September, but year-to-date sales fell 62.5 percent.
- Minor pointCorolla hybrid sales rose 19.0 percent by volume in September, but year-to-date sales fell 1.1 percent.
- Minor pointLexus NX hybrid sales rose 12.9 percent by volume in September, but year-to-date sales fell 1.3 percent.
- Minor pointLexus TX plug-in hybrid sales fell 91.6 percent by volume in September, despite a 38.3 percent year-to-date increase.
AI-generated analysis. How Rhea-AI works. Not financial advice.




- TMNA September electrified vehicle sales of 117,215, up 37.8 percent
- Toyota division achieved an all-time best-ever electrification mix of
61% - 32 electrified vehicle options available between both Toyota and Lexus brands
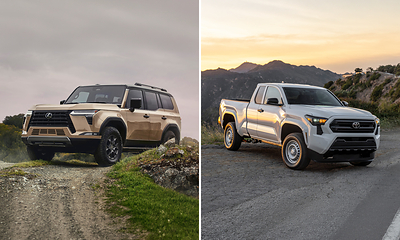
For the third quarter, TMNA reported sales of 633,223 vehicles, up 0.6 percent on a volume basis and up 0.6 percent on a DSR basis versus the third quarter of 2025. Sales of electrified vehicles for the third quarter totaled 363,367, up 28.5 percent on a volume basis and up 28.5 percent on a DSR basis, representing 57.4 percent of total sales volume.
Toyota division posted September sales of 171,469 vehicles, up 7.9 percent on a volume basis and up 3.6 percent on a DSR basis. For the quarter, Toyota division reported sales of 540,167 vehicles, up 0.5 percent on a volume basis and up 0.5 percent on a DSR basis.
Lexus division posted September sales of 29,837 vehicles, up 11.4 percent on a volume basis and up 6.9 percent on a DSR basis. For the quarter, Lexus division reported sales of 93,056 vehicles, up 1.6 percent on a volume basis and up 1.6 percent on a DSR basis.
"Our third-quarter results reinforce a simple truth—customers want choices," said Andrew Gilleland, senior vice president, Automotive Operations Group, Toyota Motor North America. "From affordability to electrification, our multi-path strategy continues to meet customers where they are and give them options that fit their lifestyles. With solid momentum and disciplined inventory heading into Q4, we're well-positioned to finish the year strong."
Highlights (volume basis unless otherwise noted)
TMNA:
- Third quarter sales up 0.6 percent
- Third quarter electrified vehicle sales of 363,367, up 28.5 percent
- September sales up 8.4 percent
- September electrified vehicle sales of 117,215, up 37.8 percent
- 32 total electrified vehicles currently available in dealerships between both the Toyota and Lexus brands
- Among the lowest incentives among full-line manufacturers
Toyota Division:
- Third quarter sales up 0.5 percent
- Third quarter electrified vehicle sales of 325,227, up 29.2 percent
- September sales up 7.9 percent
- September electrified vehicle sales of 104,105, up 36.6 percent
Lexus Division:
- Third quarter sales up 1.6 percent
- Third quarter electrified vehicle sales of 38,140, up 23.1 percent
- September sales up 11.4 percent
- September electrified vehicle sales of 13,110, up 47.4 percent
About Toyota
Toyota (NYSE:TM) has been a part of the cultural fabric in
Toyota directly employs nearly 64,000 people in
For more information about Toyota, visit www.ToyotaNewsroom.com.
Media contact:
Derrick Brown
derrick.brown@toyota.com
|
TOYOTA |
||||||||
|
September 2026 |
||||||||
|
|
-- CURRENT MONTH -- |
-- CALENDAR YEAR TO DATE -- |
||||||
|
|
|
|
|
|
|
|
|
|
|
|
2026 |
2025 |
DSR % |
VOL % |
2026 |
2025 |
DSR % |
VOL % |
|
TOTAL TMNA |
201,306 |
185,748 |
4.0 |
8.4 |
1,876,614 |
1,865,876 |
0.6 |
0.6 |
|
TOTAL TOYOTA DIV. |
171,469 |
158,959 |
3.6 |
7.9 |
1,613,846 |
1,595,301 |
1.2 |
1.2 |
|
TOTAL LEXUS DIV. |
29,837 |
26,789 |
6.9 |
11.4 |
262,768 |
270,575 |
-2.9 |
-2.9 |
|
COROLLA |
19,365 |
18,457 |
0.7 |
4.9 |
195,141 |
179,983 |
8.4 |
8.4 |
|
SUPRA |
21 |
221 |
-90.9 |
-90.5 |
2,437 |
2,009 |
21.3 |
21.3 |
|
GR86 (INCL FR-S) |
460 |
652 |
-32.3 |
-29.4 |
5,642 |
8,107 |
-30.4 |
-30.4 |
|
MIRAI |
24 |
45 |
-48.8 |
-46.7 |
212 |
157 |
35.0 |
35.0 |
|
CROWN |
406 |
1,139 |
-65.8 |
-64.4 |
6,683 |
8,689 |
-23.1 |
-23.1 |
|
PRIUS |
3,169 |
3,813 |
-20.2 |
-16.9 |
29,223 |
46,777 |
-37.5 |
-37.5 |
|
CAMRY |
25,350 |
24,521 |
-0.8 |
3.4 |
260,684 |
234,426 |
11.2 |
11.2 |
|
TOTAL TOYOTA DIV. CAR |
48,795 |
48,849 |
-4.1 |
-0.1 |
500,024 |
480,151 |
4.1 |
4.1 |
|
IS |
2,227 |
1,429 |
49.6 |
55.8 |
22,257 |
14,668 |
51.7 |
51.7 |
|
RC |
1 |
97 |
-99.0 |
-99.0 |
239 |
1,080 |
-77.9 |
-77.9 |
|
ES |
3,077 |
3,208 |
-7.9 |
-4.1 |
10,333 |
29,788 |
-65.3 |
-65.3 |
|
LS |
2 |
44 |
-95.6 |
-95.5 |
150 |
894 |
-83.2 |
-83.2 |
|
LC |
104 |
50 |
99.7 |
108.0 |
1,124 |
1,004 |
12.0 |
12.0 |
|
TOTAL LEXUS DIV. CAR |
5,411 |
4,828 |
7.6 |
12.1 |
34,103 |
47,434 |
-28.1 |
-28.1 |
|
TOTAL TMNA CAR |
54,206 |
53,677 |
-3.1 |
1.0 |
534,127 |
527,585 |
1.2 |
1.2 |
|
C-HR BEV |
894 |
0 |
#N/A |
#N/A |
7,215 |
3 |
240,400.0 |
240,400.0 |
|
BZ |
2,381 |
61 |
3,647.1 |
3,803.3 |
24,944 |
12,264 |
103.4 |
103.4 |
|
BZ |
686 |
0 |
#N/A |
#N/A |
2,600 |
0 |
#N/A |
#N/A |
|
RAV4 |
34,192 |
36,599 |
-10.3 |
-6.6 |
253,664 |
358,134 |
-29.2 |
-29.2 |
|
COROLLA CROSS |
9,776 |
6,386 |
47.0 |
53.1 |
90,131 |
73,341 |
22.9 |
22.9 |
|
CROWN SIGNIA |
2,056 |
1,057 |
86.7 |
94.5 |
17,983 |
16,277 |
10.5 |
10.5 |
|
VENZA |
1 |
4 |
-76.0 |
-75.0 |
11 |
703 |
-98.4 |
-98.4 |
|
HIGHLANDER |
3,733 |
4,083 |
-12.2 |
-8.6 |
42,950 |
42,677 |
0.6 |
0.6 |
|
GRAND HIGHLANDER |
11,594 |
10,494 |
6.1 |
10.5 |
108,511 |
99,833 |
8.7 |
8.7 |
|
4RUNNER |
8,996 |
8,844 |
-2.4 |
1.7 |
107,987 |
67,001 |
61.2 |
61.2 |
|
SEQUOIA |
2,431 |
2,036 |
14.6 |
19.4 |
21,403 |
18,486 |
15.8 |
15.8 |
|
LAND CRUISER |
3,115 |
2,145 |
39.4 |
45.2 |
26,697 |
35,146 |
-24.0 |
-24.0 |
|
TOTAL TOYOTA DIV. SUV |
79,855 |
71,709 |
6.9 |
11.4 |
704,097 |
723,865 |
-2.7 |
-2.7 |
|
SIENNA |
9,778 |
7,802 |
20.3 |
25.3 |
84,770 |
75,876 |
11.7 |
11.7 |
|
TACOMA |
21,476 |
20,392 |
1.1 |
5.3 |
214,875 |
204,464 |
5.1 |
5.1 |
|
TUNDRA |
11,565 |
10,207 |
8.8 |
13.3 |
110,080 |
110,945 |
-0.8 |
-0.8 |
|
TOTAL TOYOTA DIV. PICKUP |
33,041 |
30,599 |
3.7 |
8.0 |
324,955 |
315,409 |
3.0 |
3.0 |
|
TOTAL TOYOTA DIV. TRUCK |
122,674 |
110,110 |
7.0 |
11.4 |
1,113,822 |
1,115,150 |
-0.1 |
-0.1 |
|
UX |
531 |
426 |
19.7 |
24.6 |
7,050 |
6,899 |
2.2 |
2.2 |
|
NX |
6,269 |
5,192 |
15.9 |
20.7 |
50,148 |
57,256 |
-12.4 |
-12.4 |
|
RZ |
578 |
86 |
545.2 |
572.1 |
10,214 |
5,339 |
91.3 |
91.3 |
|
RX |
9,370 |
8,682 |
3.6 |
7.9 |
89,824 |
80,427 |
11.7 |
11.7 |
|
TX |
4,466 |
4,418 |
-3.0 |
1.1 |
42,674 |
39,546 |
7.9 |
7.9 |
|
GX |
2,700 |
2,602 |
-0.4 |
3.8 |
23,205 |
28,244 |
-17.8 |
-17.8 |
|
LX |
512 |
555 |
-11.4 |
-7.7 |
5,550 |
5,430 |
2.2 |
2.2 |
|
TOTAL LEXUS DIV. TRUCK |
24,426 |
21,961 |
6.8 |
11.2 |
228,665 |
223,141 |
2.5 |
2.5 |
|
TOTAL TMNA TRUCK |
147,100 |
132,071 |
6.9 |
11.4 |
1,342,487 |
1,338,291 |
0.3 |
0.3 |
|
Selling Days |
25 |
24 |
|
|
229 |
229 |
|
|
|
DSR = Daily Selling Rate |
||||||||
|
|
|
|
|
|
|
|
|
|
|
|
|
|
|
|
|
|
|
|
|
TOYOTA |
||||||||
|
September 2026 |
||||||||
|
|
-- CURRENT MONTH -- |
|
-- CALENDAR YEAR TO DATE -- |
|||||
|
|
2026 |
2025 |
DSR % |
VOL% |
2026 |
2025 |
DSR % |
VOL% |
|
TOYOTA PRIUS HYBRID |
1,897 |
2,111 |
-13.7 |
-10.1 |
16,731 |
34,237 |
-51.1 |
-51.1 |
|
TOYOTA PRIUS PLUG-IN HYBRID |
1,272 |
1,702 |
-28.3 |
-25.3 |
12,492 |
12,540 |
-0.4 |
-0.4 |
|
TOYOTA COROLLA HYBRID |
2,814 |
2,365 |
14.2 |
19.0 |
36,734 |
37,135 |
-1.1 |
-1.1 |
|
TOYOTA CAMRY HYBRID |
25,350 |
24,515 |
-0.7 |
3.4 |
260,671 |
234,368 |
11.2 |
11.2 |
|
TOYOTA C-HR BEV |
894 |
0 |
#N/A |
#N/A |
7,215 |
0 |
#N/A |
#N/A |
|
TOYOTA MIRAI |
24 |
45 |
-48.8 |
-46.7 |
212 |
157 |
35.0 |
35.0 |
|
TOYOTA CROWN |
406 |
1,139 |
-65.8 |
-64.4 |
6,683 |
8,689 |
-23.1 |
-23.1 |
|
TOYOTA SIENNA HYBRID |
9,778 |
7,801 |
20.3 |
25.3 |
84,765 |
75,867 |
11.7 |
11.7 |
|
TOYOTA 4RUNNER HYBRID |
2,289 |
2,127 |
3.3 |
7.6 |
26,152 |
13,600 |
92.3 |
92.3 |
|
TOYOTA HIGHLANDER HYBRID |
1,088 |
1,771 |
-41.0 |
-38.6 |
26,739 |
19,842 |
34.8 |
34.8 |
|
TOYOTA GRAND HIGHLANDER HYBRID |
7,798 |
5,329 |
40.5 |
46.3 |
65,201 |
48,563 |
34.3 |
34.3 |
|
TOYOTA SEQUOIA HYBRID |
2,431 |
2,036 |
14.6 |
19.4 |
21,403 |
18,486 |
15.8 |
15.8 |
|
TOYOTA LAND CRUISER HYBRID |
3,115 |
2,145 |
39.4 |
45.2 |
26,697 |
35,146 |
-24.0 |
-24.0 |
|
TOYOTA BZ BEV |
2,381 |
61 |
3,647.1 |
3,803.3 |
24,944 |
12,264 |
103.4 |
103.4 |
|
TOYOTA BZ |
686 |
0 |
#N/A |
#N/A |
2,600 |
0 |
#N/A |
#N/A |
|
TOYOTA RAV4 HYBRID |
28,642 |
12,830 |
114.3 |
123.2 |
200,209 |
139,446 |
43.6 |
43.6 |
|
TOYOTA RAV4 PLUG-IN HYBRID |
5,544 |
1,952 |
172.7 |
184.0 |
32,228 |
16,776 |
92.1 |
92.1 |
|
TOYOTA COROLLA CROSS HYBRID |
1,821 |
2,214 |
-21.0 |
-17.8 |
13,905 |
24,594 |
-43.5 |
-43.5 |
|
TOYOTA CROWN SIGNIA |
2,056 |
1,057 |
86.7 |
94.5 |
17,983 |
16,277 |
10.5 |
10.5 |
|
TOYOTA VENZA HYBRID |
1 |
4 |
-76.0 |
-75.0 |
11 |
703 |
-98.4 |
-98.4 |
|
TOYOTA TACOMA HYBRID |
1,705 |
2,353 |
-30.4 |
-27.5 |
22,985 |
22,768 |
1.0 |
1.0 |
|
TOYOTA TUNDRA HYBRID |
2,113 |
2,637 |
-23.1 |
-19.9 |
20,574 |
22,065 |
-6.8 |
-6.8 |
|
LEXUS ES HYBRID |
2,489 |
1,472 |
62.3 |
69.1 |
5,133 |
13,671 |
-62.5 |
-62.5 |
|
LEXUS ES BEV |
586 |
0 |
#N/A |
#N/A |
2,083 |
0 |
#N/A |
#N/A |
|
LEXUS GS HYBRID |
0 |
0 |
#N/A |
#N/A |
0 |
0 |
#N/A |
#N/A |
|
LEXUS UX HYBRID |
531 |
426 |
19.7 |
24.6 |
7,050 |
6,899 |
2.2 |
2.2 |
|
LEXUS LX HYBRID |
316 |
261 |
16.2 |
21.1 |
2,868 |
1,987 |
44.3 |
44.3 |
|
LEXUS NX HYBRID |
2,359 |
2,089 |
8.4 |
12.9 |
22,699 |
23,002 |
-1.3 |
-1.3 |
|
LEXUS NX PLUG-IN HYBRID |
660 |
289 |
119.2 |
128.4 |
8,000 |
5,658 |
41.4 |
41.4 |
|
LEXUS RZ BEV |
578 |
86 |
545.2 |
572.1 |
10,214 |
5,339 |
91.3 |
91.3 |
|
LEXUS RX HYBRID |
4,052 |
2,915 |
33.4 |
39.0 |
37,448 |
29,546 |
26.7 |
26.7 |
|
LEXUS RX PLUG-IN HYBRID |
520 |
412 |
21.2 |
26.2 |
5,738 |
4,733 |
21.2 |
21.2 |
|
LEXUS TX HYBRID |
1,012 |
858 |
13.2 |
17.9 |
8,787 |
7,311 |
20.2 |
20.2 |
|
LEXUS TX PLUG-IN HYBRID |
7 |
83 |
-91.9 |
-91.6 |
953 |
689 |
38.3 |
38.3 |
|
LEXUS LS HYBRID |
0 |
5 |
-100.0 |
-100.0 |
1 |
34 |
-97.1 |
-97.1 |
|
LEXUS LC HYBRID |
0 |
0 |
#N/A |
#N/A |
5 |
9 |
-44.4 |
-44.4 |
|
TOTAL TMNA Electrified Vehicles |
117,215 |
85,090 |
32.2 |
37.8 |
1,038,114 |
892,402 |
16.3 |
16.3 |
|
TOTAL TOYOTA Electrified Vehicles |
104,105 |
76,194 |
31.2 |
36.6 |
927,135 |
793,524 |
16.8 |
16.8 |
|
TOTAL LEXUS Electrified Vehicles |
13,110 |
8,896 |
41.5 |
47.4 |
110,979 |
98,878 |
12.2 |
12.2 |
|
TOTAL TMNA SALES RATIO |
58.2 % |
45.8 % |
|
|
55.3 % |
47.8 % |
|
|
|
Selling Days |
25 |
24 |
|
|
229 |
229 |
|
|

 View original content to download multimedia:https://www.prnewswire.com/news-releases/toyota-motor-north-america-reports-september-third-quarter-2026-us-sales-results-302896251.html
SOURCE Toyota Motor North America
FAQ
AI-generated questions and answers. How Rhea-AI works. Not financial advice.
How many vehicles did Toyota sell in the U.S. in September 2026?
Toyota Motor North America sold 201,306 vehicles in September 2026, up 8.4 percent by volume from September 2025. Sales increased 4.0 percent on a daily selling rate basis. Toyota division accounted for 171,469 vehicles and Lexus for 29,837.
How did Toyota's third-quarter 2026 U.S. electrified vehicle sales perform?
Third-quarter electrified vehicle sales increased 28.5 percent year over year to 363,367, representing 57.4 percent of total U.S. sales. Toyota division sold 325,227 electrified vehicles, up 29.2 percent, while Lexus sold 38,140, up 23.1 percent.
Why do Toyota's September 2026 volume and daily selling rate growth figures differ?
September 2026 had 25 selling days, compared with 24 in September 2025. Volume growth measures total vehicles sold, while daily selling rate growth measures sales per selling day. Total U.S. sales increased 8.4 percent by volume and 4.0 percent by daily selling rate.