Viatris Reports First-Quarter 2026 Financial Results
Rhea-AI Summary
Viatris (Nasdaq: VTRS) reported Q1 2026 total revenues of $3.52B, up 8% reported and 3% operationally; U.S. GAAP net earnings were $176M and Adjusted EBITDA was $1.05B. The company reaffirmed 2026 guidance, including $14.45–$14.95B revenue and $4.15–$4.45B adjusted EBITDA, and expects >$2.5B cash available for deployment in 2026.
Key regional strength was Greater China; operational headwinds included ARV supply constraints in Emerging Markets. Cash from operations and free cash flow were lower versus Q1 2025.
AI-generated analysis. Not financial advice.
Positive
- Total revenues of $3.52B (+8% reported, +3% operational)
- Adjusted EBITDA of $1.05B (+14% reported, +10% operational)
- Adjusted EPS of $0.59 (+18% reported, +14% operational)
- Reaffirmed 2026 guidance: midpoint revenue $14.7B, adjusted EBITDA midpoint $4.3B
- Greater China net sales growth of 22% reported (18% operational)
Negative
- U.S. GAAP gross margin declined to 32.9% from 35.7% (≈280 bps drop)
- U.S. GAAP net cash from operations fell 27% to $388M versus Q1 2025
- Free cash flow declined 29% to $348M (excluding transaction-related costs: $459M)
- Supply constraints in ARV business within Emerging Markets affected generics sales
News Market Reaction – VTRS
On the day this news was published, VTRS gained 9.03%, reflecting a notable positive market reaction. Argus tracked a peak move of +5.1% during that session. Our momentum scanner triggered 11 alerts that day, indicating notable trading interest and price volatility. This price movement added approximately $1.68B to the company's valuation, bringing the market cap to $20.32B at that time.
Data tracked by StockTitan Argus on the day of publication.
Key Figures
Peers on Argus
VTRS gained 2.77% while peers were mixed: TEVA (-0.08%), RDY (-1.03%), NBIX (-1.32%), UTHR (+1.24%), and ELAN (+12.56%). The move appears stock-specific rather than a broad sector rotation.
Previous Earnings Reports
| Date | Event | Sentiment | Move | Catalyst |
|---|---|---|---|---|
| Feb 26 | Q4/FY 2025 earnings | Positive | -5.2% | Met or exceeded 2025 guidance, cost-savings plan, but shares dropped on results. |
| Nov 06 | Q3 2025 earnings | Neutral | -6.0% | Flat revenue, lower EBITDA/EPS but raised 2025 guidance and detailed pipeline progress. |
| Aug 07 | Q2 2025 earnings | Positive | +7.3% | Strong Q2 beat expectations, solid adjusted EBITDA/EPS and reiterated 2025 guidance. |
| May 08 | Q1 2025 earnings | Neutral | +5.7% | Revenue decline and goodwill impairment offset by reaffirmed guidance and pipeline wins. |
| Feb 27 | Q4/FY 2024 earnings | Negative | -15.2% | Met 2024 guidance but highlighted sizable 2025 revenue/EBITDA hit from FDA issues. |
Earnings reactions have been mixed: one clear divergence where positive results saw a selloff, but most prior reports showed price moves generally aligning with the underlying tone.
Over the last five earnings cycles, Viatris reported stable to growing revenues, consistent adjusted EBITDA above $1B per quarter in several periods, and reiterated or raised guidance multiple times. Shares sometimes fell on seemingly solid reports, such as Q4 2025, but also rallied on strong Q2 and Q1 2025 updates. The current Q1 2026 release, with revenue and adjusted EPS growth plus reaffirmed 2026 guidance, fits the ongoing narrative of disciplined execution and cost control.
Historical Comparison
In the past five earnings releases, VTRS averaged a -2.66% move, often skewed to downside. Today’s +2.77% post-Q1 2026 reaction contrasts with that pattern and reflects markets rewarding visible growth and reaffirmed guidance.
Earnings updates since FY 2024 show Viatris maintaining ~$14–14.7B annual revenue, delivering >$4B adjusted EBITDA, executing cost savings, and repeatedly reaffirming or tightening guidance while advancing late-stage pipeline assets.
Regulatory & Risk Context
Market Pulse Summary
The stock moved +9.0% in the session following this news. A strong positive reaction aligns with solid Q1 2026 execution: total revenues of $3,517.0M, adjusted EBITDA of $1,049.5M, and adjusted EPS of $0.59 all improved year over year. Historically, earnings moves averaged -2.66%, so a large upside move would mark a break from past skepticism. Investors would still need to watch free cash flow trends and delivery against the reaffirmed 2026 guidance ranges.
Key Terms
adjusted ebitda financial
adjusted eps financial
free cash flow financial
phase 3 medical
pharmacokinetic medical
presbyopia medical
serotonin-noradrenaline reuptake inhibitor medical
non-gaap financial measures financial
AI-generated analysis. Not financial advice.
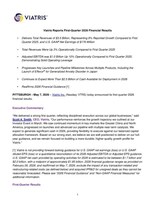
- Delivers Total Revenues of
$3.5 Billion 8% Reported Growth Compared to First Quarter 2025, andU.S. GAAP Net Earnings of$176 Million - Total Revenues Were Up
3% Operationally Compared to First Quarter 2025 - Adjusted EBITDA was
$1.0 Billion 10% Operationally Compared to First Quarter 2025, Demonstrating Solid Operating Leverage - Progresses Key Launches and Pipeline Milestones Across Multiple Products, Including the Launch of Effexor® for Generalized Anxiety Disorder in
Japan - Continues to Expect More Than
$2.5 Billion - Reaffirms 2026 Financial Guidance [1]
Executive Commentary
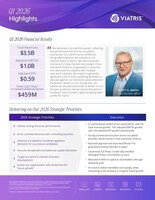
"We delivered a strong first quarter, reflecting disciplined execution across our global businesses," said Scott A. Smith, CEO, Viatris. "Our performance reinforces the growth trajectory we outlined at our Investor Event in March. We saw continued momentum in key markets like
[1] Viatris is not providing forward-looking guidance for
First-Quarter Results
Three Months Ended | |||||||
March 31, | |||||||
(Unaudited; in millions, except %s and per share amounts) | 2026 | 2025 | Reported | Operational | |||
Total Revenues | $ 3,517.0 | $ 3,254.3 | 8 % | 3 % | |||
Total Net Sales | $ 3,509.7 | $ 3,243.2 | 8 % | 3 % | |||
Developed Markets | 2,020.8 | 1,891.7 | 7 % | 1 % | |||
Emerging Markets | 535.4 | 519.9 | 3 % | — % | |||
JANZ | 273.4 | 276.1 | (1) % | (2) % | |||
680.1 | 555.5 | 22 % | 18 % | ||||
Net Sales by Product Category | |||||||
Brands | $ 2,332.5 | $ 2,116.9 | 10 % | 4 % | |||
Generics | 1,177.2 | 1,126.3 | 5 % | 1 % | |||
$ 1,157.2 | $ 1,161.2 | — % | |||||
32.9 % | 35.7 % | ||||||
Adjusted Gross Profit (2) | $ 1,970.3 | $ 1,819.6 | 8 % | ||||
Adjusted Gross Margin (2) | 56.0 % | 55.9 % | |||||
$ 176.4 | NM | ||||||
$ 0.15 | $ (2.55) | NM | |||||
Adjusted Net Earnings (2) | $ 694.1 | $ 600.3 | 16 % | ||||
Adjusted EPS (2) | $ 0.59 | $ 0.50 | 18 % | 14 % | |||
EBITDA (2) | $ 548.9 | NM | |||||
Adjusted EBITDA (2) | $ 1,049.5 | $ 923.5 | 14 % | 10 % | |||
$ 388.3 | $ 535.5 | (27) % | |||||
Capital Expenditures | 39.9 | 42.6 | (6) % | ||||
Free Cash Flow (2)(4) | $ 348.4 | $ 492.9 | (29) % | ||||
___________ | |
(1) | See "Certain Key Terms and Presentation Matters" in this release for more information. |
(2) | Non-GAAP financial measures. See "Non-GAAP Financial Measures" for additional information. |
(3) | For the three months ended March 31, 2025, includes the previously disclosed goodwill impairment charge of |
(4) | Excluding the impact of transaction-related and restructuring-related costs of |
Financial Highlights for the First Quarter of 2026
- Total revenues were
$3.5 billion 8% on a reported basis and up3% on an operational basis compared to first-quarter 2025 results, primarily driven by strong growth inGreater China . - Brands net sales reflect accelerated growth in
Greater China and continued strength in Emerging Markets. - Generics net sales reflect contributions from new product launches, in addition to growth of certain products in
North America , partially offset by supply constraints in our ARV business within Emerging Markets. - The Company generated approximately
$71 million $450 million $550 million U.S. GAAP net earnings were$176 million U.S. GAAP net loss of$3.0 billion U.S. GAAP diluted EPS was$0.15 $(2.55) $2.9 billion - Adjusted EBITDA was
$1.0 billion 14% on a reported basis and up10% on an operational basis compared to the first quarter of 2025, and adjusted EPS was$0.59 18% on a reported basis and up14% on an operational basis compared to the first quarter of 2025. - The Company generated
U.S. GAAP net cash provided by operating activities of$388 million $459 million
Additional Highlights
- In May 2026, the Company announced that six abstracts on its investigational low dose estrogen weekly patch (150 mcg norelgestromin and 17.5 mcg ethinyl estradiol) for contraception were presented at the 2026 American College of Obstetricians and Gynecologists Annual Clinical & Scientific Meeting in
Washington, D.C. , May 1-3, 2026. The presentations included positive results from the previously announced Phase 3 study evaluating the contraceptive efficacy and safety of the Company's investigational low dose estrogen weekly patch and new data on the patch's adhesion profile under normal and under extreme conditions, as well as pharmacokinetic data and data on cycle control. - In April 2026, the Company announced that four abstracts were presented at the American Society of Cataract and Refractive Surgery Annual Meeting in
Washington, D.C. , April 10-13, 2026. The presentations included data across various areas of ophthalmology, including full results from VEGA-3, a Phase 3 study evaluating MR-141 (phentolamine ophthalmic solution0.75% ) for presbyopia. - In March 2026, the Company announced that
Japan's Ministry of Health, Labour and Welfare approved Effexor® SR 37.5 mg / 75 mg capsules (venlafaxine hydrochloride), a serotonin-noradrenaline reuptake inhibitor, for the treatment of adults with generalized anxiety disorder.
2026 Financial Guidance
Viatris is reaffirming its 2026 financial guidance ranges, as set forth below. The Company is not providing forward-looking guidance for
(In millions, except Adjusted EPS) | Estimated Guidance |
Midpoint (2) | |
Total Revenues | |||
Adjusted EBITDA (1) | |||
Adjusted EPS (1) | |||
Free Cash Flow (1) Excluding Transaction-related and Restructuring-related Costs |
(1) | Non-GAAP financial measures. See "Non-GAAP Financial Measures" for additional information. |
(2) | 2026 Financial Guidance as provided on February 26, 2026, and reaffirmed on May 7, 2026, excludes any acquired IPR&D for unsigned deals to be incurred in any future period as it cannot be reasonably forecasted. |
Conference Call and Earnings Materials
As previously announced, Viatris will host a conference call and live webcast, today at 8:30 a.m. ET, to review the Company's first-quarter 2026 financial results. Investors and the general public are invited to listen to a live webcast of the call at investor.viatris.com or by calling 844.308.3344 or 412.317.1896 for international callers. The "Viatris Q1 2026 Earnings Presentation," which will be referenced during the call, can be found at investor.viatris.com. A replay of the webcast also will be available on the website.
About Viatris
Viatris Inc. (Nasdaq: VTRS) is a global healthcare company whose mission is to empower people worldwide to live healthier at every stage of life. We meet the needs of patients around the world by acting decisively with ingenuity and resolve. Whether we're developing new medicines, working to maintain a resilient supply of needed therapies, or pursuing bold innovation, we strive to deliver solutions that are effective at scale and built to endure. We're purpose-built to make an impact with a dynamic portfolio that spans generics, established brands and innovative medicines that address areas of significant unmet need. We are headquartered in the
Non-GAAP Financial Measures
This press release includes the presentation and discussion of certain financial information that differs from what is reported under accounting principles generally accepted in
With respect to the guidance ranges as provided on February 26, 2026, at that time the Company did not provide forward-looking guidance for
Certain Key Terms and Presentation Matters
New product sales, new product launches or new product revenues: Refers to revenue from new products launched in 2026 and the carryover impact of new products, including business development, launched within the last 12 months.
Operational change: Refers to constant currency percentage changes and is derived by translating amounts for the current period at prior year comparative period exchange rates and in doing so shows the percentage change from 2026 constant currency net sales, total revenues, adjusted EBITDA, and adjusted EPS to the corresponding amount in the prior year.
Transaction-related costs: Refers to the impact of any acquisition and divestiture-related transaction costs, including taxes.
Restructuring-related costs: Refers to the impact of any cash costs associated with the restructuring activities of the enterprise-wide strategic review, which are expected to be primarily related to severance and employee benefits expense, as well as other costs, including those related to contract terminations, vendor consolidations, product transfer costs and network related simplification and modernization costs.
Forward-Looking Statements
This press release contains "forward-looking statements". These statements are made pursuant to the safe harbor provisions of the Private Securities Litigation Reform Act of 1995. Such forward-looking statements may include, without limitation, statements about our 2026 financial guidance; demonstrating solid operating leverage; progresses key launches and pipeline milestones across multiple products, including the launch of Effexor® for generalized anxiety disorder in
Viatris Inc. and Subsidiaries Condensed Consolidated Statements of Operations (Unaudited) | |||
Three Months Ended | |||
March 31, | |||
(In millions, except per share amounts) | 2026 | 2025 | |
Revenues: | |||
Net sales | $ 3,509.7 | $ 3,243.2 | |
Other revenues | 7.3 | 11.1 | |
Total revenues | 3,517.0 | 3,254.3 | |
Cost of sales | 2,359.8 | 2,093.1 | |
Gross profit | 1,157.2 | 1,161.2 | |
Operating expenses: | |||
Research and development | 248.6 | 222.0 | |
Acquired IPR&D | 6.0 | 10.0 | |
Selling, general and administrative | 928.8 | 948.1 | |
Impairment of goodwill | — | 2,936.8 | |
Litigation settlements and other contingencies, net | 53.5 | (73.5) | |
Total operating expenses | 1,236.9 | 4,043.4 | |
Loss from operations | (79.7) | (2,882.2) | |
Interest expense | 120.1 | 115.5 | |
Other expense, net | 47.5 | 99.3 | |
Loss before income taxes | (247.3) | (3,097.0) | |
Income tax benefit | (423.7) | (55.0) | |
Net earnings (loss) | $ 176.4 | $ (3,042.0) | |
Earnings (loss) per share attributable to Viatris Inc. shareholders | |||
Basic | $ 0.15 | $ (2.55) | |
Diluted | $ 0.15 | $ (2.55) | |
Weighted average shares outstanding: | |||
Basic | 1,155.4 | 1,192.4 | |
Diluted | 1,175.3 | 1,192.4 | |
Viatris Inc. and Subsidiaries Condensed Consolidated Balance Sheets (Unaudited) | |||
(In millions) | March 31, | December 31, | |
ASSETS | |||
Assets | |||
Current assets: | |||
Cash and cash equivalents | $ 1,804.2 | $ 1,322.4 | |
Accounts receivable, net | 3,076.3 | 3,031.3 | |
Inventories | 3,927.0 | 3,999.2 | |
Prepaid expenses and other current assets | 2,109.3 | 1,436.3 | |
Total current assets | 10,916.8 | 9,789.2 | |
Intangible assets, net | 14,482.3 | 15,102.1 | |
Goodwill | 6,692.4 | 6,754.7 | |
Other non-current assets | 4,743.1 | 5,547.1 | |
Total assets | $ 36,834.6 | $ 37,193.1 | |
LIABILITIES AND EQUITY | |||
Liabilities | |||
Current portion of long-term debt and other long-term obligations | $ 1,931.1 | $ 1,933.3 | |
Other current liabilities | 4,879.2 | 5,161.0 | |
Long-term debt | 12,413.5 | 12,480.6 | |
Other non-current liabilities | 2,953.1 | 2,906.9 | |
Total liabilities | 22,176.9 | 22,481.8 | |
Shareholders' equity | 14,657.7 | 14,711.3 | |
Total liabilities and equity | $ 36,834.6 | $ 37,193.1 | |
Viatris Inc. and Subsidiaries Key Product Net Sales, on a Consolidated Basis (Unaudited) | ||||
Three months ended March 31, | ||||
(In millions) | 2026 | 2025 | ||
Select Key Global Products | ||||
Lipitor ® | $ 462.0 | $ 388.0 | ||
Norvasc ® | 210.0 | 172.3 | ||
Lyrica ® | 120.6 | 112.6 | ||
EpiPen® Auto-Injectors | 101.1 | 96.7 | ||
Creon ® | 97.4 | 82.4 | ||
Viagra ® | 95.0 | 98.5 | ||
Zoloft ® | 72.6 | 60.2 | ||
Celebrex ® | 67.1 | 63.4 | ||
Effexor ® | 62.0 | 59.3 | ||
Xalabrands | 39.2 | 37.1 | ||
Select Key Segment Products | ||||
Yupelri ® | $ 62.5 | $ 58.3 | ||
Dymista ® | 37.3 | 42.8 | ||
Xanax ® | 34.8 | 32.3 | ||
Amitiza ® | 34.0 | 33.3 | ||
____________ | |
(a) | The Company does not disclose net sales for any products considered competitively sensitive. |
(b) | Products disclosed may change in future periods, including as a result of seasonality, competition or new product launches. |
(c) | Amounts include the impact of foreign currency fluctuations compared to the prior year period. |
Viatris Inc. and Subsidiaries
Reconciliation of Non-GAAP Financial Measures
(Unaudited)
Reconciliation of
Below is a reconciliation of
Three Months Ended March 31, | |||||||
(In millions, except per share amounts) | 2026 | 2025 | |||||
$ 176.4 | $ 0.15 | $ (3,042.0) | |||||
Purchase accounting amortization (primarily included in cost of sales) | 591.5 | 583.5 | |||||
Impairment of goodwill | — | 2,936.8 | |||||
Litigation settlements and other contingencies, net | 53.5 | (73.5) | |||||
Interest expense (primarily amortization of premiums and discounts on long term | (10.1) | (9.2) | |||||
Loss on divestitures of businesses (included in other expense, net) | 13.9 | 36.9 | |||||
Acquisition and divestiture-related costs (primarily included in cost of sales and | 62.3 | 40.7 | |||||
Restructuring costs (b) | 92.5 | 92.9 | |||||
Share-based compensation expense | 48.2 | 55.2 | |||||
Other special items included in: | |||||||
Cost of sales (c) | 142.4 | 41.6 | |||||
Research and development expense | 2.8 | 0.7 | |||||
Selling, general and administrative expense | 35.4 | 17.6 | |||||
Other expense, net (d) | 61.3 | 101.4 | |||||
Tax effect of the above items and other income tax related items (e) | (576.0) | (182.3) | |||||
Adjusted net earnings and adjusted EPS | $ 694.1 | $ 0.59 | $ 600.3 | $ 0.50 | |||
Weighted average diluted shares outstanding | 1,175.3 | 1,203.0 | |||||
____________ | ||
Significant items include the following: | ||
(a) | Acquisition and divestiture-related costs consist primarily of contractual obligations related to divestitures, transaction costs including legal and consulting fees, and integration activities. | |
(b) | For the three months ended March 31, 2026, charges include approximately | |
(c) | For the three months ended March 31, 2026, includes certain asset impairments, contractual termination costs, and incremental manufacturing variances and certain remediation costs at plants slated for sale or closure or undergoing remediation activities of approximately | |
(d) | For the three months ended March 31, 2026, charges include a loss of approximately | |
(e) | Adjusted for changes for uncertain tax positions. | |
Reconciliation of
Below is a reconciliation of
Three Months Ended | |||
March 31, | |||
(In millions) | 2026 | 2025 | |
$ 176.4 | $ (3,042.0) | ||
Add / (deduct) adjustments: | |||
Income tax benefit | (423.7) | (55.0) | |
Interest expense (a) | 120.1 | 115.5 | |
Depreciation and amortization (b) | 676.1 | 664.7 | |
EBITDA | $ 548.9 | $ (2,316.8) | |
Add / (deduct) adjustments: | |||
Share-based compensation expense | 48.2 | 55.2 | |
Litigation settlements and other contingencies, net | 53.5 | (73.5) | |
Loss on divestitures of businesses | 13.9 | 36.9 | |
Impairment of goodwill | — | 2,936.8 | |
Restructuring, acquisition and divestiture-related and other special items (c) | 385.0 | 284.9 | |
Adjusted EBITDA | $ 1,049.5 | $ 923.5 | |
____________ | |
(a) | Includes amortization of premiums and discounts on long-term debt. |
(b) | Includes purchase accounting related amortization. |
(c) | See items detailed in the Reconciliation of |
Summary of Total Revenues by Segment
Three Months Ended | |||||||||||
March 31, | |||||||||||
(In millions, except %s) | 2026 | 2025 | % | 2026 | 2026 | Constant | |||||
Net sales | |||||||||||
Developed Markets | 7 % | $ (117.7) | $ 1,903.1 | 1 % | |||||||
680.1 | 555.5 | 22 % | (25.6) | 654.5 | 18 % | ||||||
JANZ | 273.4 | 276.1 | (1) % | (3.9) | 269.5 | (2) % | |||||
Emerging Markets | 535.4 | 519.9 | 3 % | (14.6) | 520.8 | — % | |||||
Total net sales | 8 % | $ (161.8) | $ 3,347.9 | 3 % | |||||||
Other revenues (3) | 7.3 | 11.1 | NM | (0.2) | 7.1 | NM | |||||
Consolidated total revenues (4) | 8 % | $ (162.0) | $ 3,355.0 | 3 % | |||||||
____________ | |
(1) | Currency impact is shown as unfavorable (favorable). |
(2) | The constant currency percentage change is derived by translating net sales or revenues for the current period at prior year comparative period exchange rates, and in doing so shows the percentage change from 2026 constant currency net sales or revenues to the corresponding amount in the prior year. |
(3) | For the three months ended March 31, 2026, other revenues in Developed Markets, JANZ, and Emerging Markets were approximately |
(4) | Amounts exclude intersegment revenue which eliminates on a consolidated basis. |
Reconciliation of Statements of Operations Line Items | |||
(Unaudited) | |||
Three Months Ended | |||
March 31, | |||
(In millions, except %s) | 2026 | 2025 | |
$ 2,359.8 | $ 2,093.1 | ||
Deduct: | |||
Purchase accounting amortization and other related items | (591.5) | (583.5) | |
Acquisition and divestiture-related costs | (28.4) | (12.2) | |
Restructuring costs | (49.8) | (19.8) | |
Share-based compensation expense | (1.0) | (1.3) | |
Other special items, including restructuring related costs | (142.4) | (41.6) | |
Adjusted cost of sales | $ 1,546.7 | $ 1,434.7 | |
Adjusted gross profit (a) | $ 1,970.3 | $ 1,819.6 | |
Adjusted gross margin (a) | 56 % | 56 % | |
Three Months Ended | |||
March 31, | |||
(In millions, except %s) | 2026 | 2025 | |
$ 248.6 | $ 222.0 | ||
Deduct: | |||
Acquisition and divestiture-related costs | (2.0) | (0.7) | |
Restructuring costs | (0.6) | (0.8) | |
Share-based compensation expense | (2.7) | (2.3) | |
Other special items | (2.8) | (0.7) | |
Adjusted R&D | $ 240.5 | $ 217.5 | |
Adjusted R&D as % of total revenues | 7 % | 7 % | |
Three Months Ended | |||
March 31, | |||
(In millions, except %s) | 2026 | 2025 | |
$ 928.8 | $ 948.1 | ||
Deduct: | |||
Acquisition and divestiture-related costs | (32.0) | (27.8) | |
Restructuring costs | (42.0) | (72.3) | |
Share-based compensation expense | (44.5) | (51.7) | |
Other special items and reclassifications | (35.4) | (17.6) | |
Adjusted SG&A | $ 774.9 | $ 778.7 | |
Adjusted SG&A as % of total revenues | 22 % | 24 % | |
Three Months Ended | |||
March 31, | |||
(In millions) | 2026 | 2025 | |
$ 1,236.9 | $ 4,043.4 | ||
Add / (Deduct): | |||
Litigation settlements and other contingencies, net | (53.5) | 73.5 | |
R&D adjustments | (8.1) | (4.5) | |
SG&A adjustments | (153.9) | (169.4) | |
Impairment of goodwill adjustments | — | (2,936.8) | |
Adjusted total operating expenses | $ 1,021.4 | $ 1,006.2 | |
Adjusted earnings from operations (b) | $ 948.9 | $ 813.4 | |
Three Months Ended | |||
March 31, | |||
(In millions) | 2026 | 2025 | |
$ 120.1 | $ 115.5 | ||
Add / (Deduct): | |||
Accretion of contingent consideration liability | (0.9) | (1.2) | |
Amortization of premiums and discounts on long-term debt | 11.8 | 11.0 | |
Other special items | (0.7) | (0.6) | |
Adjusted interest expense | $ 130.3 | $ 124.7 | |
Three Months Ended | |||
March 31, | |||
(In millions) | 2026 | 2025 | |
$ 47.5 | $ 99.3 | ||
Add / (Deduct): | |||
Fair value adjustments on non-marketable equity investments | — | (115.8) | |
Fair value adjustments on marketable equity investments | (64.9) | — | |
Loss on divestitures of businesses | (13.9) | (36.9) | |
Other items | 3.7 | 14.4 | |
Adjusted other income, net | $ (27.6) | $ (39.0) | |
Three Months Ended | |||
March 31, | |||
(In millions, except %s) | 2026 | 2025 | |
$ (247.3) | $ (3,097.0) | ||
Total pre-tax non-GAAP adjustments | 1,093.7 | 3,824.7 | |
Adjusted earnings before income taxes | $ 846.4 | $ 727.7 | |
$ (423.7) | $ (55.0) | ||
Adjusted tax expense | 576.0 | 182.3 | |
Adjusted income tax provision | $ 152.3 | $ 127.3 | |
Adjusted effective tax rate | 18.0 % | 17.5 % | |
___________ | |
(a) | |
(b) | |
Reconciliation of Estimated 2026 U.S. GAAP Net Cash Provided by Operating Activities to Free Cash Flow as of February 26, 2026, and May 7, 2026 | |
(Unaudited) | |
A reconciliation of the estimated 2026 U.S. GAAP Net Cash provided by Operating Activities to Free Cash Flow is presented below: | |
(In millions) | |
Estimated | |
Less: Capital Expenditures | |
Free Cash Flow | |
Add: Estimated Transaction-related and Restructuring-related Costs | |
Free Cash Flow Excluding Transaction-related and Restructuring-related Costs | |
![]()
![]() View original content to download multimedia:https://www.prnewswire.com/news-releases/viatris-reports-first-quarter-2026-financial-results-302765461.html
View original content to download multimedia:https://www.prnewswire.com/news-releases/viatris-reports-first-quarter-2026-financial-results-302765461.html
SOURCE Viatris Inc.