
America's housing deficit held steady at 4.7 million units for the first time in years
Zillow (NASDAQ:Z) reports that America's housing deficit was essentially flat in 2024 at 4.74 million homes, increasing by only 43,438 units versus much larger annual increases in 2022 and 2023.
Sentiment and the balance of points
Rhea-AI Sentiment reads the wording of the document, how positive or negative its language is on a 1 to 5 scale. The balance of points shown with the takes weighs what the document actually discloses, so the two can disagree, for example when a trial that missed its main goal is described in upbeat language.
Rhea-AI Summary
Zillow (NASDAQ:Z) reports that America's housing deficit was essentially flat in 2024 at 4.74 million homes, increasing by only 43,438 units versus much larger annual increases in 2022 and 2023. According to Zillow, this plateau follows a construction surge that added about 1.4 million housing units in 2024, supported by a 50‑year high in newly finished multifamily homes. The company links the persistent deficit to nearly two decades of underbuilding since the 2008 financial crisis and identifies it as a key driver of the affordability crisis.
Zillow notes that affordability, measured as the share of listings affordable to a median‑income household, stabilized nationally in 2024 and has been improving into 2026, reaching 35.2% in May 2026, up from 30.8% a year earlier. The largest deficits are concentrated in expensive metros such as New York, Los Angeles, Boston, San Francisco and Washington, D.C., where affordable listing shares are far below the national level. Zillow advocates reforms including more flexible zoning, streamlined permitting and expanded support for manufactured housing to close the gap.
Details
News Market Reaction – Z
On Jul 15, the day this news came out, Z closed 6.23% above the previous close. Argus tracked a peak move of +2.8% during that session. Our momentum scanner recorded 11 alerts for this stock that day.
Data tracked by StockTitan Argus for the Jul 15 session.
Key Figures
- National housing deficit 2024
- 4.7 million homes
- Zillow analysis of U.S. Census Bureau data
- Deficit increase 2024
- 43,438 homes
- Year-over-year change in housing deficit
- Deficit increase 2022
- 256,847 homes
- Year-over-year change in housing deficit
- Deficit increase 2023
- 159,063 homes
- Year-over-year change in housing deficit
- Families doubling up 2024
- 8,172,802 families
- Households sharing with non-family members
- New housing units 2024
- 1.4 million units
- Increase in total U.S. housing units
- Affordable listings 2021
- 54%
- Share of for-sale listings affordable to median-income households
- Affordable listings 2023
- 33%
- Share of for-sale listings affordable to median-income households
Historical Context
-
Launch of Zillow Pro premium membership for agents using consumer insights.
-
Announcement of date and time for Q2 2026 earnings release.
-
June 2026 housing report showing higher sales and improving affordability metrics.
-
Data partnership with GoDaddy on Most Entrepreneurial Cities housing trends.
-
Introduction of personalized buyer hub and new tools like Zillow Preview.
24h Move is the share-price change in the day after each event; other market factors may also have contributed.
Key Terms
multifamily homes technical
median-income household financial
manufactured housing technical
american community survey technical
AI-generated analysis. How Rhea-AI works. Not financial advice.




A construction boom helped hold the deficit nearly flat in 2024, growing by just 43,000 homes
- According to new Zillow research, America's housing deficit grew by just 43,000 units in 2024 — down sharply from increases of 257,000 in 2022 and 159,000 in 2023 — as new multifamily construction reached a 50-year high.
- The deficit of 4.7 million homes remains the primary driver of the affordability crisis.
- In the four metro areas with the largest deficits —
New York ,Los Angeles ,Boston andSan Francisco — the share of listings affordable to a median-income household is far below the national figure of35%
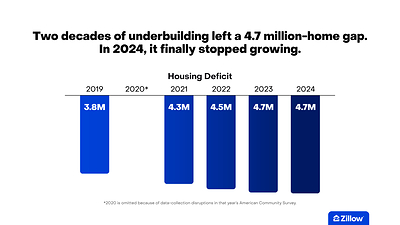
The 4.7 million shortfall is the root of our country's affordability crisis, and the product of nearly two decades of underbuilding that began after the 2008 financial crisis. For the first time in that period, new supply and new housing demand were roughly in balance in 2024.
"The country is not yet building its way out of the hole, but we stopped digging," said Orphe Divounguy, senior economist at Zillow. "Behind every missing home is a family doubling up, unable to find or afford a place of their own. Stopping the bleeding is progress, but making a real dent requires more than the status quo. We need flexible zoning to allow for more density, streamlined permitting and support for manufactured housing. It's been encouraging to see a bipartisan emphasis from Congress in finding solutions to the housing affordability crisis, because this is an issue that matters to everyone."
A building boom helped housing keep pace with demand
For more than a decade, homebuilding has not kept pace with family formation. That's forced millions to share housing with people outside their family — doubling up when they would likely prefer to have their own place. The deficit grew by 257,000 homes in 2022 and by 159,000 in 2023.
The 2024 increase of just 43,000 is small enough that after years of steady widening, the gap has effectively plateaued.
Year* | Housing deficit | Annual change | Families doubling up | Homes available to rent or buy |
2019 | 3,788,409 | — | 7,835,677 | 4,047,268 |
2021 | 4,283,926 | +495,517 (two-year change) | 7,967,749 | 3,683,823 |
2022 | 4,540,773 | +256,847 | 8,085,857 | 3,545,084 |
2023 | 4,699,836 | +159,063 | 8,147,081 | 3,447,245 |
2024 | 4,743,274 | +43,438 | 8,172,802 | 3,429,528 |
*2020 is omitted because of data-collection disruptions in that year's American Community Survey.
The deficit held steady primarily because of a homebuilding boom. The total number of housing units in the country increased by about 1.4 million in 2024, fueled by a 50-year high for newly finished multifamily homes. That was almost enough to absorb the year's increase in the number of families moving into new housing.
Affordability has improved in areas with the biggest construction booms
The leveling off of the deficit lines up with improving affordability. The share of for-sale listings on Zillow that were affordable to a median-income household — meaning they would spend no more than
Where the housing deficit is most severe
Even with the national picture stabilizing, the deficit remains heavily concentrated in the country's most expensive markets. The most severe deficits in 2024 were in
Builders responded faster to pandemic-era demand in areas with fewer building regulations. That has helped prices and rents ease in those metros and rebalanced those markets faster than in places with more stringent zoning.
Zillow supports making it easier to build
Closing a gap this large requires action on multiple fronts. Zillow advocates for measures that make it easier and less expensive to build, including modernizing zoning to allow more density, streamlining permitting and expanding financing options for manufactured housing. Together with the Casita Coalition, Zillow created the Build the Middle Playbook as a resource for advocates working to unlock more housing in their communities. The full case for what needs to change and why is laid out in Zillow's ongoing affordability research.
Metro area* | Housing deficit | Year-over-year change | Share of affordable listings (May 2026)** | Share of affordable listings (May 2025)** |
4,743,274 | 43,438 | 35.2 % | 30.8 % | |
405,956 | 3,595 | 13.8 % | 11.7 % | |
344,533 | 5,783 | 5.1 % | 2.5 % | |
115,282 | 8,760 | 47.4 % | 46.7 % | |
47,875 | -1,329 | 31.2 % | 25.1 % | |
11,903 | -8,261 | 37.4 % | 31.2 % | |
130,424 | -1,814 | 41.8 % | 34.4 % | |
80,675 | -773 | 42.9 % | 39.3 % | |
68,324 | -3,642 | 28.0 % | 24.1 % | |
66,346 | 23 | 39.8 % | 36.7 % | |
147,028 | -3,513 | 14.8 % | 11.4 % | |
96,038 | -2,665 | 29.0 % | 21.7 % | |
132,116 | -7,874 | 15.9 % | 12.9 % | |
86,221 | 1,134 | 14.9 % | 11.6 % | |
34,594 | -1,593 | 55.9 % | 53.5 % | |
97,380 | -4,543 | 16.2 % | 13.7 % | |
66,824 | -6,235 | 44.4 % | 41.2 % | |
97,465 | 1,634 | 10.2 % | 5.9 % | |
33,878 | 678 | 32.3 % | 27.1 % | |
70,358 | -561 | 28.9 % | 22.4 % | |
42,264 | 1,620 | 50.7 % | 46.1 % | |
16,976 | -392 | 59.1 % | 54.5 % | |
30,402 | 6,000 | 27.6 % | 23.1 % | |
22,545 | 447 | 34.6 % | 29.5 % | |
10,668 | -2,890 | 37.9 % | 30.9 % | |
67,196 | -3,289 | 21.2 % | 16.4 % | |
54,801 | -5,630 | 13.9 % | 9.7 % | |
13,186 | -2,234 | 57.0 % | 54.8 % | |
29,983 | -2,042 | 50.5 % | 50.2 % | |
60,359 | -2,851 | 27.7 % | 18.7 % | |
34,073 | 1,881 | 25.3 % | 20.5 % | |
26,107 | -1,816 | 43.9 % | 42.6 % | |
34,686 | -1,533 | 46.5 % | 42.3 % | |
15,831 | 826 | 50.5 % | 44.4 % | |
13,350 | -424 | 48.6 % | 44.3 % | |
55,594 | -784 | 13.7 % | 10.2 % | |
34,377 | -466 | 24.3 % | 19.3 % | |
20,553 | 666 | 31.3 % | 32.2 % | |
31,180 | 1,389 | 7.9 % | 7.4 % | |
10,328 | -2,915 | 33.3 % | 29.3 % | |
13,380 | -549 | 38.6 % | 36.1 % | |
12,173 | 568 | 37.1 % | 31.1 % | |
10,736 | -360 | 42.7 % | 35.8 % | |
1,641 | 98 | 45.3 % | 35.5 % | |
15,770 | 525 | 27.5 % | 25.2 % | |
12,430 | 1,323 | 46.8 % | 41.4 % | |
2,948 | -1,286 | 24.3 % | 18.8 % | |
35,676 | 2,418 | 23.8 % | 17.2 % | |
13,171 | 40 | 30.7 % | 28.2 % | |
18,357 | 1,163 | 61.4 % | 51.6 % | |
6,779 | 813 | 51.6 % | 47.8 % |
*Ordered by market size
**A listing is considered affordable if a household making that metro area's median income would spend no more than
About Zillow Group:
Zillow Group, Inc. (Nasdaq: Z and ZG) is reimagining real estate to make home a reality for more and more people.
As the most visited real estate app and website in the United States, Zillow connects hundreds of millions of consumers with innovative technology, trusted agents and loan officers, and seamless digital solutions. With industry-leading tools and resources, Zillow supercharges real estate professionals so they can grow their businesses and deliver exceptional client experiences. For renters and housing providers, Zillow offers not only a robust marketplace but a set of end-to-end products and services to streamline applications, leases, payments and more.
Zillow's ecosystem spans the entire home journey — from dreaming and shopping to renting, buying, selling and financing.
Zillow Group's affiliates, subsidiaries and brands include Zillow®, Zillow Premier Agent®, Zillow Home Loans®, Zillow Rentals®, Zillow® New Construction, Trulia®, StreetEasy®, Out East®, HotPads®, Follow Up Boss®, ShowingTime®, dotloop® and Zillow® Closing.
All marks herein are owned by MFTB Holdco, Inc., a Zillow affiliate. Zillow Home Loans, LLC is an Equal Housing Lender, NMLS #10287 (www.nmlsconsumeraccess.org). © 2026 MFTB Holdco, Inc., a Zillow affiliate.
(ZFIN)

 View original content to download multimedia:https://www.prnewswire.com/news-releases/americas-housing-deficit-held-steady-at-4-7-million-units-for-the-first-time-in-years-302825885.html
SOURCE Zillow
FAQ
AI-generated questions and answers. How Rhea-AI works. Not financial advice.