NRSInsights’ August 2024 Retail Same-Store Sales Report
Rhea-AI Summary
NRSInsights released its August 2024 Retail Same-Store Sales Report, showing a 5.1% year-over-year increase in same-store sales. Key highlights include:
- Units sold increased 4.7% year-over-year
- Average transactions per store rose 1.8% year-over-year
- Average prices for top 500 items increased 3.5% year-over-year
The report noted strong growth in back-to-school categories and baking supplies. NRS' network comprises 32,300 active POS terminals in approximately 28,100 independent retail stores, processing $19.8 billion in sales through 1.4 billion transactions in the past 12 months.
AI-generated analysis. Not financial advice.
Positive
- Same-store sales increased 5.1% year-over-year
- Units sold increased 4.7% year-over-year
- Average number of transactions per store increased 1.8% year-over-year
- Strong growth in back-to-school categories and baking supplies
- NRS network processed $19.8 billion in sales through 1.4 billion transactions in the past 12 months
Negative
- Candy/Gum/Mints and Sweet Snacks categories continued to decline year-over-year
- Inflationary pressure increased to 3.5% in August, up from 2.5% in July
News Market Reaction – IDT
On the day this news was published, IDT declined 0.67%, reflecting a mild negative market reaction.
Data tracked by StockTitan Argus on the day of publication.
August same-store sales increased
NEWARK, N.J., Sept. 09, 2024 (GLOBE NEWSWIRE) -- NRSInsights, a provider of sales data and analytics drawn from retail transactions processed through the National Retail Solutions (NRS) point-of-sale (POS) platform, today announced comparative same-store sales results for August 2024.
As of August 31, 2024, the NRS retail network comprised approximately 32,300 active terminals nationwide, scanning purchases at independent retailers including bodegas, convenience stores, liquor stores, grocers, tobacco, and sundries sellers nationwide, predominantly serving urban consumers.
August Retail Same-Store Sales Highlights
(Same-store sales, unit sales, transactions, and average price data throughout this release refer to August 2024 and are compared to August 2023 unless otherwise noted. All comparisons are provided on a “per calendar day” basis to remove from consideration variability in the number of days per month.)
- SALES

- Same-store sales increased
5.1% year-over-year. In the previous month (July 2024), same-store sales had increased1.2% year-over-year. - Same-store sales increased
1.7% compared to the previous month (July 2024). Same-store sales in July 2024 had decreased (1.9)% compared to the previous month (June 2024). - For the three months ended August 31, 2024, same-store sales increased
3.2% compared to the same three months a year ago.
- Same-store sales increased
- UNITS SOLD
- The number of units sold increased
4.7% year-over-year. In the previous month (July 2024), the number of items sold had increased2.2% year-over-year. - Units sold increased
1.3% compared to the previous month (July 2024). Units sold in July 2024 had decreased (1.7)% compared to the previous month (June 2024).
- The number of units sold increased
- TRANSACTIONS PER STORE
- The average number of transactions per store increased
1.8% year-over-year. In the previous month (July 2024), transactions decreased (0.6)% year-over-year. - Transactions increased
1.5% compared to the previous month (July 2024). Transactions in July 2024 had decreased (1.9)% compared to the previous month (June 2024).
- The average number of transactions per store increased
- AVERAGE PRICES
- A dollar-weighted average of prices for the top 500 items purchased during August 2024 increased
3.5% year-over-year, an increase from the2.5% year-over-year increase recorded in July 2024.
- A dollar-weighted average of prices for the top 500 items purchased during August 2024 increased
Retail Trade Comparative Data
The table below provides historical comparative data with the U.S. Commerce Department’s Advance Monthly Retail Trade same-store sales data excluding food service:
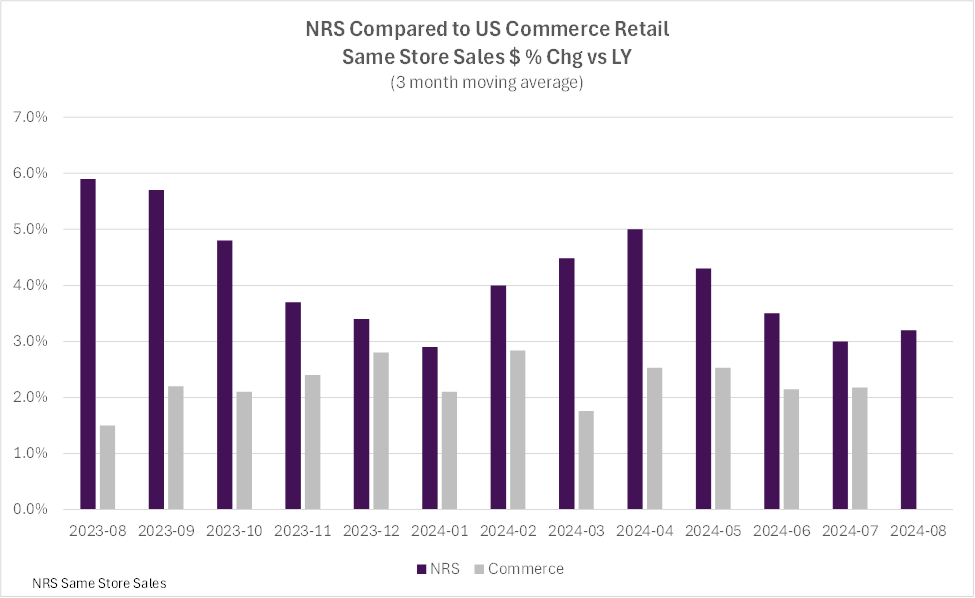
Over the past twelve months, the NRS network’s three-month moving average same-store sales have outpaced the US Commerce Department’s Advance Monthly Retail Trade data, excluding food services, by
The NRSInsights data in the chart above have not been adjusted to reflect inflation, demographic distributions, seasonal buying patterns, item substitution, days per month, or other factors that may facilitate comparisons to other periods, to other same-store retail sales data, or to the U.S. Commerce Department’s retail data.
Commentary from Suzy Silliman (SVP, Data Strategy and Sales at NRS)
“NRS’ year over year rate of same-store sales growth jumped to
“August is back-to-school month for many universities and K-12 districts. We saw not only the expected sales growth versus July but also a robust increase versus August 2023, most notably in school-related categories including Office Supply, Writing Tools, and Computer/Printer accessories.
“Cookie Snacks and Variety Packs, convenient options for school lunches, also realized strong year-over-year growth, as did sales of Baking Staples, Extracts/Herbs/Spices/Seasoning, Baking Mixes and Baking Supplies.
“On the other hand, sales of the Candy/Gum/Mints and Sweet Snacks categories continued to decline year-over-year.
“While our measure of inflationary pressure increased in August for the second consecutive month, rising to
NRSInsights Reports
The NRSInsights monthly Same-Store Retail Sales Reports are intended to provide timely topline data reflective of sales at NRS’ network of independent, predominantly urban, retail stores.
Same-store data comparisons of August 2024 with August 2023 are derived from approximately 196 million transactions processed through the approximately 19,100 stores on the NRS network that scanned transactions in both months. Same-store data comparisons of August 2024 with July 2024 are derived from approximately 253 million transactions processed through approximately 27,000 stores.
Same-store data comparisons for the three months ended August 31, 2024 with the year-ago three months are derived from approximately 557 million scanned transactions processed through those stores that were in the NRS network in both quarters.
NRS POS Network
The NRS network comprises approximately 32,300 active POS terminals operating in approximately 28,100 independent retail stores. Its platform predominantly serves small-format, independent, retail stores including convenience stores, bodegas, liquor stores, grocers, tobacco, and sundries sellers. The network includes retailers in all 50 states as well as the District of Columbia, and in 200 of the 210 designated market areas (DMAs) in the United States. NRS’ POS terminals processed
About National Retail Solutions (NRS):
National Retail Solutions operates the largest point-of-sale (POS) terminal-based platform and digital payment processing service for independent retailers nationwide. Retailers utilize NRS offerings to process transactions and effectively manage their businesses. Consumer packaged goods (CPG) suppliers, brokers, analytics firms, and advertisers access the terminal’s digital display network to reach these retailers’ predominantly urban, multi-cultural shopper base, and to harness transaction data-based learnings to identify growth opportunities and measure execution and returns on marketing investment. NRS is a subsidiary of IDT Corporation (NYSE: IDT).
All statements above that are not purely about historical facts, including, but not limited to, those in which we use the words “believe,” “anticipate,” “expect,” “plan,” “intend,” “estimate,” “target” and similar expressions, are forward-looking statements within the meaning of the Private Securities Litigation Reform Act of 1995. While these forward-looking statements represent our current judgment of what may happen in the future, actual results may differ materially from the results expressed or implied by these statements due to numerous important factors. Our filings with the SEC provide detailed information on such statements and risks, and should be consulted along with this release. To the extent permitted under applicable law, IDT assumes no obligation to update any forward-looking statements.
NRSInsights Contact:
Suzy Silliman
SVP, Data Strategy and Sales at NRS
National Retail Solutions
suzy.silliman@nrsplus.com
IDT Corporation Contact:
Bill Ulrey
william.ulrey@idt.net
# # #
Attachments
