Laser Photonics Reports Strong Q1 2025 Revenue Growth Driven by Strategic CMS Integration and Multi-Sector Growth
Rhea-AI Summary
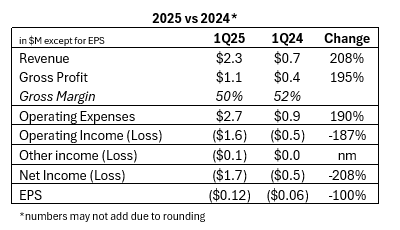
Laser Photonics (NASDAQ:LASE) reported exceptional Q1 2025 results, with revenue surging 208% year-over-year to $2.3 million. The growth was primarily driven by the successful integration of Control Micro Systems (CMS) acquisition and expansion across defense, medical, and industrial sectors.
Key highlights include repeat orders from the U.S. Navy for DefenseTech systems, a fourth CleanTech system order from Acuren, and significant CMS orders in dental and manufacturing applications. The company also demonstrated innovative laser-cleaning robotic crawlers at Pearl Harbor Naval Shipyard, targeting the Navy's $23 billion annual corrosion challenge.
Looking ahead to Q2 2025, LASE expects year-over-year revenue growth compared to Q2 2024's $0.7 million. The company has implemented cost-cutting initiatives aimed at reducing annual expenses by $2 million.
Positive
- Revenue grew 208% year-over-year to $2.3 million in Q1 2025
- Secured repeat orders from U.S. Navy and Acuren, demonstrating strong product validation
- Successfully integrated CMS acquisition, expanding into new market segments
- Implemented cost-cutting measures to reduce annual expenses by $2 million
- Developed innovative laser-cleaning robotic crawler targeting $23B naval maintenance market
Negative
- Company remains in investment phase, indicating continued expenses for growth
- Still working towards achieving sustainable profitability
News Market Reaction – LASE
In the trading session that priced this news, LASE gained 21.34%, reflecting a significant positive market reaction.
Data tracked by StockTitan Argus on the day of publication.
AI-generated analysis. How Rhea-AI works. Not financial advice.
Revenue Surges
Cost cutting initiatives to reduce run rate expenses by
ORLANDO, FLORIDA / ACCESS Newswire / July 7, 2025 / Laser Photonics Corporation (NASDAQ:LASE), ("Laser Photonics" or "the Company") $LASE, a leading global developer of CleanTech laser systems for laser cleaning and other material applications, today announced results for its first quarter ended March 31, 2025.
Wayne Tupuola, CEO of Laser Photonics, commented:
"The first quarter demonstrated the potential of our strategic transformation, with revenue growth of over
"We're particularly excited about the medium- to long-term potential of our strategic partnerships, including the revolutionary laser-enabled robotic crawler demonstrated with Boston Engineering at Pearl Harbor Naval Shipyard. This breakthrough technology addresses the Navy's
Carlos Sardinas, Chief Financial Officer of Laser Photonics, added:
"Our first quarter results reflect the successful progress we've made to date on the integration of CMS and the revenue growth opportunities this acquisition has created. While, as a company, we're in an investment phase to capture the significant market potential ahead of us, we remain focused on improving operational efficiency and the path to sustainable profitability."
Business Highlights
DefenseTech: Building on strong Q4 2024 momentum, Laser Photonics secured additional orders from the U.S. Navy through distribution partner Incredible Supply & Logistics (ISL). The repeat order for the DefenseTech MRLS Portable Finishing Laser (DTMF-1020) handheld cleaning system validates the technology's reliability and effectiveness for naval maintenance applications. Additionally, the Company's strategic partnership with Boston Engineering showcased revolutionary laser-cleaning-enabled robotic crawlers at Pearl Harbor Naval Shipyard, demonstrating transformational potential for naval MRO processes.
CleanTech Industrial: Laser Photonics secured its fourth CleanTech system order from Acuren, a leading provider of asset protection services. The Company also received repeat orders from Bruce Power for additional CleanTech 500-CTHD laser cleaning systems for use at North America's largest operational nuclear power plant, highlighting the safety and environmental advantages of laser cleaning technology in critical infrastructure applications.
Medical and Precision Manufacturing: CMS continued to demonstrate strong market traction with significant orders from a prominent global dental implant provider for robotic-feed dental drill bit marking systems and a leading U.S. high-performance bicycle manufacturer for advanced laser engraving systems. These wins highlight CMS's technological prowess in precision applications and the strategic value of the acquisition in expanding Laser Photonics' addressable markets.
2nd Quarter 2025 Outlook
Laser Photonics entered the second quarter of 2025, which ended June 30, 2025, with strong momentum and expects to report year-over-year revenue growth from the
About Laser Photonics Corporation
Laser Photonics is a vertically integrated manufacturer and R&D Center of Excellence for industrial laser technologies and systems. Laser Photonics seeks to disrupt the
Cautionary Note Concerning Forward-Looking Statements
This press release contains "forward-looking statements" (within the meaning of Section 27A of the Securities Act of 1933, as amended, and Section 21E of the Securities Exchange Act of 1934, as amended), including statements regarding the Company's plans, prospects, potential results and use of proceeds. These statements are based on current expectations as of the date of this press release and involve a number of risks and uncertainties, which may cause results and uses of proceeds to differ materially from those indicated by these forward-looking statements. These risks include, without limitation, those described under the caption "Risk Factors" in the Registration Statement. Any reader of this press release is cautioned not to place undue reliance on these forward-looking statements, which speak only as of the date of this press release. The Company undertakes no obligation to revise or update any forward-looking statements to reflect events or circumstances after the date of this press release except as required by applicable laws or regulations.
Laser Photonics Investor Relations Contact:
Brian Siegel, IRC, MBA
Senior Managing Director
Hayden IR
(346) 396-8696
laser@haydenir.com
CONDENSED CONSOLIDATED BALANCE SHEETS
(in thousands, except par value data)
(unaudited)
As of March 31, 2025 (Unaudited) | As of December 31, 2024 (Audited) | |||||||
Assets | ||||||||
Current Assets: | ||||||||
Cash and Cash Equivalents | $ | 179,091 | $ | 533,871 | ||||
Accounts Receivable, Net | 904,155 | 973,605 | ||||||
Accounts Receivable | - | - | ||||||
Contract Assets | 639,108 | 759,658 | ||||||
Inventory | 2,001,760 | 2,338,759 | ||||||
Other Assets | 271,813 | 58,567 | ||||||
Total Current Assets | 3,995,927 | 4,664,460 | ||||||
Property, Plant, & Equipment, Net | 1,780,036 | 1,872,034 | ||||||
Intangible Assets, Net | 5,350,900 | 5,458,522 | ||||||
Other Long Term Assets | 316,378 | 316,378 | ||||||
Operating Lease Right-of-Use Asset | 4,592,058 | 4,840,753 | ||||||
Total Assets | $ | 16,035,299 | $ | 17,152,147 | ||||
Liabilities & Stockholders' Equity | ||||||||
Current Liabilities: | ||||||||
Accounts Payable | $ | 1,211,407 | $ | 531,268 | ||||
Account payable related parties | 80,771 | 27,988 | ||||||
Short term loan | 825,000 | - | ||||||
Account payable | 27,988 | |||||||
Deferred Revenue | 470,493 | 55,383 | ||||||
Contract Liabilities | 1,337,963 | 1,042,090 | ||||||
Current Portion of Operating Lease | 472,882 | 649,989 | ||||||
Accrued Expenses | 474,189 | 266,717 | ||||||
Total Current Liabilities | 4,872,705 | 2,573,435 | ||||||
Long Term Liabilities: | ||||||||
Lease liability - less current | 4,314,889 | 4,366,419 | ||||||
Total Long Term Liabilities | 4,314,889 | 4,366,419 | ||||||
Total Liabilities | 9,187,594 | 6,939,854 | ||||||
Stockholders' Equity: | ||||||||
Preferred stock Par value | - | - | ||||||
Common Stock Par Value | 14,276 | 14,257 | ||||||
Additional Paid in Capital | 16,302,275 | 17,886,159 | ||||||
Retained Earnings (Deficit) | (9,435,036 | ) | (7,754,313 | ) | ||||
Shares to be issued | - | 100,000 | ||||||
Treasury Stock | (33,810 | ) | (33,810 | ) | ||||
Total Stockholders' Equity | 6,847,705 | 10,212,293 | ||||||
Total Liabilities & Stockholders' Equity | $ | 16,035,299 | $ | 17,152,147 | ||||
STATEMENTS OF PROFIT AND LOSS
(in thousands, except per share data)
(unaudited)
March 31, 2025 | March 31, 2024 | |||||||
Net Sales | $ | 2,290,282 | $ | 742,991 | ||||
Cost of Sales | 1,150,516 | 357,123 | ||||||
Gross Profit | 1,139,766 | 385,868 | ||||||
Operating Expenses: | ||||||||
Sales & Marketing | 617,699 | 136,610 | ||||||
General & Administrative | 900,034 | 356,265 | ||||||
Depreciation & Amortization | 237,011 | 185,316 | ||||||
Payroll Expenses | 840,861 | 208,455 | ||||||
Research and Development Cost | 116,686 | 47,691 | ||||||
Total Operating Expenses | 2,712,291 | 934,337 | ||||||
Operating Income (Loss) | (1,572,525 | ) | (548,469 | ) | ||||
Other Income (Expenses): | ||||||||
Other Income | 1,451 | 30 | ||||||
Other Expenses | (109,649 | ) | 2,730 | |||||
Total Other Income (Loss) | (108,198 | ) | 2,760 | |||||
Income (Loss) Before Tax | (1,680,723 | ) | (545,709 | ) | ||||
Tax Provision | - | - | ||||||
Net Income (Loss) | $ | (1,680,723 | ) | $ | (545,709 | ) | ||
Loss per Share: | ||||||||
Basic | $ | (0.12 | ) | $ | (0.06 | ) | ||
Fully diluted | $ | (0.12 | ) | $ | (0.06 | ) | ||
WASO | 14,271,581 | 9,234,650 | ||||||
Statement of Cash Flows
(in thousands)
(unaudited)
Quarter Ended March 31 | ||||||||
2025 | 2024 | |||||||
OPERATING ACTIVITIES | ||||||||
Net Loss/Gain | $ | (1,680,723 | ) | (545,709 | ) | |||
Adjustments to Reconcile Net Loss to Net Cash Flow from Operating Activities: | ||||||||
Bad Debt | 10,651 | - | ||||||
Shares issued for compensation | 33,336 | |||||||
Distribution to affiliate | (1,683,865 | ) | (1,019,687 | ) | ||||
Impairment | - | |||||||
Depreciation & Amortization | 237,011 | 185,316 | ||||||
Net Change, Right-of-Use Asset & Liabilities | 20,059 | - | ||||||
Change in Operating Assets & Liabilities: | ||||||||
Accounts Receivable | 58,800 | 373,055 | ||||||
Contract Assets | 120,550 | - | ||||||
Inventory | 322,167 | 110,816 | ||||||
Prepaids & Other Current Assets | (213,247 | ) | (75,565 | ) | ||||
Accounts Payable | 732,922 | 83,261 | ||||||
Contract Liabilities | 295,873 | |||||||
Accrued Expenses | 207,475 | (82,531 | ) | |||||
Deferred Revenue | 415,107 | 71,452 | ||||||
Net Cash Used in Operating Activities | (1,157,220 | ) | (866,256 | ) | ||||
INVESTING ACTIVITIES | ||||||||
Purchase of Property, Plant an Equipment | (22,560 | ) | (161,755 | ) | ||||
Net Cash Used in Investing Activities | (22,560 | ) | (161,755 | ) | ||||
FINANCING ACTIVITIES | ||||||||
Borrowings on debt | 825,000 | - | ||||||
Net Cash provided by (used in) Financing Activities | 825,000 | - | ||||||
Net Cash Flow for Period | (354,780 | ) | (1,028,011 | ) | ||||
Cash and Cash Equivalents - Beginning of Period | 533,871 | 6,201,137 | ||||||
Cash and Cash Equivalents- End of Period | $ | 179,091 | 5,173,126 | |||||
NON-CASH INVESTING AND FINANCING ACTIVITIES | ||||||||
Shares issued for Investment | 100,000 | - | ||||||
Transfer demo inventory to PPE | 14,833 | - | ||||||
SUPPLEMENTARY CASH FLOW INFORMATION | - | |||||||
Cash Received / Paid During the Period for: | - | |||||||
Income Taxes | - | - | ||||||
Interest | - | - | ||||||
SOURCE: Laser Photonics Corp.
View the original press release on ACCESS Newswire