
SoFi Reports Second Quarter 2026 with Record Net Revenue of $1.2 Billion, Record Member and Product Growth, Net Income of $157 Million
SoFi (NASDAQ: SOFI) reported record Q2 2026 results, with GAAP net revenue of $1.22 billion, up 43% year-over-year, and adjusted net revenue of $1.21 billion, up 40%.




Adjusted Net Revenue up
Adjusted EBITDA up
Total Loan Originations at a record
Member growth up
Product growth up
Cross-buy accelerated, with
Increases 2026 Adjusted Net Revenue Guidance to
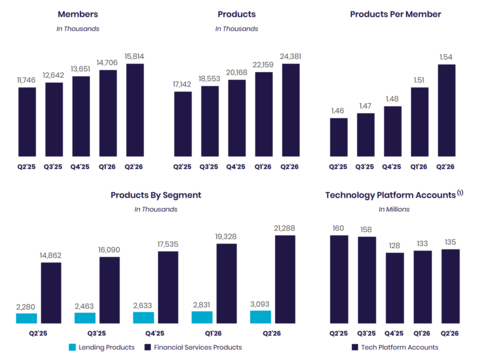
Note: For additional information on our company metrics, including the definitions of "Members", "Total Products" and "Technology Platform Total Accounts", see Table 6 in the “Financial Tables” herein. New member and new product addition metrics for the relevant period reflect actual growth or declines in members and products that occurred in that period whereas the total number of members and products reflects not only the growth or decline of each metric in the current period but also additions or deletions due to prior period factors, if any. (1) The company includes SoFi accounts on the SoFi Tech Solutions platform-as-a-service in its total Technology Platform accounts metric to better align with the presentation of Technology Platform segment revenue.
“2026 is shaping up to be a defining year, and our second quarter results mark a clear inflection point for SoFi,” said Anthony Noto, CEO of SoFi. “Despite continued market uncertainty, our business model continues to prove its durability. We grew members
Consolidated Results Summary
|
|
Three Months Ended
|
|
% Change |
|
Six Months Ended
|
|
% Change |
||||||||||
($ in thousands, except per share amounts) |
|
2026 |
|
2025 |
|
|
2026 |
|
2025 |
|
||||||||
Consolidated – GAAP |
|
|
|
|
|
|
|
|
|
|
|
|
||||||
Total net revenue |
|
$ |
1,218,676 |
|
$ |
854,944 |
|
43 |
% |
|
$ |
2,319,044 |
|
$ |
1,626,703 |
|
43 |
% |
Net income |
|
|
156,592 |
|
|
97,263 |
|
61 |
% |
|
|
323,323 |
|
|
168,379 |
|
92 |
% |
Net income attributable to common stockholders – diluted |
|
|
156,645 |
|
|
97,614 |
|
60 |
% |
|
|
323,720 |
|
|
169,069 |
|
91 |
% |
Earnings per share attributable to common stockholders – diluted |
|
$ |
0.12 |
|
$ |
0.08 |
|
50 |
% |
|
$ |
0.24 |
|
$ |
0.14 |
|
71 |
% |
Consolidated – Non-GAAP(1) |
|
|
|
|
|
|
|
|
|
|
|
|
||||||
Adjusted net revenue |
|
$ |
1,205,550 |
|
$ |
858,230 |
|
40 |
% |
|
$ |
2,292,782 |
|
$ |
1,628,950 |
|
41 |
% |
Adjusted EBITDA |
|
|
357,821 |
|
|
249,083 |
|
44 |
% |
|
|
697,722 |
|
|
459,420 |
|
52 |
% |
Adjusted net income |
|
|
160,406 |
|
|
97,263 |
|
65 |
% |
|
|
327,137 |
|
|
168,379 |
|
94 |
% |
Adjusted net income attributable to common stockholders – diluted |
|
|
160,459 |
|
|
97,614 |
|
64 |
% |
|
|
327,534 |
|
|
169,069 |
|
94 |
% |
Adjusted earnings per share – diluted |
|
$ |
0.12 |
|
$ |
0.08 |
|
50 |
% |
|
$ |
0.24 |
|
$ |
0.15 |
|
60 |
% |
| ____________________ | ||
(1) |
For more information and reconciliations of these non-GAAP measures to the most comparable GAAP measures, see “Non-GAAP Financial Measures” and Table 2 to the “Financial Tables” herein. |
|
Product Highlights
-
Driving Record Member and Product Growth. SoFi grew members
35% year-over-year to 15.8 million and products42% year-over-year to 24.4 million. The company added 1.1 million new members during the quarter, bringing total members to 15.8 million, and added a record 2.2 million new products, marking the first time SoFi added twice as many products as members in a single quarter, and reflecting the increasing engagement of existing members. Products per member reached an all-time high of 1.54. -
Accelerating Cross-Buy and Demonstrating the Financial Services Productivity Loop. Cross-buy continued to accelerate, with
51% of new products opened by existing SoFi members, up from43% last quarter and35% in Q2 2025. Along with record product additions, the company saw a clear inflection point in products per member, driven by SoFi Plus and the increased awareness of the breadth of SoFi's product offering. These results demonstrate the increasing effectiveness of SoFi's Financial Services Productivity Loop in driving member engagement and product adoption. -
Delivering Durable Growth and Strong Returns at Scale. SoFi delivered adjusted net revenue of
$1.2 billion 40% year-over-year, and adjusted EBITDA of$357.8 million 44% year-over-year, with a30% adjusted EBITDA margin. The quarter marked SoFi’s 19th consecutive quarter achieving the Rule of 40, with a score of 70. -
Deepening Member Relationships Through SoFi Plus and SoFi Coach. SoFi surpassed 200,000 paid SoFi Plus subscribers after relaunching the premium membership offering with enhanced benefits and transitioning it to a paid subscription model. Among existing members who signed up for SoFi Plus,
25% added another product after adding SoFi Plus. SoFi Coach became the first GenAI Smart Financial Guide launched by a financial institution and has already generated nearly half-a-million conversations with over90% positive feedback. Together, these products are strengthening member engagement, increasing lifetime value and demonstrating the Financial Services Productivity Loop in action. -
Achieving Record Loan Originations While Maintaining Strong Credit Performance. SoFi delivered its best quarter ever for total loan originations at
$14.8 billion $2.6 billion $10.7 billion $3.1 billion - Expanding Innovation Across Enterprise and Consumer Financial Services. During the quarter, SoFi expanded its platform across investing, lending and enterprise financial services. Consumer innovation included the launch of Composer by SoFi, an AI-powered investing platform, Small Business Loans (“SMB”), and a redesigned Home Equity Line of Credit experience. On the enterprise side, Big Business Banking began processing transactions on the SoFi Exchange Network, enabling commercial clients to move money in real time, 24/7 through SoFiUSD, while the acquisition of Peach Finance further strengthened SoFi Tech Solutions' lending capabilities.
-
Strengthening Brand Awareness and Trust. SoFi’s unaided brand awareness rose to an all-time high of
10.4% , up 190 basis points year-over-year. During the quarter, SoFi continued to build brand momentum through major cultural and sports moments, including CMA Fest presented by SoFi, FIFA World Cup matches at SoFi Stadium and a multi-year partnership with Notre Dame Athletics, making SoFi the first brand to appear on Fighting Irish jerseys.
Consolidated Results
SoFi reported a number of record financial achievements. For the second quarter of 2026, record GAAP net revenue of
For the second quarter of 2026, total fee-based revenue reached
Net interest income of
During the quarter, average total deposits comprised over
Second quarter record adjusted EBITDA of
For the second quarter of 2026, GAAP net income reached
Equity grew by
Member and Product Growth
Continued growth in both total members and products in the second quarter is the result of our continued investments in innovation and brand building and reflects the benefits of our broad product suite and unique Financial Services Productivity Loop (FSPL) strategy.
SoFi added a record 1.1 million members in the second quarter of 2026, bringing total members to 15.8 million, up
SoFi also achieved record product additions of 2.2 million in the second quarter of 2026, bringing total products to nearly 24.4 million, up
Financial Services products increased by
Lending products increased by
Technology Platform-enabled accounts decreased
Financial Services Segment Results
For the second quarter of 2026, Financial Services segment net revenue of
In the second quarter, SoFi's Loan Platform Business added
In addition to our Loan Platform Business, SoFi continued to see healthy growth in interchange fee revenue and brokerage fee revenue. In the second quarter, interchange fee revenue was up
Contribution profit for the second quarter of 2026 reached
Financial Services – Segment Results of Operations |
||||||||||||||||||||||
|
|
Three Months Ended
|
|
|
|
Six Months Ended
|
|
|
||||||||||||||
($ in thousands) |
|
2026 |
|
2025 |
|
% Change |
|
2026 |
|
2025 |
|
% Change |
||||||||||
Net interest income |
|
$ |
249,052 |
|
|
$ |
193,322 |
|
|
29 |
% |
|
$ |
476,792 |
|
|
$ |
366,521 |
|
|
30 |
% |
Noninterest income |
|
|
217,226 |
|
|
|
169,211 |
|
|
28 |
% |
|
|
418,029 |
|
|
|
299,131 |
|
|
40 |
% |
Total net revenue – Financial Services |
|
|
466,278 |
|
|
|
362,533 |
|
|
29 |
% |
|
|
894,821 |
|
|
|
665,652 |
|
|
34 |
% |
Provision for credit losses |
|
|
(13,756 |
) |
|
|
(10,031 |
) |
|
37 |
% |
|
|
(22,646 |
) |
|
|
(15,670 |
) |
|
45 |
% |
Directly attributable expenses |
|
|
(239,846 |
) |
|
|
(164,270 |
) |
|
46 |
% |
|
|
(463,915 |
) |
|
|
(313,418 |
) |
|
48 |
% |
Contribution profit – Financial Services |
|
$ |
212,676 |
|
|
$ |
188,232 |
|
|
13 |
% |
|
$ |
408,260 |
|
|
$ |
336,564 |
|
|
21 |
% |
Contribution margin – Financial Services(1) |
|
|
46 |
% |
|
|
52 |
% |
|
|
|
|
46 |
% |
|
|
51 |
% |
|
|
||
| ____________________ | ||
(1) |
Contribution margin is defined for each of our reportable segments as contribution profit divided by net revenue. |
|
By continuously innovating with new and relevant offerings, features and rewards for members, SoFi grew total Financial Services products by 6.4 million, or
In the second quarter of 2026, total deposits grew
Financial Services – Products |
|
June 30, |
|
|
|||||
|
|
2026 |
|
2025 |
|
% Change |
|||
Money(1) |
|
7,888,387 |
|
5,887,669 |
|
34 |
% |
||
Invest(2) |
|
3,931,718 |
|
|
2,853,416 |
|
|
38 |
% |
Credit Card(3) |
|
509,825 |
|
|
344,469 |
|
|
48 |
% |
Referred loans(4) |
|
180,443 |
|
|
122,580 |
|
|
47 |
% |
Crypto(5) |
|
388,336 |
|
|
— |
|
|
n/m |
|
SoFi Plus(3) |
|
206,000 |
|
|
— |
|
|
n/m |
|
At Work |
|
189,078 |
|
|
127,224 |
|
|
49 |
% |
Relay |
|
7,993,828 |
|
|
5,526,315 |
|
|
45 |
% |
Total financial services products |
|
21,287,615 |
|
|
14,861,673 |
|
|
43 |
% |
| ____________________ | ||
(1) |
Includes checking and savings accounts held at SoFi Bank, and cash management accounts. |
|
(2) |
Beginning in the first quarter of 2026, we updated our SoFi Invest product metric to reflect four products. Prior to this, our SoFi Invest service was composed of two products, self-directed accounts and robo-advisory accounts. Self-directed accounts were previously referred to as active investing accounts. The impact to prior periods was determined to be immaterial, and prior periods were not recast. |
|
(3) |
Beginning in the second quarter of 2026, we updated our Financial Services products to include (i) SoFi Plus, which we relaunched during the quarter with significantly enhanced benefits, while fully transitioning the product to a paid subscription model; and (ii) Smart Card, our recently launched secured card (presented above within Credit Card). The impact to prior periods was determined to be immaterial, and prior periods were not recast. |
|
(4) |
Limited to loans wherein we provide third party fulfillment services as part of our Loan Platform Business. |
|
(5) |
During the fourth quarter of 2025, we returned to crypto investing with the launch of SoFi Crypto. |
|
|
|
|
Technology Platform Segment Results
Technology Platform segment net revenue of
Technology Platform – Segment Results of Operations |
||||||||||||||||||||||
|
|
Three Months Ended
|
|
|
|
Six Months Ended
|
|
|
||||||||||||||
($ in thousands) |
|
2026 |
|
2025 |
|
% Change |
|
2026 |
|
2025 |
|
% Change |
||||||||||
Net interest income |
|
$ |
1,022 |
|
|
$ |
266 |
|
|
284 |
% |
|
$ |
1,377 |
|
|
$ |
679 |
|
|
103 |
% |
Noninterest income |
|
|
83,483 |
|
|
|
109,567 |
|
|
(24 |
)% |
|
|
158,214 |
|
|
|
212,581 |
|
|
(26 |
)% |
Total net revenue – Technology Platform |
|
|
84,505 |
|
|
|
109,833 |
|
|
(23 |
)% |
|
|
159,591 |
|
|
|
213,260 |
|
|
(25 |
)% |
Directly attributable expenses |
|
|
(72,733 |
) |
|
|
(76,638 |
) |
|
(5 |
)% |
|
|
(135,820 |
) |
|
|
(149,152 |
) |
|
(9 |
)% |
Contribution profit |
|
$ |
11,772 |
|
|
$ |
33,195 |
|
|
(65 |
)% |
|
$ |
23,771 |
|
|
$ |
64,108 |
|
|
(63 |
)% |
Contribution margin – Technology Platform(1) |
|
|
14 |
% |
|
|
30 |
% |
|
|
|
|
15 |
% |
|
|
30 |
% |
|
|
||
| ____________________ | ||
(1) |
Contribution margin is defined for each of our reportable segments as contribution profit divided by net revenue. |
|
Technology Platform enabled accounts increased 2 million from the prior quarter. Technology Platform-enabled accounts decreased
During the second quarter, SoFi launched a new unified brand, SoFi Tech Solutions, offering enterprise clients products and services across one integrated platform serving four key areas: Processing, Banking Core Ledgers & Services, Payment Hub, and Risk & Fraud. SoFi also added new platform capabilities across credit cards, lines of credit, buy now, pay later, and installment lending.
Technology Platform |
|
June 30, |
|
|
|||||
|
|
2026 |
|
2025 |
|
% Change |
|||
Total accounts |
|
134,804,238 |
|
160,046,369 |
|
(16 |
)% |
||
Lending Segment Results
For the second quarter of 2026, Lending segment GAAP net revenue of
Lending segment performance in the second quarter was driven by net interest income, which rose
Lending segment second quarter contribution profit of
Lending – Segment Results of Operations |
||||||||||||||||||||||
|
|
Three Months Ended
|
|
|
|
Six Months Ended
|
|
|
||||||||||||||
($ in thousands) |
|
2026 |
|
2025 |
|
% Change |
|
2026 |
|
2025 |
|
% Change |
||||||||||
Net interest income |
|
$ |
573,298 |
|
|
$ |
372,675 |
|
|
54 |
% |
|
$ |
1,073,529 |
|
|
$ |
733,296 |
|
|
46 |
% |
Noninterest income |
|
|
151,500 |
|
|
|
70,837 |
|
|
114 |
% |
|
|
293,689 |
|
|
|
123,589 |
|
|
138 |
% |
Total net revenue – Lending |
|
|
724,798 |
|
|
|
443,512 |
|
|
63 |
% |
|
|
1,367,218 |
|
|
|
856,885 |
|
|
60 |
% |
Servicing rights – change in valuation inputs or assumptions |
|
|
(13,142 |
) |
|
|
3,274 |
|
|
n/m |
|
|
|
(26,305 |
) |
|
|
2,200 |
|
|
n/m |
|
Residual interests classified as debt – change in valuation inputs or assumptions |
|
|
16 |
|
|
|
12 |
|
|
33 |
% |
|
|
43 |
|
|
|
47 |
|
|
(9 |
)% |
Directly attributable expenses |
|
|
(312,639 |
) |
|
|
(202,088 |
) |
|
55 |
% |
|
|
(559,537 |
) |
|
|
(375,487 |
) |
|
49 |
% |
Contribution profit – Lending |
|
$ |
399,033 |
|
|
$ |
244,710 |
|
|
63 |
% |
|
$ |
781,419 |
|
|
$ |
483,645 |
|
|
62 |
% |
Contribution margin – Lending(1) |
|
|
55 |
% |
|
|
55 |
% |
|
|
|
|
57 |
% |
|
|
56 |
% |
|
|
||
|
|
|
|
|
|
|
|
|
|
|
|
|
||||||||||
Adjusted net revenue – Lending (non-GAAP)(2) |
|
$ |
711,672 |
|
|
$ |
446,798 |
|
|
59 |
% |
|
$ |
1,340,956 |
|
|
$ |
859,132 |
|
|
56 |
% |
Adjusted contribution margin – Lending (non-GAAP)(2) |
|
|
56 |
% |
|
|
55 |
% |
|
|
|
|
58 |
% |
|
|
56 |
% |
|
|
||
| ____________________ | ||
(1) |
Contribution margin is defined for each of our reportable segments as contribution profit divided by net revenue. |
|
(2) |
For more information and a reconciliation of these non-GAAP financial measures to the most comparable GAAP measure, see “Non-GAAP Financial Measures” and Table 2 to the “Financial Tables” herein. |
|
Lending – Loans At Fair Value |
|
|
|
|
|
|
|
|||||||||
($ in thousands) |
Personal Loans |
|
Student Loans |
|
Home Loans |
|
Total |
|||||||||
June 30, 2026 |
|
|
|
|
|
|
|
|||||||||
Unpaid principal |
$ |
26,101,759 |
|
|
$ |
16,134,415 |
|
|
$ |
2,067,122 |
|
|
$ |
44,303,296 |
|
|
Accumulated interest |
|
180,704 |
|
|
|
81,501 |
|
|
|
9,450 |
|
|
|
271,655 |
|
|
Cumulative fair value adjustments(1) |
|
1,222,827 |
|
|
|
704,648 |
|
|
|
99,586 |
|
|
|
2,027,061 |
|
|
Total fair value of loans(2)(3) |
$ |
27,505,290 |
|
|
$ |
16,920,564 |
|
|
$ |
2,176,158 |
|
|
$ |
46,602,012 |
|
|
March 31, 2026 |
|
|
|
|
|
|
|
|||||||||
Unpaid principal |
$ |
22,317,947 |
|
|
$ |
14,510,630 |
|
|
$ |
1,562,339 |
|
|
$ |
38,390,916 |
|
|
Accumulated interest |
|
161,450 |
|
|
|
69,285 |
|
|
|
6,945 |
|
|
|
237,680 |
|
|
Cumulative fair value adjustments(1) |
|
1,203,024 |
|
|
|
756,905 |
|
|
|
78,724 |
|
|
|
2,038,653 |
|
|
Total fair value of loans(2)(3) |
$ |
23,682,421 |
|
|
$ |
15,336,820 |
|
|
$ |
1,648,008 |
|
|
$ |
40,667,249 |
|
|
| ____________________ | ||
(1) |
During the three months ended June 30, 2026, the cumulative fair value adjustments for personal loans were impacted by a higher unpaid principal balance, offset by a higher weighted average conditional prepayment rate, a higher weighted average discount rate, lower weighted average coupon, and a higher weighted average annual default rate. The higher discount rate was primarily driven by a 37 basis point increase in benchmark rates. The cumulative fair value adjustments for student loans were impacted by a higher unpaid principal balance and a lower weighted average conditional prepayment rate, partially offset by a lower weighted average coupon, higher weighted average discount rate, and higher weighted average default rate. |
|
(2) |
Each component of the fair value of loans is impacted by charge-offs during the period. Our fair value assumption for annual default rate incorporates fair value markdowns on loans beginning when they are 10 days or more delinquent, with additional markdowns at 30, 60 and 90 days past due. |
|
(3) |
Student loans are classified as loans held for investment, and personal loans and home loans are classified as loans held for sale. |
|
The following table summarizes the significant inputs to the fair value model for personal and student loans:
|
Personal Loans |
|
Student Loans |
|||||||||
|
June 30, 2026 |
|
March 31, 2026 |
|
June 30, 2026 |
|
March 31, 2026 |
|||||
Weighted average coupon rate(1) |
12.89 |
% |
|
12.96 |
% |
|
5.89 |
% |
|
5.91 |
% |
|
Weighted average annual default rate |
4.77 |
% |
|
4.57 |
% |
|
0.73 |
% |
|
0.69 |
% |
|
Weighted average conditional prepayment rate |
25.77 |
% |
|
25.55 |
% |
|
10.99 |
% |
|
11.15 |
% |
|
Weighted average discount rate |
4.97 |
% |
|
4.61 |
% |
|
4.29 |
% |
|
4.05 |
% |
|
Benchmark rate(2) |
3.99 |
% |
|
3.62 |
% |
|
3.90 |
% |
|
3.59 |
% |
|
| ____________________ | ||
(1) |
Represents the average coupon rate on loans held on balance sheet, weighted by unpaid principal balance outstanding at the balance sheet date. |
|
(2) |
Corresponds with two-year SOFR for personal loans, and four-year SOFR for student loans. |
|
For the second quarter of 2026, record origination volume of
Record personal loan originations of
Second quarter student loan volume of
Home loan volume was
Capital markets activity in the second quarter of 2026 was strong. Overall, SoFi sold, or transferred through our Loan Platform Business, more than
During the quarter, SoFi executed two co-contributor securitizations of loans previously originated through our Loan Platform Business, totaling
Credit performance for personal loans remained strong in the second quarter, in line with expectations. Excluding the impact of late stage delinquent loan sales, it is estimated that, including recoveries, the all-in annualized net charge-off rate for personal loans would have been approximately
The personal loan annualized charge-off rate decreased 21 basis points year-over-year to
The on-balance sheet 90-day delinquency rates for both personal loans and student loans were consistent with the prior year.
The data continues to support a 7–
Recent vintages, originated from the fourth quarter of 2022 to third quarter of 2025 have net cumulative losses of
Additionally, of the first quarter of 2020 through the first quarter of 2026 originations,
Lending – Originations and Average Balances |
||||||||||||||||||||||
|
|
Three Months Ended
|
|
% Change |
|
Six Months Ended
|
|
% Change |
||||||||||||||
|
|
2026 |
|
2025 |
|
|
2026 |
|
2025 |
|
||||||||||||
Origination volume ($ in thousands, during period) |
|
|
|
|
|
|
|
|
|
|
|
|
||||||||||
Personal loans(1) |
|
$ |
10,718,359 |
|
|
$ |
6,968,746 |
|
|
54 |
% |
|
$ |
19,058,608 |
|
|
$ |
12,505,587 |
|
|
52 |
% |
Student loans |
|
|
2,686,760 |
|
|
|
993,326 |
|
|
170 |
% |
|
|
5,300,468 |
|
|
|
2,184,789 |
|
|
143 |
% |
Home loans |
|
|
1,393,375 |
|
|
|
798,881 |
|
|
74 |
% |
|
|
2,618,049 |
|
|
|
1,316,639 |
|
|
99 |
% |
Total |
|
$ |
14,798,494 |
|
|
$ |
8,760,953 |
|
|
69 |
% |
|
$ |
26,977,125 |
|
|
$ |
16,007,015 |
|
|
69 |
% |
Average loan balance ($, as of period end)(2) |
|
|
|
|
|
|
|
|
|
|
|
|
||||||||||
Personal loans |
|
$ |
25,361 |
|
|
$ |
25,758 |
|
|
(2 |
)% |
|
|
|
|
|
|
|||||
Student loans |
|
|
45,905 |
|
|
|
43,209 |
|
|
6 |
% |
|
|
|
|
|
|
|||||
Home loans |
|
|
232,271 |
|
|
|
270,540 |
|
|
(14 |
)% |
|
|
|
|
|
|
|||||
| ____________________ | ||
(1) |
Inclusive of origination volume related to our Loan Platform Business. |
|
(2) |
Within each loan product category, average loan balance is defined as the total unpaid principal balance of the loans divided by the number of loans that have a balance greater than zero dollars as of the reporting date. Average loan balance includes loans on our balance sheet, as well as transferred loans and referred loans with which SoFi has continuing involvement through our servicing agreements. |
|
Lending – Products |
|
June 30, |
|
|
|||||
|
|
2026 |
|
2025 |
|
% Change |
|||
Personal loans(1) |
|
2,325,262 |
|
|
1,641,340 |
|
|
42 |
% |
Student loans |
|
703,081 |
|
|
596,351 |
|
|
18 |
% |
Home loans |
|
65,016 |
|
|
42,677 |
|
|
52 |
% |
Total lending products |
|
3,093,359 |
|
|
2,280,368 |
|
|
36 |
% |
| ____________________ | ||
(1) |
Includes loans which we originate as part of our Loan Platform Business. |
|
Guidance and Outlook
For the full year, management increases its revenue outlook. Management now expects to deliver adjusted net revenue of approximately
For 2026, management continues to expect to increase total members by at least
Management will further address guidance on the quarterly earnings conference call. Management has not reconciled forward-looking non-GAAP measures to their most directly comparable GAAP measures. This is because the company cannot predict with reasonable certainty and without unreasonable efforts the ultimate outcome of certain GAAP components of such reconciliations due to market-related assumptions that are not within our control as well as certain legal or advisory costs, tax costs or other costs that may arise. For these reasons, management is unable to assess the probable significance of the unavailable information, which could materially impact the amount of the future directly comparable GAAP measures.
Earnings Webcast
SoFi’s executive management team will host a live audio webcast beginning at 8:00 a.m. Eastern Time (5:00 a.m. Pacific Time) today to discuss the quarter’s financial results and business highlights. All interested parties are invited to listen to the live webcast at https://investors.sofi.com. A replay of the webcast will be available on the SoFi Investor Relations website for 30 days. Investor information, including supplemental financial information, is available on SoFi’s Investor Relations website at https://investors.sofi.com.
Cautionary Statement Regarding Forward-Looking Statements
Certain of the statements above are forward-looking and as such are not historical facts. This includes, without limitation, statements regarding our expectations for the full year 2026 adjusted net revenue, annual growth rate, adjusted EBITDA, adjusted EBITDA margin, adjusted net income, adjusted EPS, and new members, our expectations regarding launching a unified brand across our technology platform businesses, our expectations regarding the revenue diversification benefits of our multichannel personal loan origination and sale strategy, our expectations regarding our ability to continue to grow our business, deliver superior financial returns, build our brand and launch new business lines and products, our ability to continue to drive momentum, deepen member engagement, and increase cross-buy, our expectations regarding the size of our market opportunity, our ability to continue to attract and execute deals, our ability to continue to improve our financials and increase our member, product and total accounts count, our ability to achieve diversified and more durable growth, including our ability to continue to grow our Loan Platform Business, our ability to continue the momentum seen in prior financial periods, our ability to have loss rates below
As a result of a number of known and unknown risks and uncertainties, our actual results or performance may be materially different from those expressed or implied by these forward-looking statements. You should not place undue reliance on these forward-looking statements.
Non-GAAP Financial Measures
This press release presents information about certain non-GAAP financial measures provided as supplements to the results provided in accordance with accounting principles generally accepted in
Reconciliations of these non-GAAP measures to the most directly comparable GAAP financial measures are provided in Table 2 to the “Financial Tables” herein.
About SoFi
SoFi Technologies (NASDAQ: SOFI) is the everything app for digital financial services on a mission to help people achieve financial independence to realize their ambitions. 15.8 million members trust SoFi to borrow, save, spend, invest, and protect their money and buy, sell and hold their crypto – all in one app – and get access to financial planners, exclusive experiences, and a thriving community. Banks, fintechs, and brands use innovative capabilities from SoFi Tech Solutions to serve over 134 million global accounts. For more information, visit www.sofi.com or download our iOS and Android apps.
Availability of Other Information About SoFi
Investors and others should note that we communicate with our investors and the public using our website (https://www.sofi.com), the investor relations website (https://investors.sofi.com), and on social media (X and LinkedIn), including but not limited to investor presentations and investor fact sheets, Securities and Exchange Commission filings, press releases, public conference calls and webcasts. The information that SoFi posts on these channels and websites could be deemed to be material information. As a result, SoFi encourages investors, the media, and others interested in SoFi to review the information that is posted on these channels, including the investor relations website, on a regular basis. This list of channels may be updated from time to time on SoFi’s investor relations website and may include additional social media channels. The contents of SoFi’s website or these channels, or any other website that may be accessed from its website or these channels, shall not be deemed incorporated by reference in any filing under the Securities Act of 1933, as amended.
SOFI-F
FINANCIAL TABLES
(Unaudited)
- Condensed Consolidated Statements of Operations and Comprehensive Income
- Reconciliation of GAAP to Non-GAAP Financial Measures
- Condensed Consolidated Balance Sheets
- Average Balances and Net Interest Earnings Analysis
- Company Metrics
- Segment Financials
- Fee-Based Revenue
- Analysis of Charge-Offs
- Regulatory Capital
Table 1 |
||||||||||||||||
SoFi Technologies, Inc. |
||||||||||||||||
Condensed Consolidated Statements of Operations and Comprehensive Income |
||||||||||||||||
(Unaudited) |
||||||||||||||||
(In Thousands, Except for Per Share Data) |
||||||||||||||||
|
|
|
|
|||||||||||||
|
Three Months Ended
|
|
Six Months Ended
|
|||||||||||||
|
2026 |
|
2025 |
|
2026 |
|
2025 |
|||||||||
Interest income |
|
|
|
|
|
|
|
|||||||||
Loans and securitizations |
$ |
1,067,894 |
|
|
$ |
738,862 |
|
|
$ |
2,000,078 |
|
|
$ |
1,451,738 |
|
|
Other |
|
72,634 |
|
|
|
53,543 |
|
|
|
141,446 |
|
|
|
104,479 |
|
|
Total interest income |
|
1,140,528 |
|
|
|
792,405 |
|
|
|
2,141,524 |
|
|
|
1,556,217 |
|
|
Interest expense |
|
|
|
|
|
|
|
|||||||||
Securitizations and warehouses |
|
18,779 |
|
|
|
29,650 |
|
|
|
28,830 |
|
|
|
57,794 |
|
|
Deposits |
|
320,463 |
|
|
|
233,232 |
|
|
|
607,692 |
|
|
|
458,631 |
|
|
Corporate borrowings |
|
10,675 |
|
|
|
11,504 |
|
|
|
21,326 |
|
|
|
22,932 |
|
|
Other |
|
2,416 |
|
|
|
182 |
|
|
|
2,493 |
|
|
|
297 |
|
|
Total interest expense |
|
352,333 |
|
|
|
274,568 |
|
|
|
660,341 |
|
|
|
539,654 |
|
|
Net interest income |
|
788,195 |
|
|
|
517,837 |
|
|
|
1,481,183 |
|
|
|
1,016,563 |
|
|
Noninterest income |
|
|
|
|
|
|
|
|||||||||
Loan origination, sales, securitizations and servicing |
|
150,407 |
|
|
|
70,855 |
|
|
|
292,616 |
|
|
|
123,660 |
|
|
Technology products and solutions |
|
52,459 |
|
|
|
90,796 |
|
|
|
101,810 |
|
|
|
177,233 |
|
|
Loan platform fees |
|
140,930 |
|
|
|
127,405 |
|
|
|
279,185 |
|
|
|
220,155 |
|
|
Crypto transaction revenue |
|
134,267 |
|
|
|
— |
|
|
|
255,860 |
|
|
|
— |
|
|
Cost of crypto transaction revenue |
|
(133,084 |
) |
|
|
— |
|
|
|
(253,825 |
) |
|
|
— |
|
|
Net crypto transaction revenue |
|
1,183 |
|
|
|
— |
|
|
|
2,035 |
|
|
|
— |
|
|
Other |
|
85,502 |
|
|
|
48,051 |
|
|
|
162,215 |
|
|
|
89,092 |
|
|
Total noninterest income |
|
430,481 |
|
|
|
337,107 |
|
|
|
837,861 |
|
|
|
610,140 |
|
|
Total net revenue |
|
1,218,676 |
|
|
|
854,944 |
|
|
|
2,319,044 |
|
|
|
1,626,703 |
|
|
Provision for credit losses |
|
13,755 |
|
|
|
10,035 |
|
|
|
22,650 |
|
|
|
15,713 |
|
|
Noninterest expense |
|
|
|
|
|
|
|
|||||||||
Technology and product development |
|
191,276 |
|
|
|
152,146 |
|
|
|
378,951 |
|
|
|
308,352 |
|
|
Sales and marketing |
|
392,397 |
|
|
|
264,744 |
|
|
|
727,936 |
|
|
|
502,920 |
|
|
Cost of operations |
|
200,139 |
|
|
|
150,437 |
|
|
|
371,262 |
|
|
|
285,957 |
|
|
General and administrative |
|
216,800 |
|
|
|
165,390 |
|
|
|
414,384 |
|
|
|
321,787 |
|
|
Total noninterest expense |
|
1,000,612 |
|
|
|
732,717 |
|
|
|
1,892,533 |
|
|
|
1,419,016 |
|
|
Income before income taxes |
|
204,309 |
|
|
|
112,192 |
|
|
|
403,861 |
|
|
|
191,974 |
|
|
Income tax expense |
|
(47,717 |
) |
|
|
(14,929 |
) |
|
|
(80,538 |
) |
|
|
(23,595 |
) |
|
Net income |
$ |
156,592 |
|
|
$ |
97,263 |
|
|
$ |
323,323 |
|
|
$ |
168,379 |
|
|
|
|
|
|
|
|
|
|
|||||||||
Earnings per share |
|
|
|
|
|
|
|
|||||||||
Earnings per share – basic |
$ |
0.12 |
|
|
$ |
0.09 |
|
|
$ |
0.25 |
|
|
$ |
0.15 |
|
|
Earnings per share – diluted |
$ |
0.12 |
|
|
$ |
0.08 |
|
|
$ |
0.24 |
|
|
$ |
0.14 |
|
|
Weighted average common stock outstanding – basic |
|
1,284,303 |
|
|
|
1,107,006 |
|
|
|
1,280,338 |
|
|
|
1,102,525 |
|
|
Weighted average common stock outstanding – diluted |
|
1,351,990 |
|
|
|
1,182,877 |
|
|
|
1,364,978 |
|
|
|
1,184,197 |
|
|
Table 2
Non-GAAP Financial Measures
(Unaudited)
Adjusted Net Revenue
Adjusted net revenue is a non-GAAP measure. Adjusted net revenue is defined as total net revenue, adjusted to exclude the fair value changes in servicing rights and residual interests classified as debt due to valuation inputs and assumptions changes, which relate only to our Lending segment, as well as gains and losses on extinguishment of debt. We adjust total net revenue to exclude these items, as they are non-cash charges that are not realized during the period or not indicative of our core operating performance, and therefore positive or negative changes do not impact the cash available to fund our operations. Management believes this measure is useful because it enables management and investors to assess our underlying operating performance and cash available to fund our operations. In addition, management uses this measure to better decide on the proper expenses to authorize for each of our operating segments, to ultimately help achieve target contribution profit margins.
The following table reconciles adjusted net revenue to total net revenue, the most directly comparable GAAP measure:
|
|
Three Months Ended
|
|
Six Months Ended
|
||||||||||||
($ in thousands) |
|
2026 |
|
2025 |
|
2026 |
|
|
2025 |
|||||||
Total net revenue (GAAP) |
|
$ |
1,218,676 |
|
|
$ |
854,944 |
|
|
$ |
2,319,044 |
|
|
$ |
1,626,703 |
|
Servicing rights – change in valuation inputs or assumptions(1) |
|
|
(13,142 |
) |
|
|
3,274 |
|
|
|
(26,305 |
) |
|
|
2,200 |
|
Residual interests classified as debt – change in valuation inputs or assumptions(2) |
|
|
16 |
|
|
|
12 |
|
|
|
43 |
|
|
|
47 |
|
Adjusted net revenue (non-GAAP) |
|
$ |
1,205,550 |
|
|
$ |
858,230 |
|
|
$ |
2,292,782 |
|
|
$ |
1,628,950 |
|
| ____________________ | ||
(1) |
Reflects changes in fair value inputs and assumptions on servicing rights, including conditional prepayment, default rates and discount rates. These assumptions are highly sensitive to market interest rate changes and are not indicative of our performance or results of operations. Moreover, these non-cash charges are unrealized during the period and, therefore, have no impact on our cash flows from operations. |
|
(2) |
Reflects changes in fair value inputs and assumptions on residual interests classified as debt, including conditional prepayment, default rates and discount rates. When third parties finance our consolidated securitization VIEs by purchasing residual interests, we receive proceeds at the time of the closing of the securitization and, thereafter, pass along contractual cash flows to the residual interest owner. These residual debt obligations are measured at fair value on a recurring basis, but they have no impact on our initial financing proceeds, our future obligations to the residual interest owner (because future residual interest claims are limited to contractual securitization collateral cash flows), or the general operations of our business. |
|
The following table reconciles adjusted net revenue for the Lending segment to total net revenue, the most directly comparable GAAP measure for the Lending segment:
|
|
Three Months Ended
|
|
Six Months Ended
|
||||||||||||
($ in thousands) |
|
2026 |
|
2025 |
|
2026 |
|
2025 |
||||||||
Lending |
|
|
|
|
|
|
|
|
||||||||
Total net revenue – Lending (GAAP) |
|
$ |
724,798 |
|
|
$ |
443,512 |
|
|
$ |
1,367,218 |
|
|
$ |
856,885 |
|
Servicing rights – change in valuation inputs or assumptions(1) |
|
|
(13,142 |
) |
|
|
3,274 |
|
|
|
(26,305 |
) |
|
|
2,200 |
|
Residual interests classified as debt – change in valuation inputs or assumptions(2) |
|
|
16 |
|
|
|
12 |
|
|
|
43 |
|
|
|
47 |
|
Adjusted net revenue – Lending (non-GAAP) |
|
$ |
711,672 |
|
|
$ |
446,798 |
|
|
$ |
1,340,956 |
|
|
$ |
859,132 |
|
| ____________________ | ||
(1) |
See footnote (1) to the table above. |
|
(2) |
See footnote (2) to the table above. |
|
Adjusted Noninterest Income
Adjusted noninterest income is a non-GAAP measure. Adjusted noninterest income is defined as noninterest income, adjusted to exclude the fair value changes in servicing rights and residual interests classified as debt due to valuation inputs and assumptions changes, which relate only to our Lending segment, as well as gains and losses on extinguishment of debt. We adjust noninterest income to exclude these items, as they are non-cash charges that are not realized during the period or not indicative of our core operating performance, and therefore positive or negative changes do not impact the cash available to fund our operations. Management believes this measure is useful because it enables management and investors to assess our underlying operating performance and cash available to fund our operations.
The following table reconciles adjusted noninterest income to noninterest income, the most directly comparable GAAP measure:
|
|
Three Months Ended
|
|
Six Months Ended
|
||||||||||||
($ in thousands) |
|
2026 |
|
2025 |
|
2026 |
|
2025 |
||||||||
Noninterest income (GAAP) |
|
$ |
430,481 |
|
|
$ |
337,107 |
|
|
$ |
837,861 |
|
|
$ |
610,140 |
|
Servicing rights – change in valuation inputs or assumptions(1) |
|
|
(13,142 |
) |
|
|
3,274 |
|
|
|
(26,305 |
) |
|
|
2,200 |
|
Residual interests classified as debt – change in valuation inputs or assumptions(2) |
|
|
16 |
|
|
|
12 |
|
|
|
43 |
|
|
|
47 |
|
Adjusted noninterest income (non-GAAP) |
|
$ |
417,355 |
|
|
$ |
340,393 |
|
|
$ |
811,599 |
|
|
$ |
612,387 |
|
| ____________________ | ||
(1) |
Reflects changes in fair value inputs and assumptions on servicing rights, including conditional prepayment, default rates and discount rates. These assumptions are highly sensitive to market interest rate changes and are not indicative of our performance or results of operations. Moreover, these non-cash charges are unrealized during the period and, therefore, have no impact on our cash flows from operations. |
|
(2) |
Reflects changes in fair value inputs and assumptions on residual interests classified as debt, including conditional prepayment, default rates and discount rates. When third parties finance our consolidated securitization VIEs by purchasing residual interests, we receive proceeds at the time of the closing of the securitization and, thereafter, pass along contractual cash flows to the residual interest owner. These residual debt obligations are measured at fair value on a recurring basis, but they have no impact on our initial financing proceeds, our future obligations to the residual interest owner (because future residual interest claims are limited to contractual securitization collateral cash flows), or the general operations of our business. |
|
The following table reconciles adjusted noninterest income for the Lending segment to noninterest income, the most directly comparable GAAP measure for the Lending segment:
|
|
Three Months Ended
|
|
Six Months Ended
|
||||||||||||
($ in thousands) |
|
2026 |
|
2025 |
|
2026 |
|
2025 |
||||||||
Lending |
|
|
|
|
|
|
|
|
||||||||
Noninterest income – Lending (GAAP) |
|
$ |
151,500 |
|
|
$ |
70,837 |
|
|
$ |
293,689 |
|
|
$ |
123,589 |
|
Servicing rights – change in valuation inputs or assumptions(1) |
|
|
(13,142 |
) |
|
|
3,274 |
|
|
|
(26,305 |
) |
|
|
2,200 |
|
Residual interests classified as debt – change in valuation inputs or assumptions(2) |
|
|
16 |
|
|
|
12 |
|
|
|
43 |
|
|
|
47 |
|
Adjusted noninterest income – Lending (non-GAAP) |
|
$ |
138,374 |
|
|
$ |
74,123 |
|
|
$ |
267,427 |
|
|
$ |
125,836 |
|
| ____________________ | ||
(1) |
See footnote (1) to the table above. |
|
(2) |
See footnote (2) to the table above. |
|
Adjusted Contribution Margin and Incremental Adjusted Contribution Margin — Lending
Adjusted contribution margin and incremental adjusted contribution margin are non-GAAP measures and relate only to our Lending segment. Adjusted contribution margin is defined as segment contribution profit for the Lending segment, divided by adjusted net revenue for the Lending segment, a non-GAAP measure. Incremental adjusted contribution margin is defined as the change in segment contribution profit for our Lending segment, divided by change in adjusted net revenue for the Lending segment. See ‘Adjusted Net Revenue’ above for a reconciliation of Lending segment adjusted net revenue.
Management believes adjusted contribution margin metrics are useful because they enable management and investors to assess the underlying operating performance of our Lending segment, by removing the impact of changes in volume over periods to present a comparable view of segment contribution profit, which is a measure of the direct profitability of each of our reportable segments, as a percentage of segment adjusted net revenue for the Lending segment during each period.
The following table presents a reconciliation of adjusted contribution margin and incremental adjusted contribution margin for our reportable Lending segment:
|
|
Three Months Ended
|
|
2026 vs 2025 |
|
Six Months Ended
|
|
2026 vs 2025 |
||||||||||||||
($ in thousands) |
|
2026 |
|
2025 |
|
$ Change |
|
2026 |
|
2025 |
|
$ Change |
||||||||||
Lending |
|
|
|
|
|
|
|
|
|
|
|
|
||||||||||
Contribution profit – Lending (GAAP) |
|
$ |
399,033 |
|
|
$ |
244,710 |
|
|
$ |
154,323 |
|
$ |
781,419 |
|
|
$ |
483,645 |
|
|
$ |
297,774 |
Net revenue – Lending (GAAP) |
|
|
724,798 |
|
|
|
443,512 |
|
|
|
281,286 |
|
|
1,367,218 |
|
|
|
856,885 |
|
|
|
510,333 |
Contribution margin – Lending (GAAP)(1) |
|
|
55 |
% |
|
|
55 |
% |
|
|
|
|
57 |
% |
|
|
56 |
% |
|
|
||
Incremental contribution margin – Lending (GAAP)(1) |
|
|
55 |
% |
|
|
|
|
|
|
58 |
% |
|
|
|
|
||||||
|
|
|
|
|
|
|
|
|
|
|
|
|
||||||||||
Adjusted net revenue – Lending (non-GAAP)(2) |
|
$ |
711,672 |
|
|
$ |
446,798 |
|
|
$ |
264,874 |
|
$ |
1,340,956 |
|
|
$ |
859,132 |
|
|
$ |
481,824 |
Adjusted contribution margin – Lending (non-GAAP) |
|
|
56 |
% |
|
|
55 |
% |
|
|
|
|
58 |
% |
|
|
56 |
% |
|
|
||
Incremental adjusted contribution margin – Lending (non-GAAP) |
|
|
58 |
% |
|
|
|
|
|
|
62 |
% |
|
|
|
|
||||||
| ____________________ | ||
(1) |
Contribution margin is defined for each of our reportable segments as contribution profit divided by net revenue. Incremental contribution margin for each of our reportable segments is defined as the change in segment contribution profit divided by change in net revenue. |
|
(2) |
Refer to ‘Adjusted Net Revenue’ above for reconciliation of this non-GAAP measure. |
|
Adjusted EBITDA, Adjusted EBITDA Margin and Incremental Adjusted EBITDA Margin
Adjusted EBITDA, adjusted EBITDA margin and incremental adjusted EBITDA margin are non-GAAP measures. Adjusted EBITDA is defined as net income, adjusted to exclude, as applicable: (i) corporate borrowing-based interest expense (our adjusted EBITDA measure is not adjusted for warehouse or securitization-based interest expense, nor deposit interest expense and finance lease liability interest expense, as these are direct operating expenses), (ii) income tax expense (benefit), (iii) depreciation and amortization, (iv) share-based expense (inclusive of equity-based payments to non-employees), (v) foreign currency impacts related to operations in highly inflationary countries, (vi) fair value changes in each of servicing rights and residual interests classified as debt due to valuation assumptions, (vii) restructuring charges, (viii) transaction-related expenses, and (ix) other charges, as appropriate, that are not expected to recur and are not indicative of our core operating performance.
Adjusted EBITDA margin is computed as adjusted EBITDA divided by adjusted net revenue. Incremental adjusted EBITDA margin is defined as the change in adjusted EBITDA, divided by change in adjusted net revenue. See ‘Adjusted Net Revenue’ above for a reconciliation of this non-GAAP measure.
Management believes adjusted EBITDA, adjusted EBITDA margin and incremental adjusted EBITDA margin are useful measures for period-over-period comparisons of our business. These measures enable management and investors to assess our core operating performance or results of operations by removing the effects of certain non-cash items and charges, as well as the impact of changes in volume over periods as applicable. In addition, management uses these measures to help evaluate cash flows generated from operations and the extent of additional capital, if any, required to invest in strategic initiatives.
The following table reconciles adjusted EBITDA to net income, the most directly comparable GAAP measure, and presents the computations of adjusted EBITDA margin and incremental adjusted EBITDA margin:
|
|
Three Months Ended
|
|
2026 vs 2025 |
|
Six Months Ended
|
|
2026 vs 2025 |
||||||||||||||||
($ in thousands) |
|
2026 |
|
2025 |
|
$ Change |
|
2026 |
|
2025 |
|
$ Change |
||||||||||||
Net income (GAAP) |
|
$ |
156,592 |
|
|
$ |
97,263 |
|
|
$ |
59,329 |
|
|
$ |
323,323 |
|
|
$ |
168,379 |
|
|
$ |
154,944 |
|
Non-GAAP adjustments: |
|
|
|
|
|
|
|
|
|
|
|
|
||||||||||||
Interest expense – corporate borrowings(1) |
|
|
10,675 |
|
|
|
11,504 |
|
|
|
(829 |
) |
|
|
21,326 |
|
|
|
22,932 |
|
|
|
(1,606 |
) |
Income tax expense(2) |
|
|
47,717 |
|
|
|
14,929 |
|
|
|
32,788 |
|
|
|
80,538 |
|
|
|
23,595 |
|
|
|
56,943 |
|
Depreciation and amortization |
|
|
73,106 |
|
|
|
56,743 |
|
|
|
16,363 |
|
|
|
140,684 |
|
|
|
112,026 |
|
|
|
28,658 |
|
Share-based expense |
|
|
76,865 |
|
|
|
63,256 |
|
|
|
13,609 |
|
|
|
148,877 |
|
|
|
127,012 |
|
|
|
21,865 |
|
Foreign currency impact of highly inflationary subsidiaries(3) |
|
|
926 |
|
|
|
2,066 |
|
|
|
(1,140 |
) |
|
|
1,337 |
|
|
|
2,342 |
|
|
|
(1,005 |
) |
Servicing rights – change in valuation inputs or assumptions(4) |
|
|
(13,142 |
) |
|
|
3,274 |
|
|
|
(16,416 |
) |
|
|
(26,305 |
) |
|
|
2,200 |
|
|
|
(28,505 |
) |
Residual interests classified as debt – change in valuation inputs or assumptions(5) |
|
|
16 |
|
|
|
12 |
|
|
|
4 |
|
|
|
43 |
|
|
|
47 |
|
|
|
(4 |
) |
Restructuring charges(6) |
|
|
682 |
|
|
|
36 |
|
|
|
646 |
|
|
|
2,642 |
|
|
|
887 |
|
|
|
1,755 |
|
Transaction-related expense(7) |
|
|
4,384 |
|
|
|
— |
|
|
|
4,384 |
|
|
|
5,257 |
|
|
|
— |
|
|
|
5,257 |
|
Total adjustments |
|
|
201,229 |
|
|
|
151,820 |
|
|
|
49,409 |
|
|
|
374,399 |
|
|
|
291,041 |
|
|
|
83,358 |
|
Adjusted EBITDA (non-GAAP) |
|
$ |
357,821 |
|
|
$ |
249,083 |
|
|
$ |
108,738 |
|
|
$ |
697,722 |
|
|
$ |
459,420 |
|
|
$ |
238,302 |
|
|
|
|
|
|
|
|
|
|
|
|
|
|
||||||||||||
Total net revenue (GAAP) |
|
$ |
1,218,676 |
|
|
$ |
854,944 |
|
|
$ |
363,732 |
|
|
$ |
2,319,044 |
|
|
$ |
1,626,703 |
|
|
$ |
692,341 |
|
Net income margin (GAAP) |
|
|
13 |
% |
|
|
11 |
% |
|
|
|
|
14 |
% |
|
|
10 |
% |
|
|
||||
Incremental net income margin (GAAP) |
|
|
16 |
% |
|
|
|
|
|
|
22 |
% |
|
|
|
|
||||||||
|
|
|
|
|
|
|
|
|
|
|
|
|
||||||||||||
Adjusted net revenue (non-GAAP)(8) |
|
$ |
1,205,550 |
|
|
$ |
858,230 |
|
|
$ |
347,320 |
|
|
$ |
2,292,782 |
|
|
$ |
1,628,950 |
|
|
$ |
663,832 |
|
Adjusted EBITDA margin (non-GAAP) |
|
|
30 |
% |
|
|
29 |
% |
|
|
|
|
30 |
% |
|
|
28 |
% |
|
|
||||
Incremental adjusted EBITDA margin (non-GAAP) |
|
|
31 |
% |
|
|
|
|
|
|
36 |
% |
|
|
|
|
||||||||
| ____________________ | ||
(1) |
Our adjusted EBITDA measure adjusts for corporate borrowing-based interest expense, as these expenses are a function of our capital structure. Corporate borrowing-based interest expense includes interest on our revolving credit facility, as well as interest expense and the amortization of debt discount and debt issuance costs on our convertible notes. |
|
(2) |
The income tax expense recognized in both periods was primarily attributable to the Company’s profitability, partially offset by discrete tax benefits for stock compensation recorded in each quarter. |
|
(3) |
Foreign currency charges reflect the impacts of highly inflationary accounting for our operations in |
|
(4) |
Reflects changes in fair value inputs and assumptions, including market servicing costs, conditional prepayment, default rates and discount rates. This non-cash change is unrealized during the period and, therefore, has no impact on our cash flows from operations. As such, these positive and negative changes in fair value attributable to assumption changes are adjusted out of net income to provide management and financial users with better visibility into the earnings available to finance our operations. |
|
(5) |
Reflects changes in fair value inputs and assumptions, including conditional prepayment, default rates and discount rates. When third parties finance our consolidated VIEs through purchasing residual interests, we receive proceeds at the time of the securitization close and, thereafter, pass along contractual cash flows to the residual interest owner. These obligations are measured at fair value on a recurring basis, which has no impact on our initial financing proceeds, our future obligations to the residual interest owner (because future residual interest claims are limited to contractual securitization collateral cash flows), or the general operations of our business. As such, these positive and negative non-cash changes in fair value attributable to assumption changes are adjusted out of net income to provide management and financial users with better visibility into the earnings available to finance our operations. |
|
(6) |
Restructuring charges in the 2026 periods included employee-related wages, benefits and severance associated with a small reduction in headcount in our Technology Platform segment, which do not reflect expected future operating expenses and are not indicative of our core operating performance. Restructuring charges in 2025 relate to legal entity restructuring. |
|
(7) |
Transaction-related expenses in 2026 periods primarily included financial advisory and professional services costs associated with our acquisitions of Composer and Peach. |
|
(8) |
Refer to 'Adjusted Net Revenue' above for reconciliation of this non-GAAP measure. |
|
Tangible Book Value and Tangible Book Value per Common Share
Tangible book value is defined as permanent equity, adjusted to exclude goodwill and intangible assets, net of related deferred tax liabilities. Tangible book value per common share represents tangible book value at period-end divided by common stock outstanding at period-end. Prior periods were revised to conform with this presentation.
These measures are utilized by management in assessing our use of equity and capital adequacy. We believe that tangible book value presents a meaningful measure of net asset value, and tangible book value per share provides additional useful information to investors to assess capital adequacy.
The following table reconciles tangible book value to permanent equity, the most directly comparable GAAP measure, and presents the computation of permanent equity per common share and tangible book value per common share for the periods presented:
($ and shares in thousands, except per share amounts) |
|
June 30,
|
|
June 30,
|
||||
Equity (GAAP) |
|
$ |
11,076,227 |
|
|
$ |
6,860,580 |
|
Non-GAAP adjustments: |
|
|
|
|
||||
Goodwill |
|
|
(1,425,015 |
) |
|
|
(1,393,505 |
) |
Intangible assets |
|
|
(226,528 |
) |
|
|
(263,522 |
) |
Related deferred tax liabilities |
|
|
45,536 |
|
|
|
51,322 |
|
Tangible book value (as of period end) (non-GAAP) |
|
$ |
9,470,220 |
|
|
$ |
5,254,875 |
|
|
|
|
|
|
||||
Common stock outstanding (as of period end) |
|
|
1,290,312 |
|
|
|
1,113,443 |
|
|
|
|
|
|
||||
Book value per common share (GAAP) |
|
$ |
8.58 |
|
|
$ |
6.16 |
|
Tangible book value per common share (non-GAAP) |
|
$ |
7.34 |
|
|
$ |
4.72 |
|
Adjusted Net Income, Adjusted Net Income Margin, Incremental Adjusted Net Income Margin and Adjusted EPS
Adjusted net income, adjusted net income margin, incremental adjusted net income margin and adjusted diluted earnings per share are non-GAAP measures. Adjusted net income is defined as net income, adjusted to exclude, as applicable, transaction-related expense, restructuring charges, goodwill impairment expense and certain income tax benefits that are not expected to recur and are not indicative of our core operating performance.
Adjusted diluted earnings per share (“adjusted EPS”) is a non-GAAP financial measure that adjusts GAAP diluted earnings per share. Adjusted EPS is computed by dividing net income attributable to common stockholders, adjusted to exclude, as applicable, transaction-related expense, restructuring charges, goodwill impairment expense and certain income tax benefits that are not expected to recur and are not indicative of our core operating performance, by the diluted weighted average number of shares of common stock outstanding during the period, excluding the dilutive impact of the 2026 and 2029 convertible notes under the if-converted method for which the 2026 and 2029 capped call transactions, respectively, would deliver cash or shares to offset dilution. The exclusions of transaction-related expense and restructuring charges were effective beginning in the second quarter of 2026. The impact to prior periods was determined to be immaterial, and therefore prior periods were not recast.
Adjusted net income margin is computed as adjusted net income divided by adjusted net revenue. Incremental adjusted net income margin is defined as the change in adjusted net income, divided by change in adjusted net revenue. See ‘Adjusted Net Revenue’ above for a reconciliation of this non-GAAP measure.
Management believes adjusted net income, adjusted net income margin, incremental adjusted net income margin and adjusted EPS are useful because they enable management and investors to assess our core operating performance or results of operations, by removing the effects of certain non cash items and charges to present a comparable view for period over period comparisons of our business.
The following table: (i) reconciles adjusted net income to net income, the most directly comparable GAAP measure, (ii) reconciles adjusted EPS to diluted earnings per share, the most directly comparable GAAP measure, and (iii) presents the computations of adjusted net income margin and incremental adjusted net income margin.
($ and shares in thousands, except per share amounts)(1) |
|
Three Months Ended
|
|
2026 vs 2025 |
|
Six Months Ended
|
|
2026 vs 2025 |
||||||||||||||||
|
2026 |
|
2025 |
|
$ Change |
|
2026 |
|
2025 |
|
$ Change |
|||||||||||||
Net income (GAAP) |
|
$ |
156,592 |
|
|
$ |
97,263 |
|
|
$ |
59,329 |
|
|
$ |
323,323 |
|
|
$ |
168,379 |
|
|
$ |
154,944 |
|
Non-GAAP adjustments: |
|
|
|
|
|
|
|
|
|
|
|
|
||||||||||||
Restructuring charges |
|
|
682 |
|
|
|
— |
|
|
|
682 |
|
|
|
682 |
|
|
|
— |
|
|
|
682 |
|
Transaction-related expense |
|
|
4,384 |
|
|
|
— |
|
|
|
4,384 |
|
|
|
4,384 |
|
|
|
— |
|
|
|
4,384 |
|
Tax impacts from adjustments |
|
|
(1,252 |
) |
|
|
— |
|
|
|
(1,252 |
) |
|
|
(1,252 |
) |
|
|
— |
|
|
|
(1,252 |
) |
Adjusted net income (non-GAAP) |
|
$ |
160,406 |
|
|
$ |
97,263 |
|
|
$ |
63,143 |
|
|
$ |
327,137 |
|
|
$ |
168,379 |
|
|
$ |
158,758 |
|
|
|
|
|
|
|
|
|
|
|
|
|
|
||||||||||||
Numerator: |
|
|
|
|
|
|
|
|
|
|
|
|
||||||||||||
Net income attributable to common stockholders – diluted (GAAP)(2) |
|
$ |
156,645 |
|
|
$ |
97,614 |
|
|
|
|
$ |
323,720 |
|
|
$ |
169,069 |
|
|
|
||||
Non-GAAP adjustments: |
|
|
|
|
|
|
|
|
|
|
|
|
||||||||||||
Restructuring charges |
|
|
682 |
|
|
|
— |
|
|
|
|
|
682 |
|
|
|
— |
|
|
|
||||
Transaction-related expense |
|
|
4,384 |
|
|
|
— |
|
|
|
|
|
4,384 |
|
|
|
— |
|
|
|
||||
Tax impacts from adjustments |
|
|
(1,252 |
) |
|
|
— |
|
|
|
|
|
(1,252 |
) |
|
|
— |
|
|
|
||||
Adjusted net income attributable to common stockholders – diluted (non-GAAP) |
|
$ |
160,459 |
|
|
$ |
97,614 |
|
|
|
|
$ |
327,534 |
|
|
$ |
169,069 |
|
|
|
||||
Denominator: |
|
|
|
|
|
|
|
|
|
|
|
|
||||||||||||
Weighted average common stock outstanding – diluted |
|
|
1,351,990 |
|
|
|
1,182,877 |
|
|
|
|
|
1,364,978 |
|
|
|
1,184,197 |
|
|
|
||||
Non-GAAP adjustments: |
|
|
|
|
|
|
|
|
|
|
|
|
||||||||||||
Dilutive impact of convertible notes(3) |
|
|
(27,412 |
) |
|
|
(25,857 |
) |
|
|
|
|
(24,722 |
) |
|
|
(28,635 |
) |
|
|
||||
Adjusted weighted average common stock outstanding — diluted (non-GAAP) |
|
|
1,324,578 |
|
|
|
1,157,020 |
|
|
|
|
|
1,340,256 |
|
|
|
1,155,562 |
|
|
|
||||
|
|
|
|
|
|
|
|
|
|
|
|
|
||||||||||||
Earnings per share – diluted (GAAP)(2) |
|
$ |
0.12 |
|
|
$ |
0.08 |
|
|
|
|
$ |
0.24 |
|
|
$ |
0.14 |
|
|
|
||||
Impact of adjustments per share |
|
|
— |
|
|
|
— |
|
|
|
|
|
— |
|
|
|
0.01 |
|
|
|
||||
Adjusted earnings per share – diluted (non-GAAP)(2) |
|
$ |
0.12 |
|
|
$ |
0.08 |
|
|
|
|
$ |
0.24 |
|
|
$ |
0.15 |
|
|
|
||||
|
|
|
|
|
|
|
|
|
|
|
|
|
||||||||||||
Net income margin (GAAP) |
|
|
13 |
% |
|
|
11 |
% |
|
|
|
|
14 |
% |
|
|
10 |
% |
|
|
||||
|
|
|
|
|
|
|
|
|
|
|
|
|
||||||||||||
Adjusted net revenue (non-GAAP)(4) |
|
$ |
1,205,550 |
|
|
$ |
858,230 |
|
|
|
|
$ |
2,292,782 |
|
|
$ |
1,628,950 |
|
|
|
||||
Adjusted net income margin (non-GAAP) |
|
|
13 |
% |
|
|
11 |
% |
|
|
|
|
14 |
% |
|
|
10 |
% |
|
|
||||
Incremental adjusted net income margin (non-GAAP) |
|
|
18 |
% |
|
|
|
|
|
|
24 |
% |
|
|
|
|
||||||||
| ____________________ | ||
(1) |
Certain amounts may not recalculate exactly using the rounded amounts provided. Earnings per share is calculated based on unrounded numbers. |
|
(2) |
Diluted earnings per share and diluted net income attributable to common stockholders exclude gain on extinguishment of debt, net of tax, as well as interest expense incurred, net of tax, associated with convertible note activity during the period as evaluated under the if-converted method. |
|
(3) |
This non-GAAP adjustment excludes the dilutive impact of the 2026 and 2029 convertible notes, to the extent that the 2026 and 2029 capped call transactions, respectively, would deliver cash or shares to offset dilution. |
|
(4) |
Refer to 'Adjusted Net Revenue' above for reconciliation of this non-GAAP measure. |
|
Table 3 |
||||||||
SoFi Technologies, Inc. |
||||||||
Condensed Consolidated Balance Sheets |
||||||||
(Unaudited) |
||||||||
(In Thousands, Except for Share Data) |
||||||||
|
June 30,
|
|
December 31,
|
|||||
Assets |
|
|
|
|||||
Cash and cash equivalents |
$ |
3,126,237 |
|
|
$ |
4,929,452 |
|
|
Restricted cash and restricted cash equivalents |
|
439,322 |
|
|
|
427,321 |
|
|
Investment securities (includes available-for-sale securities of |
|
4,225,652 |
|
|
|
2,575,607 |
|
|
Loans held for sale (includes |
|
29,737,289 |
|
|
|
22,862,749 |
|
|
Loans held for investment, at fair value |
|
16,920,564 |
|
|
|
13,657,578 |
|
|
Loans held for investment, at amortized cost (less allowance for credit losses of |
|
1,275,529 |
|
|
|
1,516,736 |
|
|
Servicing rights |
|
364,318 |
|
|
|
378,178 |
|
|
Property, equipment and software |
|
496,712 |
|
|
|
416,448 |
|
|
Goodwill |
|
1,425,015 |
|
|
|
1,393,505 |
|
|
Intangible assets |
|
226,528 |
|
|
|
231,919 |
|
|
Operating lease right-of-use assets |
|
86,149 |
|
|
|
93,941 |
|
|
Other assets (less allowance for credit losses of |
|
2,624,233 |
|
|
|
2,177,044 |
|
|
Total assets |
$ |
60,947,548 |
|
|
$ |
50,660,478 |
|
|
Liabilities and equity |
|
|
|
|||||
Liabilities: |
|
|
|
|||||
Deposits: |
|
|
|
|||||
Interest-bearing deposits |
$ |
45,416,257 |
|
|
$ |
37,387,350 |
|
|
Noninterest-bearing deposits |
|
126,903 |
|
|
|
118,045 |
|
|
Total deposits |
|
45,543,160 |
|
|
|
37,505,395 |
|
|
Accounts payable, accruals and other liabilities |
|
923,024 |
|
|
|
743,716 |
|
|
Operating lease liabilities |
|
104,083 |
|
|
|
106,190 |
|
|
Debt |
|
3,300,544 |
|
|
|
1,815,162 |
|
|
Residual interests classified as debt |
|
510 |
|
|
|
520 |
|
|
Total liabilities |
|
49,871,321 |
|
|
|
40,170,983 |
|
|
Commitments, guarantees, concentrations and contingencies |
|
|
|
|||||
Equity: |
|
|
|
|||||
Common stock, |
|
128 |
|
|
|
126 |
|
|
Additional paid-in capital |
|
11,589,035 |
|
|
|
11,302,668 |
|
|
Accumulated other comprehensive income (loss) |
|
(11,981 |
) |
|
|
10,979 |
|
|
Accumulated deficit |
|
(500,955 |
) |
|
|
(824,278 |
) |
|
Total equity |
|
11,076,227 |
|
|
|
10,489,495 |
|
|
Total liabilities and equity |
$ |
60,947,548 |
|
|
$ |
50,660,478 |
|
|
Table 4 |
||||||||||||||||||||||
SoFi Technologies, Inc. |
||||||||||||||||||||||
Average Balances and Net Interest Earnings Analysis |
||||||||||||||||||||||
(Unaudited) |
||||||||||||||||||||||
|
|
|
|
|
||||||||||||||||||
|
|
Three Months Ended
|
|
Three Months Ended
|
||||||||||||||||||
($ in thousands) |
|
Average Balances |
|
Interest Income/Expense |
|
Average Yield/Rate |
|
Average Balances |
|
Interest Income/Expense |
|
Average Yield/Rate |
||||||||||
Assets |
|
|
|
|
|
|
|
|
|
|
|
|
||||||||||
Interest-earning assets: |
|
|
|
|
|
|
|
|
|
|
|
|
||||||||||
Interest-bearing deposits with banks |
|
$ |
3,790,852 |
|
|
$ |
32,430 |
|
|
3.43 |
% |
|
$ |
2,811,423 |
|
|
$ |
25,086 |
|
|
3.58 |
% |
Investment securities |
|
|
3,688,523 |
|
|
|
42,129 |
|
|
4.58 |
|
|
|
2,277,616 |
|
|
|
29,878 |
|
|
5.26 |
|
Loans |
|
|
45,380,080 |
|
|
|
1,065,969 |
|
|
9.42 |
|
|
|
30,331,237 |
|
|
|
737,441 |
|
|
9.75 |
|
Total interest-earning assets |
|
|
52,859,455 |
|
|
|
1,140,528 |
|
|
8.65 |
|
|
|
35,420,276 |
|
|
|
792,405 |
|
|
8.97 |
|
Total noninterest-earning assets |
|
|
4,376,513 |
|
|
|
|
|
|
|
3,944,524 |
|
|
|
|
|
||||||
Total assets |
|
$ |
57,235,968 |
|
|
|
|
|
|
$ |
39,364,800 |
|
|
|
|
|
||||||
Liabilities and Equity |
|
|
|
|
|
|
|
|
|
|
|
|
||||||||||
Interest-bearing liabilities: |
|
|
|
|
|
|
|
|
|
|
|
|
||||||||||
Demand deposits |
|
$ |
3,644,040 |
|
|
$ |
10,336 |
|
|
1.14 |
% |
|
$ |
2,063,657 |
|
|
$ |
2,696 |
|
|
0.52 |
% |
Savings deposits |
|
|
36,059,867 |
|
|
|
289,065 |
|
|
3.22 |
|
|
|
25,264,749 |
|
|
|
226,394 |
|
|
3.59 |
|
Time deposits |
|
|
2,212,570 |
|
|
|
21,062 |
|
|
3.82 |
|
|
|
487,916 |
|
|
|
4,142 |
|
|
3.40 |
|
Total interest-bearing deposits |
|
|
41,916,477 |
|
|
|
320,463 |
|
|
3.07 |
|
|
|
27,816,322 |
|
|
|
233,232 |
|
|
3.36 |
|
Warehouse facilities |
|
|
1,475,784 |
|
|
|
17,039 |
|
|
4.63 |
|
|
|
2,137,160 |
|
|
|
27,874 |
|
|
5.23 |
|
Securitization debt |
|
|
49,800 |
|
|
|
529 |
|
|
4.26 |
|
|
|
62,432 |
|
|
|
554 |
|
|
3.56 |
|
Other debt |
|
|
1,979,602 |
|
|
|
14,302 |
|
|
2.90 |
|
|
|
1,757,224 |
|
|
|
12,908 |
|
|
2.95 |
|
Total debt |
|
|
3,505,186 |
|
|
|
31,870 |
|
|
3.65 |
|
|
|
3,956,816 |
|
|
|
41,336 |
|
|
4.19 |
|
Residual interests classified as debt |
|
|
518 |
|
|
|
— |
|
|
— |
|
|
|
561 |
|
|
|
— |
|
|
— |
|
Total interest-bearing liabilities |
|
|
45,422,181 |
|
|
|
352,333 |
|
|
3.11 |
|
|
|
31,773,699 |
|
|
|
274,568 |
|
|
3.47 |
|
Total noninterest-bearing liabilities |
|
|
1,181,640 |
|
|
|
|
|
|
|
919,349 |
|
|
|
|
|
||||||
Total liabilities |
|
|
46,603,821 |
|
|
|
|
|
|
|
32,693,048 |
|
|
|
|
|
||||||
Total equity |
|
|
10,632,147 |
|
|
|
|
|
|
|
6,671,752 |
|
|
|
|
|
||||||
Total liabilities and equity |
|
$ |
57,235,968 |
|
|
|
|
|
|
$ |
39,364,800 |
|
|
|
|
|
||||||
|
|
|
|
|
|
|
|
|
|
|
|
|
||||||||||
Net interest income |
|
|
|
$ |
788,195 |
|
|
|
|
|
|
$ |
517,837 |
|
|
|
||||||
Net interest margin |
|
|
|
|
|
5.98 |
% |
|
|
|
|
|
5.86 |
% |
||||||||
|
|
|
|
|
|
|
|
|
|
|
|
|
||||||||||
|
|
Six Months Ended
|
|
Six Months Ended
|
||||||||||||||||||
($ in thousands) |
|
Average Balances |
|
Interest Income/Expense |
|
Average Yield/Rate |
|
Average Balances |
|
Interest Income/Expense |
|
Average Yield/Rate |
||||||||||
Assets |
|
|
|
|
|
|
|
|
|
|
|
|
||||||||||
Interest-earning assets: |
|
|
|
|
|
|
|
|
|
|
|
|
||||||||||
Interest-bearing deposits with banks |
|
$ |
4,139,321 |
|
|
$ |
70,179 |
|
|
3.42 |
% |
|
$ |
2,751,678 |
|
|
$ |
51,073 |
|
|
3.74 |
% |
Investment securities |
|
|
3,208,207 |
|
|
|
74,869 |
|
|
4.71 |
|
|
|
2,153,794 |
|
|
|
56,222 |
|
|
5.26 |
|
Loans |
|
|
42,916,601 |
|
|
|
1,996,476 |
|
|
9.38 |
|
|
|
29,608,981 |
|
|
|
1,448,922 |
|
|
9.87 |
|
Total interest-earning assets |
|
|
50,264,129 |
|
|
|
2,141,524 |
|
|
8.59 |
|
|
|
34,514,453 |
|
|
|
1,556,217 |
|
|
9.09 |
|
Total noninterest-earning assets |
|
|
4,354,094 |
|
|
|
|
|
|
|
3,902,786 |
|
|
|
|
|
||||||
Total assets |
|
$ |
54,618,223 |
|
|
|
|
|
|
$ |
38,417,239 |
|
|
|
|
|
||||||
Liabilities, Temporary Equity and Permanent Equity |
|
|
|
|
|
|
|
|
|
|
|
|
||||||||||
Interest-bearing liabilities: |
|
|
|
|
|
|
|
|
|
|
|
|
||||||||||
Demand deposits |
|
$ |
3,528,845 |
|
|
$ |
18,731 |
|
|
1.07 |
% |
|
$ |
1,964,252 |
|
|
$ |
5,067 |
|
|
0.52 |
% |
Savings deposits |
|
|
34,709,922 |
|
|
|
557,367 |
|
|
3.24 |
|
|
|
24,484,120 |
|
|
|
443,065 |
|
|
3.65 |
|
Time deposits |
|
|
1,613,710 |
|
|
|
31,593 |
|
|
3.95 |
|
|
|
557,151 |
|
|
|
10,499 |
|
|
3.80 |
|
Total interest-bearing deposits |
|
|
39,852,477 |
|
|
|
607,691 |
|
|
3.07 |
|
|
|
27,005,523 |
|
|
|
458,631 |
|
|
3.42 |
|
Warehouse facilities |
|
|
1,103,425 |
|
|
|
25,338 |
|
|
4.63 |
|
|
|
2,063,312 |
|
|
|
54,264 |
|
|
5.30 |
|
Securitization debt |
|
|
51,423 |
|
|
|
918 |
|
|
3.60 |
|
|
|
68,034 |
|
|
|
1,135 |
|
|
3.36 |
|
Other debt |
|
|
1,871,195 |
|
|
|
26,394 |
|
|
2.84 |
|
|
|
1,756,459 |
|
|
|
25,624 |
|
|
2.94 |
|
Total debt |
|
|
3,026,043 |
|
|
|
52,650 |
|
|
3.51 |
|
|
|
3,887,805 |
|
|
|
81,023 |
|
|
4.20 |
|
Residual interests classified as debt |
|
|
514 |
|
|
|
— |
|
|
— |
|
|
|
568 |
|
|
|
— |
|
|
— |
|
Total interest-bearing liabilities |
|
|
42,879,034 |
|
|
|
660,341 |
|
|
3.11 |
|
|
|
30,893,896 |
|
|
|
539,654 |
|
|
3.52 |
|
Total noninterest-bearing liabilities |
|
|
1,200,999 |
|
|
|
|
|
|
|
885,613 |
|
|
|
|
|
||||||
Total liabilities |
|
|
44,080,033 |
|
|
|
|
|
|
|
31,779,509 |
|
|
|
|
|
||||||
Total equity |
|
|
10,538,190 |
|
|
|
|
|
|
|
6,637,730 |
|
|
|
|
|
||||||
Total liabilities and equity |
|
$ |
54,618,223 |
|
|
|
|
|
|
$ |
38,417,239 |
|
|
|
|
|
||||||
|
|
|
|
|
|
|
|
|
|
|
|
|
||||||||||
Net interest income |
|
|
|
$ |
1,481,183 |
|
|
|
|
|
|
$ |
1,016,563 |
|
|
|
||||||
Net interest margin |
|
|
|
|
|
5.94 |
% |
|
|
|
|
|
5.94 |
% |
||||||||
Table 5 |
||||||||||||||||||
Company Metrics |
||||||||||||||||||
|
June 30, 2026 |
|
March 31, 2026 |
|
December 31, 2025 |
|
September 30, 2025 |
|
June 30, 2025 |
|
March 31, 2025 |
|
December 31, 2024 |
|
September 30, 2024 |
|
June 30, 2024 |
|
Members |
15,814,418 |
|
14,706,040 |
|
13,651,002 |
|
12,642,375 |
|
11,745,572 |
|
10,915,811 |
|
10,127,323 |
|
9,372,615 |
|
8,774,236 |
|
Total Products |
24,380,974 |
|
22,159,146 |
|
20,168,142 |
|
18,553,053 |
|
17,142,041 |
|
15,915,425 |
|
14,745,435 |
|
13,650,730 |
|
12,776,430 |
|
Total Products — Lending segment |
3,093,359 |
|
2,831,352 |
|
2,633,186 |
|
2,462,588 |
|
2,280,368 |
|
2,129,833 |
|
2,010,354 |
|
1,890,761 |
|
1,786,580 |
|
Total Products — Financial Services segment |
21,287,615 |
|
19,327,794 |
|
17,534,956 |
|
16,090,465 |
|
14,861,673 |
|
13,785,592 |
|
12,735,081 |
|
11,759,969 |
|
10,989,850 |
|
Total Accounts — Technology Platform segment |
134,804,238 |
|
132,874,105 |
|
128,461,873 |
|
157,859,670 |
|
160,046,369 |
|
158,432,347 |
|
167,713,818 |
|
160,179,299 |
|
158,485,125 |
|
Members
We refer to our customers as “members”. We define a member as someone who has a lending relationship with us through origination and/or ongoing servicing, opened a financial services account, linked an external account to our platform, or signed up for our credit score monitoring service. Our members have access to our CFPs, our member events, our content, educational material, news, and our tools and calculators, which are provided at no cost to the member. We view members as an indication not only of the size and a measurement of growth of our business, but also as a measure of the significant value of the data we have collected over time.
Once someone becomes a member, they are always considered a member unless they are removed in accordance with our terms of service, in which case, we adjust our total number of members. This could occur for a variety of reasons—including fraud or pursuant to certain legal processes—and, as our terms of service evolve together with our business practices, product offerings and applicable regulations, our grounds for removing members from our total member count could change. The determination that a member should be removed in accordance with our terms of service is subject to an evaluation process, following the completion, and based on the results, of which, relevant members and their associated products are removed from our total member count in the period in which such evaluation process concludes. However, depending on the length of the evaluation process, that removal may not take place in the same period in which the member was added to our member count or the same period in which the circumstances leading to their removal occurred. For this reason, our total member count may not yet reflect adjustments that may be made once ongoing evaluation processes, if any, conclude. Beginning in the first quarter of 2024, we aligned our methodology for calculating member and product metrics with our member and product definitions to include co-borrowers, co-signers, and joint- and co-account holders, as applicable. Quarterly amounts for prior periods were determined to be immaterial and were not recast.
Total Products
Total products refers to the aggregate number of lending and financial services products that our members have selected on our platform since our inception through the reporting date, whether or not the members are still registered for such products. Total products is a primary indicator of the size and reach of our Lending and Financial Services segments. Management relies on total products metrics to understand the effectiveness of our member acquisition efforts and to gauge the propensity for members to use more than one product.
In our Lending segment, total products refers to the number of personal loans, student loans and home loans that have been originated through our platform through the reporting date, inclusive of loans which we originate as part of our Loan Platform Business, whether or not such loans have been paid off. If a member has multiple loan products of the same loan product type, such as two personal loans, that is counted as a single product. However, if a member has multiple loan products across loan product types, such as one personal loan and one home loan, that is counted as two products. The account of a co-borrower or co-signer is not considered a separate lending product.
In our Financial Services segment, total products refers to the number of SoFi Money accounts (inclusive of checking and savings accounts held at SoFi Bank and cash management accounts), SoFi Invest accounts, SoFi Credit Card accounts (including Smart Card accounts and accounts with a zero dollar balance at the reporting date), referred loans (which are originated by a third-party partner to which we provide pre-qualified borrower referrals), SoFi At Work accounts, SoFi Relay accounts (with either credit score monitoring enabled or external linked accounts), and SoFi Crypto accounts that have been opened through our platform through the reporting date, as well as active SoFi Plus subscriptions as of the reporting date. Checking and savings accounts are considered one account within our total products metric. Our SoFi Invest service is composed of four products: IRA self-directed accounts, taxable self-directed accounts, IRA robo-advisory accounts, and taxable robo-advisory accounts. Our members can select any one or combination of the SoFi Invest products. If a member has multiple SoFi Invest accounts of the same products, such as one IRA self-directed account and one IRA robo-advisory account (or one tax-advantaged brokerage account and one taxable brokerage account), those are considered separate products. The account of a joint- or co-account holder is considered a separate financial services product. In the event a member is removed in accordance with our terms of service, as discussed under “Members” above, the member’s associated products are also removed.
Technology Platform Total Accounts
In our Technology Platform segment, total accounts refers to the number of open accounts at Galileo as of the reporting date. We include intercompany accounts on the Galileo platform as a service in our total accounts metric to better align with the Technology Platform segment revenue which includes intercompany revenue. Intercompany revenue is eliminated in consolidation. Total accounts is a primary indicator of the accounts dependent upon our technology platform to use virtual card products, virtual wallets, make peer-to-peer and bank-to-bank transfers, receive early paychecks, separate savings from spending balances, make debit transactions and rely upon real-time authorizations, all of which result in revenues for the Technology Platform segment. We do not measure total accounts for other products and solutions for which the revenue model is not primarily dependent upon being a fully integrated, stand-ready service.
Table 6 |
||||||||||||||||||||||||||||||||||||
Segment Financials |
||||||||||||||||||||||||||||||||||||
(Unaudited) |
||||||||||||||||||||||||||||||||||||
|
|
Quarter Ended |
||||||||||||||||||||||||||||||||||
($ and shares in thousands) |
|
June 30, 2026 |
|
March 31, 2026 |
|
December 31, 2025 |
|
September 30, 2025 |
|
June 30, 2025 |
|
March 31, 2025 |
|
December 31, 2024 |
|
September 30, 2024 |
|
June 30, 2024 |
||||||||||||||||||
Lending |
|
|
|
|
|
|
|
|
|
|
|
|
|
|
|
|
|
|
||||||||||||||||||
Net interest income |
|
$ |
573,298 |
|
|
$ |
500,231 |
|
|
$ |
444,763 |
|
|
$ |
427,973 |
|
|
$ |
372,675 |
|
|
$ |
360,621 |
|
|
$ |
345,210 |
|
|
$ |
316,268 |
|
|
$ |
279,212 |
|
Total noninterest income |
|
|
151,500 |
|
|
|
142,189 |
|
|
|
53,919 |
|
|
|
65,409 |
|
|
|
70,837 |
|
|
|
52,752 |
|
|
|
72,586 |
|
|
|
79,977 |
|
|
|
61,493 |
|
Total net revenue |
|
|
724,798 |
|
|
|
642,420 |
|
|
|
498,682 |
|
|
|
493,382 |
|
|
|
443,512 |
|
|
|
413,373 |
|
|
|
417,796 |
|
|
|
396,245 |
|
|
|
340,705 |
|
Adjusted net revenue – Lending(1) |
|
|
711,672 |
|
|
|
629,284 |
|
|
|
486,466 |
|
|
|
481,408 |
|
|
|
446,798 |
|
|
|
412,334 |
|
|
|
422,783 |
|
|
|
391,892 |
|
|
|
339,052 |
|
Contribution profit – Lending(2) |
|
|
399,033 |
|
|
|
382,386 |
|
|
|
271,655 |
|
|
|
261,600 |
|
|
|
244,710 |
|
|
|
238,935 |
|
|
|
245,958 |
|
|
|
238,928 |
|
|
|
197,938 |
|
Technology Platform |
|
|
|
|
|
|
|
|
|
|
|
|
|
|
|
|
|
|
||||||||||||||||||
Net interest income |
|
$ |
1,022 |
|
|
$ |
355 |
|
|
$ |
394 |
|
|
$ |
432 |
|
|
$ |
266 |
|
|
$ |
413 |
|
|
$ |
473 |
|
|
$ |
629 |
|
|
$ |
555 |
|
Total noninterest income |
|
|
83,483 |
|
|
|
74,731 |
|
|
|
121,979 |
|
|
|
114,146 |
|
|
|
109,567 |
|
|
|
103,014 |
|
|
|
102,362 |
|
|
|
101,910 |
|
|
|
94,883 |
|
Total net revenue(2) |
|
|
84,505 |
|
|
|
75,086 |
|
|
|
122,373 |
|
|
|
114,578 |
|
|
|
109,833 |
|
|
|
103,427 |
|
|
|
102,835 |
|
|
|
102,539 |
|
|
|
95,438 |
|
Contribution profit – Technology Platform |
|
|
11,772 |
|
|
|
11,999 |
|
|
|
47,934 |
|
|
|
32,371 |
|
|
|
33,195 |
|
|
|
30,913 |
|
|
|
32,107 |
|
|
|
32,955 |
|
|
|
31,151 |
|
Financial Services |
|
|
|
|
|
|
|
|
|
|
|
|
|
|
|
|
|
|
||||||||||||||||||
Net interest income |
|
$ |
249,052 |
|
|
$ |
227,740 |
|
|
$ |
207,810 |
|
|
$ |
203,660 |
|
|
$ |
193,322 |
|
|
$ |
173,199 |
|
|
$ |
160,337 |
|
|
$ |
154,143 |
|
|
$ |
139,229 |
|
Total noninterest income |
|
|
217,226 |
|
|
|
200,803 |
|
|
|
248,931 |
|
|
|
215,963 |
|
|
|
169,211 |
|
|
|
129,920 |
|
|
|
96,183 |
|
|
|
84,165 |
|
|
|
36,903 |
|
Total net revenue |
|
|
466,278 |
|
|
|
428,543 |
|
|
|
456,741 |
|
|
|
419,623 |
|
|
|
362,533 |
|
|
|
303,119 |
|
|
|
256,520 |
|
|
|
238,308 |
|
|
|
176,132 |
|
Contribution profit – Financial Services(2) |
|
|
212,676 |
|
|
|
195,584 |
|
|
|
230,788 |
|
|
|
225,557 |
|
|
|
188,232 |
|
|
|
148,332 |
|
|
|
114,855 |
|
|
|
99,758 |
|
|
|
55,220 |
|
Corporate/Other |
|
|
|
|
|
|
|
|
|
|
|
|
|
|
|
|
|
|
||||||||||||||||||
Net interest income (expense) |
|
$ |
(35,177 |
) |
|
$ |
(35,338 |
) |
|
$ |
(35,688 |
) |
|
$ |
(46,951 |
) |
|
$ |
(48,426 |
) |
|
$ |
(35,507 |
) |
|
$ |
(35,851 |
) |
|
$ |
(40,030 |
) |
|
$ |
(6,412 |
) |
Total noninterest income (loss) |
|
|
(21,728 |
) |
|
|
(10,343 |
) |
|
|
(17,057 |
) |
|
|
(19,032 |
) |
|
|
(12,508 |
) |
|
|
(12,653 |
) |
|
|
(7,175 |
) |
|
|
59 |
|
|
|
(7,245 |
) |
Total net revenue (loss)(2) |
|
|
(56,905 |
) |
|
|
(45,681 |
) |
|
|
(52,745 |
) |
|
|
(65,983 |
) |
|
|
(60,934 |
) |
|
|
(48,160 |
) |
|
|
(43,026 |
) |
|
|
(39,971 |
) |
|
|
(13,657 |
) |
Consolidated |
|
|
|
|
|
|
|
|
|
|
|
|
|
|
|
|
|
|
||||||||||||||||||
Net interest income |
|
$ |
788,195 |
|
|
$ |
692,988 |
|
|
$ |
617,279 |
|
|
$ |
585,114 |
|
|
$ |
517,837 |
|
|
$ |
498,726 |
|
|
$ |
470,169 |
|
|
$ |
431,010 |
|
|
$ |
412,584 |
|
Total noninterest income |
|
|
430,481 |
|
|
|
407,380 |
|
|
|
407,772 |
|
|
|
376,486 |
|
|
|
337,107 |
|
|
|
273,033 |
|
|
|
263,956 |
|
|
|
266,111 |
|
|
|
186,034 |
|
Total net revenue |
|
|
1,218,676 |
|
|
|
1,100,368 |
|
|
|
1,025,051 |
|
|
|
961,600 |
|
|
|
854,944 |
|
|
|
771,759 |
|
|
|
734,125 |
|
|
|
697,121 |
|
|
|
598,618 |
|
Adjusted net revenue(1) |
|
|
1,205,550 |
|
|
|
1,087,232 |
|
|
|
1,012,835 |
|
|
|
949,626 |
|
|
|
858,230 |
|
|
|
770,720 |
|
|
|
739,112 |
|
|
|
689,445 |
|
|
|
596,965 |
|
Net income |
|
|
156,592 |
|
|
|
166,731 |
|
|
|
173,549 |
|
|
|
139,392 |
|
|
|
97,263 |
|
|
|
71,116 |
|
|
|
332,473 |
|
|
|
60,745 |
|
|
|
17,404 |
|
Adjusted EBITDA(1) |
|
|
357,821 |
|
|
|
339,901 |
|
|
|
317,597 |
|
|
|
276,881 |
|
|
|
249,083 |
|
|
|
210,337 |
|
|
|
197,957 |
|
|
|
186,237 |
|
|
|
137,901 |
|
| ____________________ | ||
(1) |
Adjusted net revenue and adjusted EBITDA are non-GAAP financial measures. For additional information on these measures and reconciliations to the most directly comparable GAAP measures, see “Non-GAAP Financial Measures” and Table 2 to the “Financial Tables” herein. |
|
(2) |
Technology Platform segment total net revenue includes intercompany fees. The equal and offsetting intercompany expenses are reflected within all three segments’ directly attributable expenses, as well as within expenses not allocated to segments. The intercompany revenues and expenses are eliminated in consolidation. The revenues are eliminated within Corporate/Other and the expenses represent a reconciling item of segment contribution profit (loss) to consolidated income (loss) before income taxes. |
|
Table 7 |
||||||||||||||||
Fee-Based Revenue |
||||||||||||||||
(Unaudited) |
||||||||||||||||
|
|
Three Months Ended
|
|
Six Months Ended
|
||||||||||||
($ in thousands) |
|
2026 |
|
2025 |
|
2026 |
|
2025 |
||||||||
Loan platform fees |
|
$ |
116,572 |
|
|
$ |
104,857 |
|
|
$ |
235,550 |
|
|
$ |
177,907 |
|
Referrals, loan platform business |
|
|
24,358 |
|
|
|
22,548 |
|
|
|
43,635 |
|
|
|
42,248 |
|
Total Loan platform fees |
|
|
140,930 |
|
|
|
127,405 |
|
|
|
279,185 |
|
|
|
220,155 |
|
Referrals, other |
|
|
3,701 |
|
|
|
2,588 |
|
|
|
7,457 |
|
|
|
5,118 |
|
Interchange |
|
|
44,128 |
|
|
|
26,502 |
|
|
|
79,329 |
|
|
|
49,314 |
|
Brokerage |
|
|
18,127 |
|
|
|
7,542 |
|
|
|
33,231 |
|
|
|
14,527 |
|
Loan origination fees |
|
|
198,505 |
|
|
|
120,758 |
|
|
|
336,783 |
|
|
|
222,756 |
|
Technology services |
|
|
50,512 |
|
|
|
89,574 |
|
|
|
99,296 |
|
|
|
175,562 |
|
Net crypto transaction revenue(1) |
|
|
1,183 |
|
|
|
— |
|
|
|
2,035 |
|
|
|
— |
|
Other |
|
|
15,236 |
|
|
|
3,136 |
|
|
|
21,766 |
|
|
|
5,503 |
|
Total fee-based revenue |
|
$ |
472,322 |
|
|
$ |
377,505 |
|
|
$ |
859,082 |
|
|
$ |
692,935 |
|
| ____________________ | ||
(1) |
In the fourth quarter of 2025, the Company launched SoFi Crypto, which gives members the ability to buy, sell and hold digital assets. Net crypto transaction revenue primarily consists of transaction fees earned from facilitating member buy and sell orders on our platform. |
|
Table 8 |
||||||||||||||||||||||
Analysis of Charge-Offs |
||||||||||||||||||||||
(Unaudited) |
||||||||||||||||||||||
|
|
Three Months Ended
|
|
Three Months Ended
|
||||||||||||||||||
($ in thousands) |
|
Average Loans |
|
Net Charge-offs |
|
Ratio |
|
Average Loans |
|
Net Charge-offs |
|
Ratio |
||||||||||
Personal loans |
|
$ |
26,183,468 |
|
|
$ |
171,015 |
|
|
2.62 |
% |
|
$ |
18,414,581 |
|
|
$ |
129,970 |
|
|
2.83 |
% |
Student loans |
|
|
15,971,158 |
|
|
|
24,266 |
|
|
0.61 |
% |
|
|
10,107,155 |
|
|
|
23,747 |
|
|
0.94 |
% |
Home loans |
|
|
1,886,768 |
|
|
|
— |
|
|
— |
% |
|
|
540,994 |
|
|
|
— |
|
|
— |
% |
Secured loans |
|
|
674,915 |
|
|
|
— |
|
|
— |
% |
|
|
770,154 |
|
|
|
— |
|
|
— |
% |
Credit card |
|
|
483,283 |
|
|
|
9,212 |
|
|
7.65 |
% |
|
|
342,051 |
|
|
|
6,565 |
|
|
7.70 |
% |
Commercial and consumer banking |
|
|
180,488 |
|
|
|
18 |
|
|
0.04 |
% |
|
|
156,302 |
|
|
|
1 |
|
|
— |
% |
Total loans |
|
$ |
45,380,080 |
|
|
$ |
204,511 |
|
|
1.81 |
% |
|
$ |
30,331,237 |
|
|
$ |
160,283 |
|
|
2.12 |
% |
|
|
|
|
|
|
|
|
|
|
|
|
|
|
|
|
|
||||||
|
|
Six Months Ended
|
|
Six Months Ended
|
||||||||||||||||||
($ in thousands) |
|
Average Loans |
|
Net Charge-offs |
|
Ratio |
|
Average Loans |
|
Net Charge-offs |
|
Ratio |
||||||||||
Personal loans |
|
$ |
24,667,205 |
|
|
$ |
341,836 |
|
|
2.79 |
% |
|
$ |
18,345,733 |
|
|
$ |
280,044 |
|
|
3.08 |
% |
Student loans |
|
|
15,211,161 |
|
|
|
47,185 |
|
|
0.63 |
% |
|
|
9,579,563 |
|
|
|
34,344 |
|
|
0.72 |
% |
Home loans |
|
|
1,646,192 |
|
|
|
— |
|
|
— |
% |
|
|
447,541 |
|
|
|
— |
|
|
— |
% |
Secured loans |
|
|
739,993 |
|
|
|
— |
|
|
— |
% |
|
|
762,819 |
|
|
|
— |
|
|
— |
% |
Credit card |
|
|
473,699 |
|
|
|
16,859 |
|
|
7.18 |
% |
|
|
318,436 |
|
|
|
14,555 |
|
|
9.22 |
% |
Commercial and consumer banking |
|
|
178,351 |
|
|
|
266 |
|
|
0.31 |
% |
|
|
154,889 |
|
|
|
4 |
|
|
0.01 |
% |
Total loans |
|
$ |
42,916,601 |
|
|
$ |
406,146 |
|
|
1.91 |
% |
|
$ |
29,608,981 |
|
|
$ |
328,947 |
|
|
2.24 |
% |
Table 9 |
|||||||||||||||
Regulatory Capital |
|||||||||||||||
(Unaudited) |
|||||||||||||||
|
|
June 30, 2026 |
|
June 30, 2025 |
|
|
|||||||||
($ in thousands) |
|
Amount(1) |
|
Ratio(1) |
|
Amount |
|
Ratio |
|
Required Minimum(2) |
|||||
SoFi Technologies |
|
|
|
|
|
|
|
|
|
|
|||||
CET1 risk-based capital |
|
$ |
9,112,891 |
|
18.7 |
% |
|
$ |
4,804,043 |
|
14.3 |
% |
|
7.0 |
% |
Tier 1 risk-based capital |
|
|
9,112,891 |
|
18.7 |
% |
|
|
4,804,043 |
|
14.3 |
% |
|
8.5 |
% |
Total risk-based capital |
|
|
9,169,159 |
|
18.8 |
% |
|
|
4,851,605 |
|
14.4 |
% |
|
10.5 |
% |
Tier 1 leverage |
|
|
9,112,891 |
|
16.5 |
% |
|
|
4,804,043 |
|
12.9 |
% |
|
4.0 |
% |
Risk-weighted assets |
|
|
48,682,417 |
|
|
|
|
33,579,874 |
|
|
|
|
|||
Quarterly adjusted average assets |
|
|
55,260,718 |
|
|
|
|
37,311,694 |
|
|
|
|
|||
| ____________________ | ||
(1) |
Estimated. |
|
(2) |
Required minimums presented for risk-based capital ratios include the required capital conservation buffer. |
|
View source version on businesswire.com: https://www.businesswire.com/news/home/20260729569583/en/
Investors:
SoFi Investor Relations
IR@sofi.com
Media:
SoFi Media Relations
PR@sofi.com
Source: SoFi Technologies