
U.S. P&C Insurers Post Strong Underwriting Gains Through First Half of 2026; Line-Specific and Geographic Challenges Persist
Estimated combined ratio fell to 92.7, boosting underwriting strength, though losses remain uneven by line of business and state.
Sentiment and the balance of points
Rhea-AI Sentiment reads the wording of the document, how positive or negative its language is on a 1 to 5 scale. The balance of points shown with the takes weighs what the document actually discloses, so the two can disagree, for example when a trial that missed its main goal is described in upbeat language.
Rhea-AI Summary
Verisk (VRSK) and the American Property Casualty Insurance Association reported that U.S. private P&C insurers generated an estimated net underwriting gain of $31.7 billion in the first half of 2026, up from $11.6 billion a year earlier, helped by lower catastrophe losses and higher investment income.
Net written premium growth slowed to 2.1%, while net earned premiums rose 3.3%. The industry combined ratio improved to 92.7 from 96.5, and policyholders’ surplus climbed to $1.30 trillion, versus $1.13 trillion at mid‑2025. Net investment gains increased to $59.6 billion and net income after taxes rose 53% to $77.8 billion. Despite improved profitability, Verisk highlights ongoing challenges from elevated catastrophe exposure, affordability pressures, and worsening bodily injury and commercial liability losses, with performance varying significantly by line of business and state.
News Explained
The release’s additional catastrophe-exposure estimate is modeled: its
Details
News Market Reaction – VRSK
On Sep 2, the day this news came out, VRSK closed 3.19% below the previous close.
Data tracked by StockTitan Argus for the Sep 2 session.
Key Figures
- Underwriting Gain
- $31.7 billion vs. $11.6 billion
- First half of 2026 vs. first half of 2025
- Net Written Premium Growth
- 2.1% vs. 5.2%
- First half of 2026 vs. first half of 2025
- Policyholders' Surplus
- $1.30 trillion vs. $1.13 trillion
- Midyear 2026 vs. midyear 2025
- Combined Ratio
- 92.7 vs. 96.5
- First half of 2026 vs. prior year
- Net Investment Gains
- $59.6 billion vs. $49.0 billion
- First half of 2026 vs. first half of 2025
- Net Income
- $77.8 billion vs. $50.9 billion
- First half of 2026 vs. first half of 2025
- Incurred Losses and LAE
- -4.8% vs. 5.1%
- First half of 2026 vs. first half of 2025
- Modeled Insured Catastrophe Losses
- $171 billion globally; $117 billion U.S.
- Average annual insured catastrophe losses
Historical Context
-
Modeled global insured catastrophe losses reached a new company benchmark.
-
European insured losses faced pressure from catastrophes, inflation, and construction costs.
-
Verisk responded to a Delaware Chancery Court ruling involving AccuLynx.
-
Cargo theft losses more than doubled despite fewer reported incidents.
-
Verisk estimated insured losses from the Kumamoto earthquake in Japan.
24h Move is the share-price change in the day after each event; other market factors may also have contributed.
Key Terms
combined ratio financial
loss adjustment expenses financial
reinsurance financial
AI-generated analysis. How Rhea-AI works. Not financial advice.




Limited catastrophe losses and higher investment income supported continued profitability, though exposure and market pressures remain
JERSEY CITY, N.J., Sept. 02, 2026 (GLOBE NEWSWIRE) -- Verisk (Nasdaq: VRSK), a leading strategic data analytics and technology partner to the global insurance industry, and the American Property Casualty Insurance Association (APCIA), the primary national trade association for home, auto and business insurers, today reported an estimated net underwriting gain of
According to key financial indicators for private U.S. P&C insurers, while industry underwriting gains improved during the first half of 2026, performance varied by line of business and geography. Net written premium growth slowed to 2.1 percent, reflecting competitive market conditions as rate increases moderated. Policyholders' surplus increased to
Property lines softened, while casualty lines remained under pressure despite signs that the hard casualty market is beginning to cool. Affordability also remains a challenge for many property owners and businesses, as rising construction costs and claim severity continue to influence rebuilding costs and recovery after losses.
"First-half results should not be mistaken as evidence that underlying risk has diminished," said Saurabh Khemka, president of Verisk Underwriting Solutions. "Broader industry performance highlights the growing value of precision as property market conditions continue to soften. Increased market segmentation means insurers may benefit from a deeper understanding of exposures, claims behavior and portfolio performance to help support profitable growth as pricing becomes more competitive."
For insurers, this environment reinforces the need to evaluate risk at a more granular level and closely monitor changes in exposure, claim severity and portfolio mix.
Khemka continued, "The value of precision is particularly important given the scale of natural catastrophe exposure facing the industry. Verisk's 2026 Global Modeled Catastrophe Losses Report* indicates that the industry faces approximately
Underwriting Industry Financial Results Through First-Half 2026
- Written premiums: Net written premium growth slowed to 2.1 percent, compared to 5.2 percent during the same period in 2025.
- Earned premiums: Net earned premiums rose 3.3 percent, compared to 7.3 percent during the same period in 2025.
- Underwriting gain: The U.S. P&C insurance industry posted an estimated net underwriting gain of
$31.7 billion , compared with$11.6 billion through the first six months of 2025. - Incurred losses and loss adjustment expenses: Incurred losses and loss adjustment expenses decreased by 4.8 percent, compared to a 5.1 percent increase during the first half of 2025. The industry's combined ratio improved to 92.7, compared with 96.5 a year earlier, marking one of the strongest half-year underwriting performances in recent history.
- Surplus: Policyholders' surplus increased to
$1.30 trillion , compared with$1.13 trillion at midyear 2025. - Net investment gains: Net investment gains increased to
$59.6 billion , compared with$49.0 billion during the same period in 2025. - Net income: Net income after taxes increased 53 percent to
$77.8 billion , compared with$50.9 billion in the first half of 2025.
“In good news for policyholders, premium increases continued to moderate in the first half of 2026, falling below general inflation and building materials and labor costs. Net written premium growth slowed to 2.1 percent in H1 2026, from 5.2 percent in H1 2025 and a recent peak of 10.8 percent in H1 2024,” said Robert Gordon, senior vice president of policy, research and international at APCIA. “While overall industry profitability improved in the first half of 2026, largely due to a decline in insured natural-catastrophe losses compared to the first half of 2025 following the Los Angeles wildfires, insurers’ loss experience and profitability varied widely from state to state. In states that have enacted meaningful legal system abuse reforms, including Florida, Georgia and Louisiana, many policyholders have begun to experience reductions in auto and homeowners’ insurance rates that are expected to provide hundreds of millions of dollars in premium relief.”
“While insured natural-catastrophe losses provided a temporary reprieve in the first half of 2026, bodily injury and commercial liability losses continued to worsen. Excess liability, umbrella liability, commercial auto, and other casualty lines experienced ongoing pressure from escalating claim severity, nuclear verdicts, and rising medical costs,” concluded Gordon.
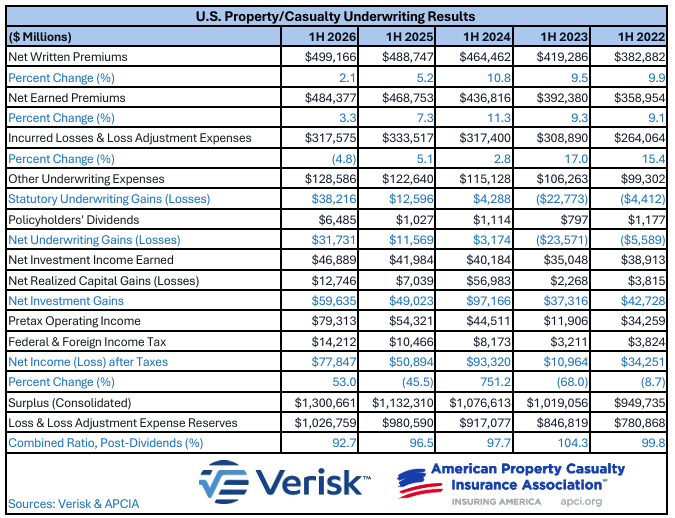
Note: The results above are based on quarterly statements filed with insurance regulators by private property/casualty insurers domiciled in the United States, including reinsurers, excess and surplus insurers, and domestic insurers owned by foreign parents, and exclude state funds for workers' compensation and other residual market insurers, the National Flood Insurance Program, and foreign insurers. The figures are consolidated estimates based on reports accounting for about 97.4 percent of all business written by U.S. property/casualty insurers. All figures are net of reinsurance unless otherwise noted and occasionally may not balance due to rounding. Net investment results displayed are post-tax.
*Average annual insured catastrophe losses (AAL) are a modeled value that represents the average of a very large range of modeled possibilities of catastrophic events across perils, globally, that can occur in any given year under today's exposure and climate conditions.
About Verisk
Verisk (Nasdaq: VRSK) is a leading strategic data analytics and technology partner to the global insurance industry. It empowers clients to strengthen operating efficiency, improve underwriting and claims outcomes, combat fraud and make informed decisions about global risks, including climate change, catastrophic events, sustainability and political issues. Through advanced data analytics, software, scientific research and deep industry knowledge, Verisk helps build global resilience for individuals, communities and businesses. With teams across more than 20 countries, Verisk consistently earns certification by Great Place to Work. For more, visit Verisk.com and the Verisk Newsroom.
Attachment

Morgan Hurley
Verisk
551-655-7858
morgan.hurley@verisk.com
FAQ
AI-generated questions and answers. How Rhea-AI works. Not financial advice.