
STOCK TITAN

U.S. Consumer Debt Hits $18.19 Trillion in Q1 2026

(Neutral)
(Neutral)
Tags

Equifax (NYSE:EFX) reports U.S. consumer debt reached an all‑time high of $18.19 trillion in March 2026. Growth is driven by subprime consumers, with new bankcard accounts up 8.1% YoY and subprime originations up 18.6%. Student loan 90+ day delinquencies rose to 17.01%, while most other credit categories showed modestly improving delinquency rates but higher write-offs, suggesting portfolio normalization.

Loading...
Loading translation...

Positive

  • None.

Negative

  • None.

News Market Reaction – EFX

+0.09%
+0.09% Session close to close

In the May 28 session, EFX gained 0.09%, reflecting a mild positive market reaction.

Data tracked by StockTitan Argus on the day of publication.

Market Context

This announcement details U.S. credit dynamics using Equifax data, with total consumer debt at $18.1...
Analysis

This announcement details U.S. credit dynamics using Equifax data, with total consumer debt at $18.19T, faster growth in subprime bankcard accounts and limits, and student loan 90+ day delinquencies reaching 17.01%. At the same time, most non‑student loan delinquency rates improved year-over-year. In context of recent record revenue and ongoing partnerships, investors may monitor how these borrower trends influence demand for Equifax analytics and lender risk management tools, alongside the flexibility provided by its effective shelf registration.

Key Figures

Total consumer debt: $18.19T Bankcard balances YoY: almost 4% increase New bankcard accounts: 8.1% increase +5 more
8 metrics
Total consumer debt $18.19T U.S. consumer debt balances in March 2026
Bankcard balances YoY almost 4% increase Revolving bankcard balances vs prior year
New bankcard accounts 8.1% increase Year-over-year growth as of January 2026
Subprime bankcard originations 18.6% increase New subprime bankcard accounts over 12 months to Jan 2026
Subprime credit limits 37.6% increase Credit limits vs prior January for subprime group
Student loan 90+ delinquency 17.01% Student loans 90+ days past due in March 2026
Unsecured personal loan delinquencies 3.18% 60+ day delinquency rate in March 2026
Student loan debt $1,302B Student loan balances in March 2026 (YoY -0.9%)

Historical Context

5 past events · Latest: May 20 (Positive)
Pattern 5 events
Date Event Sentiment 24h Move Catalyst
May 20 Partnership expansion Positive +0.9% Expanded identity and fraud partnership coverage into the U.S. and globally.
May 07 Dividend declaration Positive +1.4% Board declared a quarterly cash dividend continuing a long payment history.
May 01 Conference participation Neutral -0.9% Announced attendance and fireside chats at multiple investor conferences.
Apr 24 Product partnership Positive -1.4% Launched Ataeva tools using Equifax credit data to optimize issuer portfolios.
Apr 21 Earnings report Positive -3.0% Reported record Q1 2026 revenue beating guidance with higher EPS and buybacks.

24h Move is the share-price change in the day after each event; other market factors may also have contributed.

Pattern Detected

Recent positive corporate updates, including record revenue and partnerships, have often seen mixed to negative next-day price reactions, indicating a tendency toward divergence on good news.

Recent Company History

Over the past months, Equifax reported several constructive developments, including a record Q1 2026 revenue of $1.649 billion and a quarterly dividend of $0.56 per share, while also announcing new partnerships and investor conference participation. Despite broadly positive operational news, price reactions were split, with three of the last five updates seeing negative moves. Today’s macro consumer credit trends report adds context around U.S. borrower behavior to earlier company-specific growth and capital return announcements.

Key Terms

subprime, bankcard, delinquency rate, write-off rates, +4 more
8 terms
subprime financial
"This increase is largely fueled by a surge of subprime borrowers opening new bankcards."
Subprime describes loans or borrowers considered to have a higher risk of default because they have weaker credit histories or financial stability. These loans often come with higher interest rates to compensate for the increased risk. For investors, subprime assets can be more volatile and may pose greater financial risk if borrowers are unable to repay.
bankcard financial
"Outstanding balances in revolving credit, specifically bankcard, are up almost 4% year-over-year..."
A bankcard is a plastic or digital payment card issued by a bank—such as a debit, credit or ATM card—that lets a customer pay for goods, withdraw cash or access account services. For investors, changes in bankcard use reveal consumer spending trends, fee and interest income potential, and credit risk exposure, much like a store’s sales register showing how busy and profitable the business is.
delinquency rate financial
"Student loan delinquencies continued to trend upward as the 90+ days past due delinquency rate reached 17.01% in March."
The delinquency rate measures the share of loans or credit accounts with payments past their due date, usually expressed as a percentage of the total loan balance or number of accounts. It matters to investors because rising delinquency rates are an early warning that borrowers are struggling, which can lead to higher losses, tighter lending and weaker profits for banks, lenders and investors in loan-backed securities — like seeing more people miss car payments in a town.
write-off rates financial
"This positive trend in delinquency rates was contrasted by rising write-off rates."
Write-off rates measure the portion of loans, receivables or other assets a company deems uncollectible and removes from its books, usually expressed as a percentage of the total portfolio. Investors care because rising write-off rates are like finding more rotten apples in a basket: they signal poorer credit quality or operational problems, reduce reported profits and can erode capital or future cash flows.
K-shaped technical
"a deepening "K-shaped" credit landscape characterized by an increased reliance on subprime bankcards..."
K-shaped describes an economic or market pattern where different groups or sectors diverge sharply: some recover or grow strongly while others continue to decline. For investors it signals uneven risk and opportunity—winners may outpace the broader market while losers lag, so portfolio performance can vary widely depending on exposure, much like two paths on a hill where one goes up and the other down.
forbearance financial
"Existing student loan balances continue to decrease due to servicer adjustments for interest waivers and forbearance..."
A temporary agreement between a borrower and lender to pause, reduce or delay loan payments when the borrower is facing financial difficulty. It matters to investors because forbearance changes expected cash flows and the risk of eventual default for loans or debt-backed assets—similar to a landlord agreeing to let a tenant skip rent for a few months; it can preserve value short-term but may signal elevated credit stress.
income-based repayment financial
"borrowers transitioning from the Saving on a Valuable Education (SAVE) Plan to other income-based repayment programs."
An income-based repayment plan sets a borrower’s loan payments as a percentage of their income rather than a fixed monthly amount, so payments rise or fall with earnings much like a utility bill that changes with usage. Investors care because these plans affect borrowers’ ability to repay, consumer spending, default rates, and the timing and size of cash flows for lenders, loan servicers, and entities exposed to student- or income-linked debt.
payment hierarchy financial
"we may begin to see disruption in this 'payment hierarchy', potentially introducing stress into other credit categories."
An ordering of who gets paid first when a company or financial structure distributes cash—think of it as a ladder that determines which creditors, bondholders, shareholders or investors collect money before others. It matters because your place in the hierarchy directly affects how much you can recover and how risky your investment is: higher-priority positions are safer but usually yield lower returns, while lower-priority positions face greater loss risk but often promise higher potential rewards.

AI-generated analysis. How Rhea-AI works. Not financial advice.

See more from StockTitan in Google Search and AI answers. Adds StockTitan as a preferred source · opens Google
Add on Google

Subprime Borrower Activity Fuels Bankcard Growth; Delinquency Rates Improve for Most Loans, but Rise for Student Debt
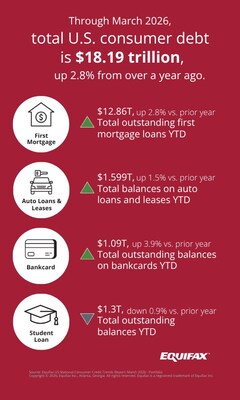
ATLANTA, May 28, 2026 /PRNewswire/ -- Equifax® (NYSE: EFX) has released its Market Pulse First Quarter U.S. Consumer Credit Trends, which includes U.S. national consumer credit data and trends through March 2026 sourced from Equifax proprietary data. Consumer debt balances reached an all-time high of $18.19 trillion in March, heavily influenced by an increase in subprime borrowers opening new bank cards and carrying higher balances. The data showed signs of stabilization in some delinquency rates, a deepening "K-shaped" credit landscape characterized by an increased reliance on subprime bankcards and rising student loan defaults, and strategic lender efforts to improve asset quality through higher write-off rates.

Increased Reliance on Credit Among Subprime Consumers

Outstanding balances in revolving credit, specifically bankcard, are up almost 4% year-over-year, which is outpacing the March 2026 inflation rate of 3.3%. This increase is largely fueled by a surge of subprime borrowers opening new bankcards. Overall, the number of new bankcard accounts grew by 8.1% year-over-year as of January 2026, with subprime originations specifically experiencing an 18.6% increase in new accounts over this 12-month period. Additionally, credit limits among this group increased 37.6% compared to the previous January.

"We are seeing an expansion in the subprime market that underscores the widening gap of the K-shaped economy," said Maria Urtubey, Equifax Advisor. "Lenders originating more bankcard accounts for consumers in subprime while also increasing total credit limits suggests that, for the lower economic tier, credit may have moved beyond a financial tool and may be becoming a necessity for managing the rising costs of living."

Fewer Student Loans Being Originated but Origination Amounts and Delinquency Rates Continues to Grow

While the number of new student loan accounts declined by more than 10% year-over-year as of January 2026, the dollar amount originated still increased by 4.7%, likely reflecting the rising costs of education.

Existing student loan balances continue to decrease due to servicer adjustments for interest waivers and forbearance, as well as borrowers transitioning from the Saving on a Valuable Education (SAVE) Plan to other income-based repayment programs.

Student loan delinquencies continued to trend upward as the 90+ days past due delinquency rate reached 17.01% in March. This increase marks the fourth consecutive month of student loan delinquency increases, although the rate remains more than 9% below the historic peak recorded in May 2025.

"Historically, consumers have prioritized mortgage and auto payments over student loans," said Urtubey. "However, as stricter enforcement measures are restarted, we may begin to see disruption in this 'payment hierarchy', potentially introducing stress into other credit categories."

Improving Delinquencies But Rising Write-Offs Suggest Normalization

Outside of student loans, most consumer credit indicators showed improving 60+ day delinquency rates month-over-month.

  • Unsecured personal loans dropped from 3.49% in March 2025 to 3.18% in March 2026.
  • Bankcards fell from 3.09% in March 2025 to 2.97% in March 2026.
  • And auto loans slightly decreased from 1.51% in March 2025 to 1.49% in March 2026.

This positive trend in delinquency rates was contrasted by rising write-off rates. Both bankcard and auto portfolios saw an increase in write-off rates. Bankcard write-off rates were up 0.9 basis points and auto loans and leases rose up to 27.5 basis points. Typically, delinquencies and write-offs move in tandem, however, the current data demonstrates more of a "lagging indicator," representing accounts that likely became delinquent months ago and have finally reached the point of being uncollectible. Additionally, lenders may be more proactively recognizing losses to rationalize their balance sheets for the 2026 fiscal year.

"For consumers, the fact that delinquency rates are trending positively is an early indicator of resilience," Urtubey said. "For the financial system, the rising write-offs represent a necessary adjustment to bring risk levels back to a sustainable baseline."

Month-Over-Month and Year-Over-Year Results

Total Consumer Debt Balances

Month

Total Consumer Debt ($T)

MoM Change (%)

YoY Change (%)

January 2026

$18.21

0.1 %

2.9 %

February 2026

$18.19

-0.1 %

2.9 %

March 2026

$18.19

0.0 %

2.8 %

First Mortgage Balances

Month

First Mortgage Balances ($B)

MoM Change (%)

YoY Change (%)

January 2026

$12,827

0.0 %

3.1 %

February 2026

$12,854

0.2 %

3.1 %

March 2026

$12,860

0.1 %

2.8 %

Home Equity Lines of Credit (HELOC) Balances

Month

HELOC Balances ($B)

MoM Change (%)

YoY Change (%)

January 2026

$426.2

1.1 %

12.7 %

February 2026

$427.8

0.4 %

12.8

March 2026

$431.0

0.7 %

13.0 %

Auto Loan Balances

Month

Auto Loan Balances ($B)

MoM Change (%)

YoY Change (%)

January 2026

$1,594

0.3 %

0.7 %

February 2026

$1,594

0.0 %

0.7 %

March 2026

$1,599

0.4 %

1.5 %

Bankcard Balances

Month

Bankcard Balances ($B)

MoM Change %

YoY Change (%)

January 2026

$1,122.3

-0.1 %

4.0 %

February 2026

$1,100.1

-2.0 %

4.2 %

March 2026

$1,085.2

-1.4 %

3.9 %

Student Loans Balances

Month

Student Loan Debt ($B)

MoM Change %

YoY Change (%)

January 2026

$1,316

-1.0 %

-2.4 %

February 2026

$1,305

-0.8 %

1.4%

March 2026

$1,302

-0.2 %

-0.9 %

Equifax has been tracking U.S. National Consumer Credit Trends for more than 20 years. Monthly reports can be found on Equifax.com. These reports track originations, balances and delinquencies on U.S. consumer mortgages, auto loans and leases, student loans, bankcards and private label credit cards, and personal loans. To explore Equifax tools that deliver U.S. National Consumer Credit Trends data and key market metrics click here.

*To view the included graphic, click here.

ABOUT EQUIFAX INC. 

At Equifax (NYSE: EFX), we believe knowledge drives progress. As a global data, analytics, and technology company, we play an essential role in the global economy by helping financial institutions, companies, employers, and government agencies make critical decisions with greater confidence. Our unique blend of differentiated data, analytics, and cloud technology drives insights to power decisions to move people forward. Headquartered in Atlanta and supported by nearly 15,000 employees worldwide, Equifax operates or has investments in 24 countries in North America, Central and South America, Europe, and the Asia Pacific region. For more information, visit Equifax.com

FOR MORE INFORMATION:
Tiffany Smith for Equifax
mediainquiries@equifax.com

Cision View original content to download multimedia:https://www.prnewswire.com/news-releases/us-consumer-debt-hits-18-19-trillion-in-q1-2026--302783707.html

SOURCE Equifax Inc.

FAQ

What was total U.S. consumer debt in Q1 2026 according to Equifax (EFX)?

U.S. consumer debt reached an all-time high of $18.19 trillion in March 2026. According to Equifax, balances were $18.21 trillion in January, $18.19 trillion in February, and $18.19 trillion in March, with year-over-year growth of about 2.8–2.9%.

How are subprime bankcard originations changing in early 2026 per Equifax (EFX)?

Subprime bankcard originations are rising sharply, with new subprime accounts up 18.6% year-over-year as of January 2026. According to Equifax, overall new bankcard accounts grew 8.1% YoY, and credit limits for subprime borrowers increased 37.6% compared with the prior January.

How did delinquency rates for personal loans, bankcards and auto loans change by March 2026?

Most 60+ day delinquency rates improved year-over-year by March 2026. According to Equifax, unsecured personal loan delinquencies fell from 3.49% to 3.18%, bankcards from 3.09% to 2.97%, and auto loans from 1.51% to 1.49% between March 2025 and March 2026.

What do rising credit write-offs in Q1 2026 indicate in Equifax (EFX) data?

Credit write-offs are increasing even as delinquencies stabilize or improve in several categories. According to Equifax, bankcard write-offs rose 0.9 basis points and auto loan and lease write-offs increased 27.5 basis points, reflecting recognition of older delinquencies and lenders rationalizing balance-sheet risk.

How did HELOC and auto loan balances move in Q1 2026 according to Equifax?

HELOC and auto loan balances both grew modestly in early 2026. According to Equifax, HELOC balances reached $431.0 billion in March, up about 13.0% YoY, while auto loan balances rose to $1.599 trillion, reflecting 1.5% year-over-year growth.
