
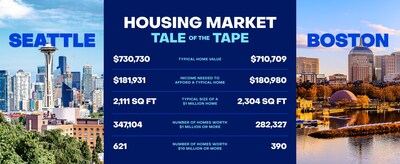
Boston and Seattle are playing for a trophy, and a home value boost might follow for the winner
Zillow (Z) analysis finds the metro that wins the professional football championship has outpaced U.S. home value growth 13 of the past 20 years.
Sentiment and the balance of points
Rhea-AI Sentiment reads the wording of the document, how positive or negative its language is on a 1 to 5 scale. The balance of points shown with the takes weighs what the document actually discloses, so the two can disagree, for example when a trial that missed its main goal is described in upbeat language.
Rhea-AI Summary
Zillow (Z) analysis finds the metro that wins the professional football championship has outpaced U.S. home value growth 13 of the past 20 years. On average, a typical home in the winning metro gained $4,437 more than the U.S. market in the subsequent year.
Largest outperformance examples: Tampa (2021) +$25,262 vs national average, Denver (2016) +$21,459, Boston (2017) +$15,565. Some winners underperformed, including New York (2008) -$15,741 versus the national change.
Details
News Market Reaction – Z
On Feb 3, the day this news came out, Z closed 5.73% below the previous close.
Data tracked by StockTitan Argus for the Feb 3 session.
Key Figures
- Years analyzed
- 20 years
- Span of professional football championship home-value analysis
- Outperformance frequency
- 13 of 20 years
- Championship metros beating U.S. home value growth
- Average extra gain
- $4,437
- Typical home gain above national market after a championship
- Tampa post-title gain
- $25,262
- Extra home value appreciation vs national after 2021 championship
- Denver post-2016 gain
- $21,459
- Extra home value appreciation vs national after 2016 title
- Boston post-2017 gain
- $15,565
- Extra home value appreciation vs national after 2017 title
- New York post-2008 drop
- -$15,741
- Underperformance vs national after 2008 championship
- Tampa 2021 home growth
- $69,867
- Typical home value growth in year after 2021 championship
Historical Context
-
Launch of national 'Someday Starts Today' campaign across TV and digital.
-
Release of rankings for 2026’s most buyer-friendly U.S. housing markets.
-
Announcement of Q4 and full-year 2025 results release and conference call.
-
Forecast that typical mortgages may be affordable in 20 large metros by Dec 2026.
-
Designation of Hartford as Zillow’s hottest U.S. housing market for 2026.
24h Move is the share-price change in the day after each event; other market factors may also have contributed.
Key Terms
zillow home value index financial
zestimate financial
AI-generated analysis. How Rhea-AI works. Not financial advice.




Zillow data shows championship markets usually beat national home value growth in the year after winning football's biggest game
- In 13 of the past 20 years, the metro area that won the professional football championship saw home values grow faster than the
U.S. average in the year that followed, according to the Zillow Home Value Index. - On average, the typical home in a championship market gained
$4,437 U.S. home in the year after the win.
Over the past 20 years, home values in the metro area that wins the professional football championship have grown an average of
"While this is a fun trend, it's highly unlikely that a championship football team is the driving force causing home values to grow. A win on the field brings bragging rights, but unfortunately won't boost your Zestimate," said Zillow Senior Economist Kara Ng. "Regardless of the outcome, the good news is that we are trending toward a healthier market nationwide, with more homes for sale and buyers better able to afford them."
Some markets really ran up the score. Homeowners in the
Not every champion followed up its trophy win with a real estate boom. In the
For home buyers looking for data and tools they can actually count on, the BuyAbilitySM tool from Zillow Home Loans gives buyers a personalized, real-time estimate of the home price and monthly payment that fit within their budget.
Metro Area | Year of Championship | Typical Home Value Growth in | Difference Compared to |
2006 | - | ||
2007 | |||
2008 | - | - | |
2009 | |||
2010 | - | ||
2011 | - | ||
2012 | - | ||
2013 | - | ||
2014 | |||
2015 | |||
2016 | |||
2017 | |||
2018 | - | ||
2019 | |||
2020 | - | ||
2021 | |||
2022 | - | ||
2023 | |||
2024 | |||
2025 |
*As of January 2026 |
About Zillow Group
Zillow Group, Inc. (Nasdaq: Z and ZG) is reimagining real estate to make home a reality for more and more people.
As the most visited real estate app and website in
Zillow's ecosystem spans the entire home journey — from dreaming and shopping to renting, buying, selling and financing.
Zillow Group's affiliates, subsidiaries and brands include Zillow®, Zillow Premier Agent®, Zillow Home Loans®, Zillow Rentals®, Zillow® New Construction, Trulia®, StreetEasy®, Out East®, HotPads®, Follow Up Boss®, ShowingTime®, dotloop® and Zillow® Closing.
All marks herein are owned by MFTB Holdco, Inc., a Zillow affiliate. Zillow Home Loans, LLC is an Equal Housing Lender, NMLS #10287 (www.nmlsconsumeraccess.org). © 2026 MFTB Holdco, Inc., a Zillow affiliate.

 View original content to download multimedia:https://www.prnewswire.com/news-releases/boston-and-seattle-are-playing-for-a-trophy-and-a-home-value-boost-might-follow-for-the-winner-302677324.html
SOURCE Zillow
FAQ
AI-generated questions and answers. How Rhea-AI works. Not financial advice.