
The Hackett Group® Study Finds €1.26 Trillion Remains Trapped in Working Capital Across Europe’s Largest Companies
The estimated working capital opportunity declined 8% from the previous year, but still represented 14% of annual revenue.
Sentiment and the balance of points
Rhea-AI Sentiment reads the wording of the document, how positive or negative its language is on a 1 to 5 scale. The balance of points shown with the takes weighs what the document actually discloses, so the two can disagree, for example when a trial that missed its main goal is described in upbeat language.


Cash conversion cycles improved 1.8 days despite weakening profitability, underscoring the need for process-led transformation to sustain gains
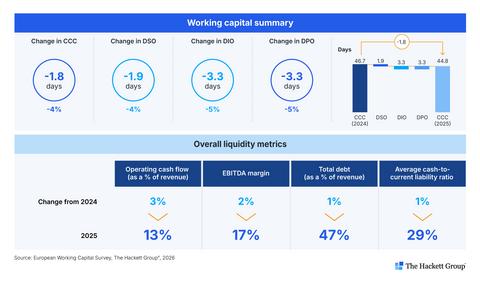
By working capital measures, the 1,000 largest European public companies had a good year. The Hackett Group’s 2026 European Working Capital Survey found the average cash conversion cycle (CCC) improved by 1.8 days (
The study, which analyzed the 1,000 largest nonfinancial publicly traded companies headquartered in
The improvements came despite weakening financial performance. Revenue grew just
“One of this year’s most significant findings is the divergence between working capital performance and broader financial performance,” said Anne Morgan-Smith, director at The Hackett Group® and author of the research. “With revenue growth slowing and profitability under pressure, working capital efficiency is becoming an increasingly important source of self-funded liquidity. By releasing cash tied up in receivables and inventory, companies can help fund operations, reduce borrowing needs and preserve capacity for strategic investment.”
Despite recent improvements, significant opportunities remain. While the total working capital opportunity declined
-
€464 billion in accounts payable opportunity (37% ) -
€404 billion in inventory opportunity (32% ) -
€391 billion in accounts receivable opportunity (31% )
With the opportunity distributed relatively evenly across all three areas, isolated initiatives are unlikely to deliver substantial gains. Sustainable improvement will require a coordinated approach to working capital management.
The research also suggests that one of the most widely used working capital strategies of recent years is becoming more constrained. Days payable outstanding (DPO) fell by 3.3 days in 2025 after two years of improvement, partially offsetting gains in receivables and inventory. While several factors may have contributed to the decline, growing pressure from suppliers, regulators and other stakeholders is limiting companies’ ability to extend payment terms.
Although payables represent the largest share of the remaining opportunity, these constraints make receivables and inventory increasingly important areas for future improvement. The research highlights opportunities in commercial payment term strategy, demand forecasting, inventory optimization, dispute resolution and collections management processes.
AI-enabled process redesign could help organizations address these challenges and accelerate working capital improvements. Separate AI World Class benchmark modeling by The Hackett Group® shows that redesigned order-to-cash processes could reduce dispute resolution times from 48 to 27 days and average days delinquent from 9.9 to 1.5 days. These modeled performance levels illustrate the potential of combining AI with process, governance and operating model changes rather than automating existing workflows.
“The opportunity isn’t simply to automate collections or invoice processing. It’s to rethink how cash moves through the business,” said Morgan-Smith. “AI can help organizations improve forecasting, resolve disputes faster and optimize payment processes, but the greatest value comes when those capabilities are integrated into end-to-end processes. That’s how companies can turn short-term working capital gains into sustainable improvements.”
The complete findings and recommendations are available in The Hackett Group’s 2026 European Working Capital Survey.
About The Hackett Group®
The Hackett Group, Inc. (NASDAQ: HCKT) is an ROI-led, AI enterprise transformation firm that helps clients enable AI World Class performance. Its experts and engineers leverage Hackett AI platforms, including XT™, AIXelerator™, Hackett AI XPLR™, ZBrain® and XDA™, to accelerate and enhance the delivery of the company’s solutions and services.
The Hackett AI platforms are powered by the company’s domain-specific Solution Language Model informed by Hackett Process and Performance Intelligence, including Digital World Class® and AI World Class benchmark metrics, industry-specific best-practice process flows and service delivery model frameworks. The Hackett Group’s proprietary insights are based on benchmarking results from leading global organizations, including
Trademarks
The Hackett Group®, quadrant logo, ZBrain® and Digital World Class® are the registered marks of The Hackett Group®.
Cautionary Statement Regarding “Forward-Looking” Statements
This release contains “forward-looking” statements within the meaning of Section 27A of the Securities Act of 1933 as amended and Section 21E of the Securities Exchange Act of 1934, as amended. Statements including without limitation, words such as “expects,” “anticipates,” “intends,” “plans,” “believes,” “seeks,” “estimates,” or other similar phrases or variations of such words or similar expressions indicating, present or future anticipated or expected occurrences or outcomes are intended to identify such forward-looking statements. Forward-looking statements are not statements of historical fact and involve known and unknown risks, uncertainties and other factors that may cause the Company’s actual results, performance or achievements to be materially different from the results, performance or achievements expressed or implied by the forward-looking statements. Factors that may impact such forward-looking statements include without limitation, the ability of The Hackett Group® to effectively market its digital transformation services, our ability to transition our capabilities to support generative artificial intelligence (AI)-related consulting services and solutions and other consulting services, our ability to effectively integrate acquisitions into our operations, our ability to manage joint ventures and successfully cooperate with our joint venture partners, competition from other consulting and technology companies that may have or develop in the future, similar offerings, the commercial viability of The Hackett Group® and its services as well as other risk detailed in The Hackett Group’s reports filed with the United States Securities and Exchange Commission. The Hackett Group® does not undertake any duty to update this release or any forward-looking statements contained herein.
View source version on businesswire.com: https://www.businesswire.com/news/home/20261104644794/en/
Source: The Hackett Group, Inc.